Coder Social home page Coder Social logo

edinburgh-genome-foundry / dnafeaturesviewer Goto Github PK

View Code? Open in Web Editor NEW
562.0 19.0 88.0 15.89 MB

:eye: Python library to plot DNA sequence features (e.g. from Genbank files)

Home Page: https://edinburgh-genome-foundry.github.io/DnaFeaturesViewer/

License: MIT License

Python 100.00%
genbank visualization synthetic-biology molecular-biology bioinformatics dna-visualization

dnafeaturesviewer's Introduction

DNA Features Viewer Logo

DNA Features Viewer

GitHub CI build status

image

DNA Features Viewer (full documentation here) is a Python library to visualize DNA features, e.g. from GenBank or GFF files, or Biopython SeqRecords:

DNA Features Viewer automatically produce simple and clear plots even for sequences with many overlapping features and long labels. The libray plays well with Matplotlib and Biopython, and the plots can be output to many different formats (PNG, JPEG, SVG, PDF), e.g. for report generation, article figures, or LIMS interfaces.

Installation

If you have PIP installed, just type in a terminal:

pip install dna_features_viewer

DNA Features Viewer can be installed by unzipping the source code in one directory and using this command:

python setup.py install

If you intend to use the bokeh features, you need to also install Bokeh and Pandas:

pip install bokeh pandas

To parse GFF files, install the bcbio-gff library:
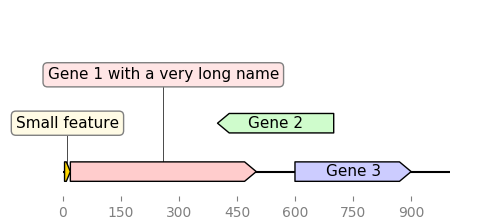
pip install bcbio-gff

Examples of use

Basic plots

In this first example we define features "by hand":

from dna_features_viewer import GraphicFeature, GraphicRecord
features=[
    GraphicFeature(start=0, end=20, strand=+1, color="#ffd700",
                   label="Small feature"),
    GraphicFeature(start=20, end=500, strand=+1, color="#ffcccc",
                   label="Gene 1 with a very long name"),
    GraphicFeature(start=400, end=700, strand=-1, color="#cffccc",
                   label="Gene 2"),
    GraphicFeature(start=600, end=900, strand=+1, color="#ccccff",
                   label="Gene 3")
]
record = GraphicRecord(sequence_length=1000, features=features)
record.plot(figure_width=5)

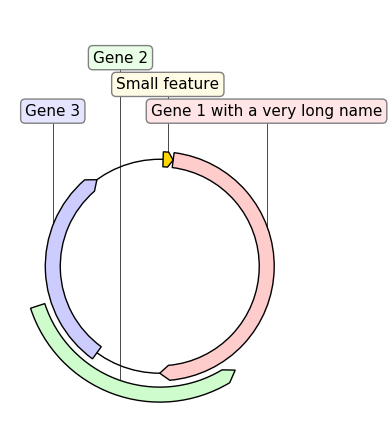
If we replace GraphicRecord by CircularGraphicRecord in the code above we obtain a circular plot of the construct:

It is also possible to generate interactive (browser-based) plots by using plot_with_bokeh instead of plot:

Nucleotide sequences, translations, and cropping

DNA Features Viewer allows to plot nucleotide or amino acid sequences under the record plot:

from dna_features_viewer import GraphicFeature, GraphicRecord

sequence = "ATGCATGCATGCATGCATGCATGCATGC"
record = GraphicRecord(sequence=sequence, features=[
    GraphicFeature(start=5, end=10, strand=+1, color='#ffcccc'),
    GraphicFeature(start=8, end=15, strand=+1, color='#ccccff')
])

ax, _ = record.plot(figure_width=5)
record.plot_sequence(ax)
record.plot_translation(ax, (8, 23), fontdict={'weight': 'bold'})
ax.figure.savefig('sequence_and_translation.png', bbox_inches='tight')

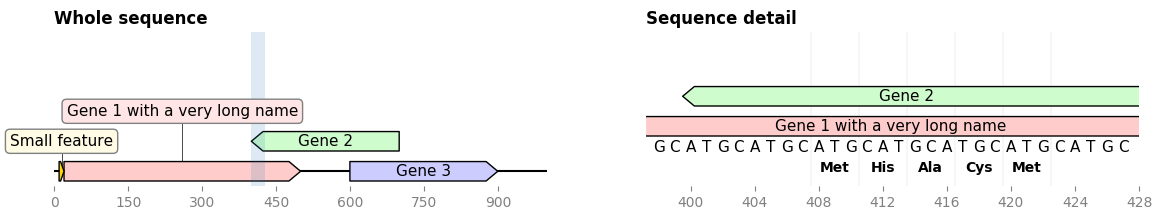
This enables for instance to plot an overview of a sequence along with a detailed detail of a sequence subsegment (full code)

...
record.plot(ax=ax1)
cropped_record = record.crop((zoom_start, zoom_end))
cropped_record.plot(ax=ax2)
cropped_record.plot_sequence(ax=ax2)
cropped_record.plot_translation(ax=ax2, location=(408, 423))

Reading the features from a GenBank or GFF file

DnaFeaturesViewer plays nice with BioPython. As a result it is super easy to plot the content of a Biopython record, or directly a GenBank (or GFF) file:

from dna_features_viewer import BiopythonTranslator
graphic_record = BiopythonTranslator().translate_record("my_sequence.gb")
ax, _ = graphic_record.plot(figure_width=10, strand_in_label_threshold=7)

Note 1: the script uses strand_in_label_threshold=7 to indicate the strand with an arrow in the annotation text for every feature less than ~7 pixels in width.

Note 2: the BiopythonTranslator class determines how the genbank information is transformed into graphical features. It enables to chose which categories of features to plot, the color of the different features.

Note 3: parsing GFF files requires the BCBio library (pip install bcbio-gff). This library also enables to extract Biopython records from GFF files containing several records (using GFF.parse("records.gff")).

Displaying the features along with other plots

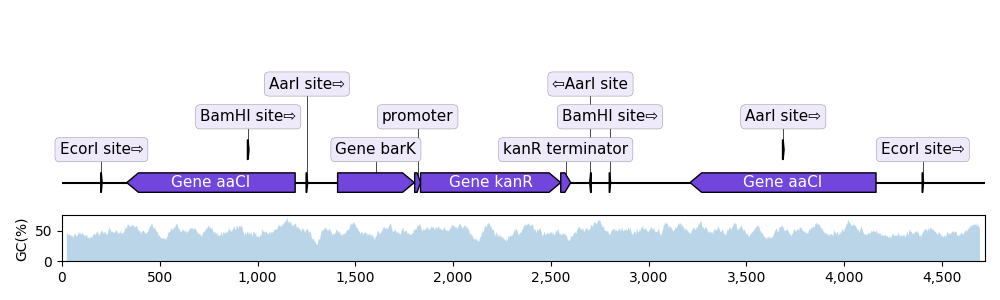
As it uses Matplotlib, DNA Features Viewer can display the features on top of other sequences statistics, such as the local GC content:

import matplotlib.pyplot as plt
from dna_features_viewer import BiopythonTranslator
from Bio import SeqIO
import numpy as np

fig, (ax1, ax2) = plt.subplots(
    2, 1, figsize=(12, 3), sharex=True, gridspec_kw={"height_ratios": [4, 1]}
)

# PLOT THE RECORD MAP
record = SeqIO.read("example_sequence.gb", "genbank")
graphic_record = BiopythonTranslator().translate_record(record)
graphic_record.plot(ax=ax1, with_ruler=False, strand_in_label_threshold=4)

# PLOT THE LOCAL GC CONTENT (we use 50bp windows)
gc = lambda s: 100.0 * len([c for c in s if c in "GC"]) / 50
xx = np.arange(len(record.seq) - 50)
yy = [gc(record.seq[x : x + 50]) for x in xx]
ax2.fill_between(xx + 25, yy, alpha=0.3)
ax2.set_ylim(bottom=0)
ax2.set_ylabel("GC(%)")

Multi-line and multi-page plots

Since v3.0 it is possible to plot a sequence over multiple lines (using record.plot_on_multiple_lines()) or even on multiple pages (of a PDF):

graphic_record.plot_on_multiple_pages(
    "multipage_plot.pdf",
    nucl_per_line=70,
    lines_per_page=7,
    plot_sequence=True
)

DNA Features Viewer Logo

Custom Biopython translators

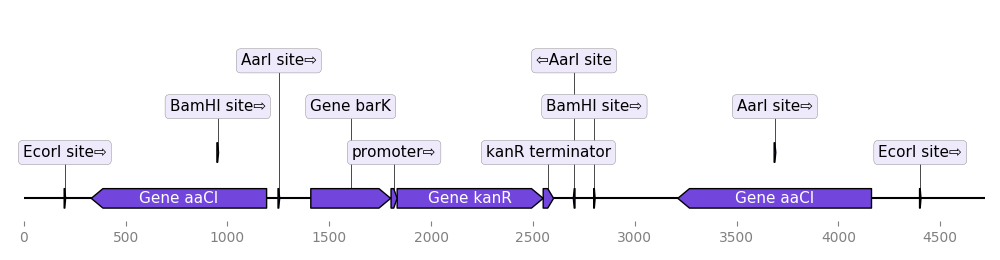
DNA Features Viewer allows to define "themes" by using custom record translators instead of the default BiopythonTranslator. Here is an example:

from dna_features_viewer import BiopythonTranslator

class MyCustomTranslator(BiopythonTranslator):
    """Custom translator implementing the following theme:

    - Color terminators in green, CDS in blue, all other features in gold.
    - Do not display features that are restriction sites unless they are BamHI
    - Do not display labels for restriction sites
    - For CDS labels just write "CDS here" instead of the name of the gene.

    """

    def compute_feature_color(self, feature):
        if feature.type == "CDS":
            return "blue"
        elif feature.type == "terminator":
            return "green"
        else:
            return "gold"

    def compute_feature_label(self, feature):
        if feature.type == 'restriction_site':
            return None
        elif feature.type == "CDS":
            return "CDS here"
        else:
            return BiopythonTranslator.compute_feature_label(self, feature)

    def compute_filtered_features(self, features):
        """Do not display promoters. Just because."""
        return [
            feature for feature in features
            if (feature.type != "restriction_site")
            or ("BamHI" in str(feature.qualifiers.get("label", '')))
        ]


graphic_record = MyCustomTranslator().translate_record("example_sequence.gb")
ax, _ = graphic_record.plot(figure_width=10)
ax.figure.tight_layout()
ax.figure.savefig("custom_bopython_translator.png")

Examples in other packages:

DNA Chisel

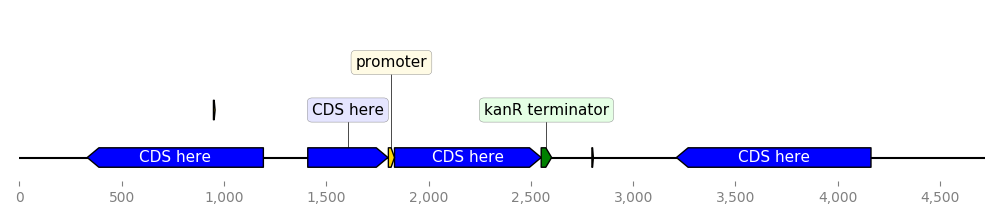
This GIF uses DNA Features Viewer to plot the progress in the optimization of a DNA sequence with DNA Chisel. It also uses Proglog to automatically generate a picture at different time points. See the not-so-great python code for this example on Gist.

DNA Chisel algorithm

GeneBlocks

GeneBlocks is a Python library which computes "diffs" of constructs two sequences, indicating all the changes (additions, deletions, mutations). It uses DNA Features Viewer to display these changesx along with the other sequence's features.

DNA Chisel algorithm

License = MIT

DNA Features Viewer is an open-source software originally written at the Edinburgh Genome Foundry by Zulko and released on Github under the MIT licence. Everyone is welcome to contribute !

More biology software

image

DNA Features Viewer is part of the EGF Codons synthetic biology software suite for DNA design, manufacturing and validation.

dnafeaturesviewer's People

Contributors

jbloom avatar katondr avatar mrtomrod avatar rekhaangara avatar royludo avatar veghp avatar zulko avatar

Stargazers

 avatar  avatar  avatar  avatar  avatar  avatar  avatar  avatar  avatar  avatar  avatar  avatar  avatar  avatar  avatar  avatar  avatar  avatar  avatar  avatar  avatar  avatar  avatar  avatar  avatar  avatar  avatar  avatar  avatar  avatar  avatar  avatar  avatar  avatar  avatar  avatar  avatar  avatar  avatar  avatar  avatar  avatar  avatar  avatar  avatar  avatar  avatar  avatar  avatar  avatar  avatar  avatar  avatar  avatar  avatar  avatar  avatar  avatar  avatar  avatar  avatar  avatar  avatar  avatar  avatar  avatar  avatar  avatar  avatar  avatar  avatar  avatar  avatar  avatar  avatar  avatar  avatar  avatar  avatar  avatar  avatar  avatar  avatar  avatar  avatar  avatar  avatar  avatar  avatar  avatar  avatar  avatar  avatar  avatar  avatar  avatar  avatar  avatar  avatar  avatar

Watchers

 avatar  avatar  avatar  avatar  avatar  avatar  avatar  avatar  avatar  avatar  avatar  avatar  avatar  avatar  avatar  avatar  avatar  avatar  avatar

dnafeaturesviewer's Issues

Plotting specific coordinates from a gff3 file

Suppose I have a gff3 file and I want to plot everything on chr1 positions 1000-2000.
Can you please provide some example code? Should I use the BiopythonTranslator class? How exactly? (maybe there should be an example in the documentation).
Thanks!

Pop-up in bokeh plot

Thanks for the library.
I would like to know if in your code it is possible to generate popup by clicking on the bokeh web plots so that the user can view more information about the plot.

bug in graphic_record.plot with x_lim?

Hi. I'm trying to plot a selected region of features in a SeqRecord over a specific range. I assume this is the purpose of the x_lim argument? However if I supply a range to this as a tuple I still get the features over the entire range shown which seems to distort the x axis range.

Plotting all the features works fine:

graphic_record = BiopythonTranslator().translate_record(rec)
ax, _ = graphic_record.plot(figure_width=16, strand_in_label_threshold=7)

Gives this:

download

But using x_lim:

ax, _ = graphic_record.plot(figure_width=16, strand_in_label_threshold=7, x_lim=(5000,15000))

Produces this plot:

download (1)

gff files

Thanks for writing this in python. I've been looking for a feature viewer for a few weeks. I was wondering how do I read in a gff file to be viewed.

Thanks!

Error when trying example scripts

I am running python 2.7 on macOS. When I want to try the example script, i.e. from_genbank.py, I get the following error:

Traceback (most recent call last): File "with_plot.py", line 11, in <module> ax, levels = graphic_record.plot() File "/Library/Python/2.7/site-packages/dna_features_viewer/dna_features_viewer.py", line 234, in plot box_linewidth=box_linewidth, box_color=box_color File "/Library/Python/2.7/site-packages/dna_features_viewer/dna_features_viewer.py", line 207, in annotate_feature x1, y1, x2, y2 = get_text_box(text, margin=margin) File "/Library/Python/2.7/site-packages/dna_features_viewer/utils.py", line 39, in get_text_box renderer = text.axes.figure.canvas.get_renderer() AttributeError: 'FigureCanvasMac' object has no attribute 'get_renderer' Tobiass-Air:examples Tobias$ python from_genbank.py Traceback (most recent call last): File "from_genbank.py", line 3, in <module> graphic_record = BiopythonTranslator().translate_record("example_sequence.gb") File "/Library/Python/2.7/site-packages/dna_features_viewer/dna_features_viewer.py", line 468, in translate_record return grecord_class(sequence_length=len(record.seq), features=[ AttributeError: 'str' object has no attribute 'seq'

The other example scripts do not work either.

Installation from conda

Change shape of feature arrows

Hello, thank you for making a great package.
Is there a way to change the shape of the feature arrows to a rectangle?
I tried pre-processing the records to change the sigil to BOX before passing to the translator but it doesn't seem to work.

e.g.:

for feature in seqrecord.features:
        #change sigil to box
        feature.qualifiers["sigil"] = 'BOX'

Many thanks,
Sam

support for interactive plot?

Hello!

Great tool! I want to integrate it into a dash application. Is it easy to convert the static plot into an interactive plot, like using plotly?

Thanks,
Yichao

Margin too small

When visualising contigs with long feature names, the margin is too small so that the label gets cropped (see left of 0). When outputting a svg I can modify that in Illustrator, but is tedious for many files. Can it be adjusted?
10919c00007

Truncated labels

Hi There,

I have recently come across this and must say that found this tool really useful! Thanks for developing it.
I have one small problem with feature display with long labels. Here is what I end up with, not sure what's causing it.

Screenshot 2020-09-25 at 16 06 38

Can you please help to figure out how to fix it?

Big coordinates not handled

Hi,

I'm testing out your tool to see if it's suited to my needs e.g. visualize primers in a pretty way.

from dna_features_viewer import GraphicFeature, GraphicRecord
import matplotlib.pyplot as plt

sequence = "TCAAGCTTGCCATCTCTTCATGTTAGGAAACAAAAAGCCCTAGAAGCAGAATTAGATGCTCAGCACTTATCAGAAACTTT"

record = GraphicRecord(sequence=sequence, features=[
    GraphicFeature(start=112173530, end=112173530+20, strand=+1, color="#ffd700",
                   label="Primer1"),
    GraphicFeature(start=112173530+50, end=112173530+70, strand=-1, color="#cffccc",
                   label="Primer2"),
])
zoom_start1, zoom_end1 = 112173530, 112173530+30  # coordinates of the "detail"
zoom_start2, zoom_end2 = 112173530+40, 112173530+80
cropped_record1 = record.crop((zoom_start1, zoom_end1))
cropped_record2 = record.crop((zoom_start2, zoom_end2))

fig, (ax1, ax2, ax3) = plt.subplots(1, 3, figsize=(14, 3))

# PLOT THE WHOLE SEQUENCE

ax1.set_title("Whole sequence", loc='left', weight='bold')
record.plot(ax=ax1)
ax1.fill_between((zoom_start1, zoom_end1), +80, -80, alpha=0.15)
ax1.fill_between((zoom_start2, zoom_end2), +80, -80, alpha=0.15)

# PLOT THE SEQUENCE DETAILS

cropped_record1.plot(ax=ax2)
cropped_record1.plot_sequence(ax=ax2)
ax2.set_title("Sequence detail", loc='left')

#

cropped_record2.plot(ax=ax3)
cropped_record2.plot_sequence(ax=ax3)
ax3.set_title("Sequence detail", loc='left')

fig.savefig('overview_and_detail.png')

I copied some of your code and replaced some values to suit a real life situation and the program returns ValueError: out-of-bound cropping.
Can the tool not handle big coordinates?

FigureCanvasQTCairo

Hi,

Thank you for creating this useful resource.

I'm trying to run the example shown in "Reading the features from a GenBank or GFF file", using the code below:

from dna_features_viewer import BiopythonTranslator

annotation = BiopythonTranslator().translate_record("example.gb")
ax, _ = annotation.plot(figure_width=10, strand_in_label_threshold=7)

... but I'm getting this error. Could you point me to a solution? I couldn't find it among the existing 'Issues'. Thank you

    ax, _ = annotation.plot(figure_width=10, strand_in_label_threshold=7)
  File "/anaconda3/lib/python3.7/site-packages/dna_features_viewer/GraphicRecord/MatplotlibPlottableMixin.py", line 445, in plot
    renderer = ax.figure.canvas.get_renderer()
AttributeError: 'FigureCanvasQTCairo' object has no attribute 'get_renderer'

To bold the base

Hi,

How to bold or increase the text size for the sequence position number
graphic_record_defined_by_hand

Thanks!

ImportError: No module named resources

I am having troubles running the following script:

from dna_features_viewer import BiopythonTranslator
from bokeh.resources import CDN
from bokeh.embed import file_html

record = BiopythonTranslator().translate_record(record="temp8")
plot = record.plot_with_bokeh(figure_width=8)

with open("plot_with_bokeh.html", "w+") as f:
    f.write(file_html(plot, CDN, "Example Sequence"))

I am getting the following error:

Traceback (most recent call last):
  File "bokeh2.py", line 2, in <module>
    from bokeh.resources import CDN
  File "/Users/Tobias/ucloud/Projects/19_DNAfeatureViewer/bokeh_works/good_note3/bokeh.py", line 2, in <module>
    from bokeh.resources import CDN
ImportError: No module named resources

the modules bokeh + pandas has been correctly installed, as the example scripts you provided run without error.

GFF plot doesnt work

Hello DnaFeaturesViewer developers,

I can't plot my gff (attached, had to change extension to txt ATCC_13124.gff.txt). There is supposed to be 2997 features, but only 1 record was produced from GFF.parse().

Some plots have labels hidden

Hello!

I noticed that some plots have their labels hidden. The label only appears when the mouse cursor is placed over the plot.

Screenshot from 2020-01-18 16-27-19

Plotting a region reversed

It would be nice to be able to plot a genomic region in reverse.
I'm writing a script that allows me to compare the loci around the same genes in different species. Sometimes, the locus of interest is on the leading and sometimes on the lagging strand. I'd like to correct for this by discerning the orientation of the gene of interest and then to plot the region in reverse order if necessary.

Example:
Regular plot:

ax, _ = graphic_record.plot(figure_width=12)

test_custom_colors

Reversed plot:

graphic_record.reverse()  # new hypothetical function
ax, _ = graphic_record.plot(figure_width=12)

test_custom_colors_reverse

I'd be very happy if you could implement this.

`ValueError` from the `matplotlib` backend

I'm just trying to plot 3 genes but I'm getting a ValueError from the matplotlib backend

features = [
]
data = df_gff3.iloc[loc_target]
start = int(data["pos_start"])
end = int(data["pos_end"])
print(end - start)
features.append(GraphicFeature(start=start, end=end, strand={"+":+1, "-":-1}[data["sense"]], color="teal", label=data["locus_tag"]))
record = GraphicRecord(sequence_length=end - start, features=features)
record.plot(figure_width=100)


# ---------------------------------------------------------------------------
# ValueError                                Traceback (most recent call last)
# ~/anaconda/envs/µ_env/lib/python3.6/site-packages/IPython/core/formatters.py in __call__(self, obj)
#     339                 pass
#     340             else:
# --> 341                 return printer(obj)
#     342             # Finally look for special method names
#     343             method = get_real_method(obj, self.print_method)

# ~/anaconda/envs/µ_env/lib/python3.6/site-packages/IPython/core/pylabtools.py in <lambda>(fig)
#     242 
#     243     if 'png' in formats:
# --> 244         png_formatter.for_type(Figure, lambda fig: print_figure(fig, 'png', **kwargs))
#     245     if 'retina' in formats or 'png2x' in formats:
#     246         png_formatter.for_type(Figure, lambda fig: retina_figure(fig, **kwargs))

# ~/anaconda/envs/µ_env/lib/python3.6/site-packages/IPython/core/pylabtools.py in print_figure(fig, fmt, bbox_inches, **kwargs)
#     126 
#     127     bytes_io = BytesIO()
# --> 128     fig.canvas.print_figure(bytes_io, **kw)
#     129     data = bytes_io.getvalue()
#     130     if fmt == 'svg':

# ~/anaconda/envs/µ_env/lib/python3.6/site-packages/matplotlib/backend_bases.py in print_figure(self, filename, dpi, facecolor, edgecolor, orientation, format, bbox_inches, **kwargs)
#    2073                     orientation=orientation,
#    2074                     bbox_inches_restore=_bbox_inches_restore,
# -> 2075                     **kwargs)
#    2076             finally:
#    2077                 if bbox_inches and restore_bbox:

# ~/anaconda/envs/µ_env/lib/python3.6/site-packages/matplotlib/backends/backend_agg.py in print_png(self, filename_or_obj, *args, **kwargs)
#     508 
#     509         """
# --> 510         FigureCanvasAgg.draw(self)
#     511         renderer = self.get_renderer()
#     512 

# ~/anaconda/envs/µ_env/lib/python3.6/site-packages/matplotlib/backends/backend_agg.py in draw(self)
#     394         Draw the figure using the renderer.
#     395         """
# --> 396         self.renderer = self.get_renderer(cleared=True)
#     397         # acquire a lock on the shared font cache
#     398         RendererAgg.lock.acquire()

# ~/anaconda/envs/µ_env/lib/python3.6/site-packages/matplotlib/backends/backend_agg.py in get_renderer(self, cleared)
#     415 
#     416         if need_new_renderer:
# --> 417             self.renderer = RendererAgg(w, h, self.figure.dpi)
#     418             self._lastKey = key
#     419         elif cleared:

# ~/anaconda/envs/µ_env/lib/python3.6/site-packages/matplotlib/backends/backend_agg.py in __init__(self, width, height, dpi)
#      85         self.width = width
#      86         self.height = height
# ---> 87         self._renderer = _RendererAgg(int(width), int(height), dpi)
#      88         self._filter_renderers = []
#      89 

# ValueError: Image size of 427363x153 pixels is too large. It must be less than 2^16 in each direction.
# <Figure size 7200x158.4 with 1 Axes>

How to embed.

Hi,
Cool lib. I wanted to use it in a webpage app using flask.
However I'm a bit unsure how to embed this?

i've tried this:

graphic_record = BiopythonTranslator().translate_record(os.path.join(project.path, plasmid.path))
            plot = graphic_record.plot(figure_width = 5)
            output = io.BytesIO()
            FigureCanvas(plot).print_png(output)
            return Response(output.getvalue(), mimetype='image/png')

but errors out:

Traceback (most recent call last):
  File "/usr/local/lib/python3.7/dist-packages/flask/app.py", line 2309, in __call__
    return self.wsgi_app(environ, start_response)
  File "/usr/local/lib/python3.7/dist-packages/flask/app.py", line 2295, in wsgi_app
    response = self.handle_exception(e)
  File "/usr/local/lib/python3.7/dist-packages/flask/app.py", line 1741, in handle_exception
    reraise(exc_type, exc_value, tb)
  File "/usr/local/lib/python3.7/dist-packages/flask/_compat.py", line 35, in reraise
    raise value
  File "/usr/local/lib/python3.7/dist-packages/flask/app.py", line 2292, in wsgi_app
    response = self.full_dispatch_request()
  File "/usr/local/lib/python3.7/dist-packages/flask/app.py", line 1815, in full_dispatch_request
    rv = self.handle_user_exception(e)
  File "/usr/local/lib/python3.7/dist-packages/flask/app.py", line 1718, in handle_user_exception
    reraise(exc_type, exc_value, tb)
  File "/usr/local/lib/python3.7/dist-packages/flask/_compat.py", line 35, in reraise
    raise value
  File "/usr/local/lib/python3.7/dist-packages/flask/app.py", line 1813, in full_dispatch_request
    rv = self.dispatch_request()
  File "/usr/local/lib/python3.7/dist-packages/flask_debugtoolbar/__init__.py", line 125, in dispatch_request
    return view_func(**req.view_args)
  File "/usr/local/lib/python3.7/dist-packages/flask_login/utils.py", line 261, in decorated_view
    return func(*args, **kwargs)
  File "/home/pcoussem/Software/InbioseDevelopment_Python/designstudio/designstudio/user/views_dependencies.py", line 41, in wrap
    return f(*args, **kwargs)
  File "/home/pcoussem/Software/InbioseDevelopment_Python/designstudio/designstudio/user/views_viewer.py", line 32, in viewPlasmids
    FigureCanvas(plot).print_png(output)
  File "/usr/local/lib/python3.7/dist-packages/matplotlib/backend_bases.py", line 1618, in __init__
    figure.set_canvas(self)
AttributeError: 'tuple' object has no attribute 'set_canvas'

any help/pointers what I should check?

Changing feature labels form gbk record

Hi Zulko,

Love the package! Exactly what I've been looking for.

I have a couple of queries about the best way to implement the following things:

Firstly, I'd like to maybe colour each CDS on an individual basis using Matplotlib's colourscales. How would you advise implementing this? I've been using the code below, so I'm thinking I could maybe iterate a list of colours and zip it to the feature list so that each feature is paired with an individual colour? Any better suggestions?

Secondly, is there some way to access additional options for labelling features? In the documented examples, you've shown how to forcibly renaming all the CDS to a specific string ("CDS here"). I'd like to label some/all of my features with the /product tag from a Genbank, as it's more informative than the locus tags. Is there some way to access these in the .features object? I can't see something that looks like it corresponds to this.

More generally, could I put a request in for some more 'fully featured' examples in the documentation that could be deconstructed (if you get the time of course!) ? I'd like to learn how to use the package in much more depth for the future.

Many thanks!

import os, platform, sys
from os.path import expanduser
home = expanduser("~")
import matplotlib
if platform.system() == "Darwin":
    matplotlib.use('TkAgg') # Avoid python framework errors on OSX


__author__ = "Joe R. J. Healey"
__version__ = "1.0.0"
__title__ = "PrettyPlotter"
__license__ = "GPLv3"
__author_email__ = "[email protected]"


from dna_features_viewer import BiopythonTranslator

class MyCustomTranslator(BiopythonTranslator):
    """Custom translator implementing the following theme:

    - Color terminators in green, CDS in blue, all other features in gold.
    - Do not display features that are restriction sites unless they are BamHI
    - Do not display labels for restriction sites
    - For CDS labels just write "CDS here" instead of the name of the gene.

    """

    def compute_feature_color(self, feature):
        if feature.type == "CDS":
            return "blue"
        # maybe zip() together iterated features and a list of colours from a colour scale rather than
        # having all features the same colour?
        elif feature.type == "terminator":
            return "green"
        else:
            return "gold"

    def compute_feature_label(self, feature):
        if feature.type == "CDS":
            return BiopythonTranslator.compute_feature_label(feature.description) # how to get /product description to replace CDS name/locus tag?

    def compute_filtered_features(self, features):
        """Do not display promoters. Just because."""
        return [feature for feature in features if (feature.type != "gene")]


def parse_args():
    """Parse commandline arguments"""
    import argparse

    try:
        parser = argparse.ArgumentParser(
            description='Make pretty images from sequence files (.dna/.gbk/.gff).')
        parser.add_argument(
            'seqfile',
            action='store',
            help='Input sequence file. Supported filetypes are genbank, GFF, and SnapGene\'s .dna')
        parser.add_argument(
            'image',
            action='store',
            default=home,
            help='Output image filename with extension')

        return parser.parse_args()

    except:
        print("An exception occured with argument parsing. Check your provided options.")
        sys.exit(1)


def main():

    args = parse_args()

    if os.path.splitext(args.seqfile)[1] == '.dna':
        print("Input file is a SnapGene DNA file. Calling snapgene_reader to convert to BioPython.")
        from snapgene_reader import snapgene_file_to_seqrecord
        seqrecord = snapgene_file_to_seqrecord(args.infile)
    else:
        pass

    graphic_record = MyCustomTranslator().translate_record(args.seqfile)
    ax, _ = graphic_record.plot(figure_width=10)
    ax.figure.tight_layout()
    ax.figure.savefig(args.image)

if __name__ == '__main__':
    main()

LinAlgError

Hi,
I think DnaFeaturesViewer is a very good tool to plot gene features. But when I try to use it, I get some error massage, I don't know how to solve it.
`In [61]: x = [GraphicFeature(start=20, end=500, strand=+1, color="#ffcccc",
...: label="Gene 1")]

In [62]: record = GraphicRecord(sequence_length=600, features=x)

In [63]: record.plot(fig_width=5)

LinAlgError Traceback (most recent call last)
in ()
----> 1 record.plot(fig_width=5)

/home/hzhao/lib/python2.7/site-packages/dna_features_viewer/dna_features_viewer.pyc in plot(self, ax, fig_width, draw_line, with_ruler)
166 overflowing_annotations = []
167 for feature, level in levels.items():
--> 168 feature.plot(ax=ax, level=level)
169 text, overflowing, (x1, x2) = feature.annotate(ax=ax, level=level)
170 if overflowing:
/home/hzhao/lib/python2.7/site-packages/dna_features_viewer/dna_features_viewer.pyc in plot(self, ax, level)
124 def plot(self, ax, level=0):
125 """Plot the feature's Matplotlib patch on a Matplotlib ax."""
--> 126 ax.add_patch(self.create_patch(level=level))
127
128 def repr(self):

/home/hzhao/lib/python2.7/site-packages/matplotlib/axes/_base.pyc in add_patch(self, p)
1776 if p.get_clip_path() is None:
1777 p.set_clip_path(self.patch)
-> 1778 self._update_patch_limits(p)
1779 self.patches.append(p)
1780 p._remove_method = lambda h: self.patches.remove(h)

/home/hzhao/lib/python2.7/site-packages/matplotlib/axes/_base.pyc in _update_patch_limits(self, patch)
1794 ((not patch.get_width()) and (not patch.get_height()))):
1795 return
-> 1796 vertices = patch.get_path().vertices
1797 if vertices.size > 0:
1798 xys = patch.get_patch_transform().transform(vertices)

/home/hzhao/lib/python2.7/site-packages/matplotlib/patches.pyc in get_path(self)
4181 _path = concatenate_paths(_path)
4182
-> 4183 return self.get_transform().inverted().transform_path(_path)
4184
4185 def get_path_in_displaycoord(self):

/home/hzhao/lib/python2.7/site-packages/matplotlib/transforms.pyc in inverted(self)
2377
2378 def inverted(self):
-> 2379 return CompositeGenericTransform(self._b.inverted(), self._a.inverted())
2380 inverted.doc = Transform.inverted.doc
2381

/home/hzhao/lib/python2.7/site-packages/matplotlib/transforms.pyc in inverted(self)
2377
2378 def inverted(self):
-> 2379 return CompositeGenericTransform(self._b.inverted(), self._a.inverted())
2380 inverted.doc = Transform.inverted.doc
2381
/home/hzhao/lib/python2.7/site-packages/matplotlib/transforms.pyc in inverted(self)
2377
2378 def inverted(self):
-> 2379 return CompositeGenericTransform(self._b.inverted(), self._a.inverted())
2380 inverted.doc = Transform.inverted.doc
2381

/home/hzhao/lib/python2.7/site-packages/matplotlib/transforms.pyc in inverted(self)
1773 if self._shorthand_name:
1774 shorthand_name = '(%s)-1' % self._shorthand_name
-> 1775 self._inverted = Affine2D(inv(mtx), shorthand_name=shorthand_name)
1776 self._invalid = 0
1777 return self._inverted

/home/hzhao/lib/python2.7/site-packages/numpy/linalg/linalg.pyc in inv(a)
524 signature = 'D->D' if isComplexType(t) else 'd->d'
525 extobj = get_linalg_error_extobj(_raise_linalgerror_singular)
--> 526 ainv = _umath_linalg.inv(a, signature=signature, extobj=extobj)
527 return wrap(ainv.astype(result_t, copy=False))
528

/home/hzhao/lib/python2.7/site-packages/numpy/linalg/linalg.pyc in _raise_linalgerror_singular(err, flag)
88
89 def _raise_linalgerror_singular(err, flag):
---> 90 raise LinAlgError("Singular matrix")
91
92 def _raise_linalgerror_nonposdef(err, flag):

LinAlgError: Singular matrix`
Thank you very much.

Bio.Alphabet

Hello,

I can't import BiopythonTranslator from dna_features_viewer

---------------------------------------------------------------------------
ImportError                               Traceback (most recent call last)
<ipython-input-26-8cd547d411a9> in <module>
     10 from matplotlib.patches import Patch
     11 from matplotlib.lines import Line2D
---> 12 from dna_features_viewer import BiopythonTranslator
     13 from Bio import SeqIO, Entrez
     14 from BCBio import GFF

~/Zarul/Software/anaconda3/envs/dna/lib/python3.6/site-packages/dna_features_viewer/__init__.py in <module>
      1 """ dna_features_viewer/__init__.py """
      2 
----> 3 from .GraphicRecord import GraphicRecord
      4 from .CircularGraphicRecord import CircularGraphicRecord
      5 from .GraphicFeature import GraphicFeature

~/Zarul/Software/anaconda3/envs/dna/lib/python3.6/site-packages/dna_features_viewer/GraphicRecord/__init__.py in <module>
----> 1 from .GraphicRecord import GraphicRecord
      2 
      3 __all__ = ['GraphicRecord']

~/Zarul/Software/anaconda3/envs/dna/lib/python3.6/site-packages/dna_features_viewer/GraphicRecord/GraphicRecord.py in <module>
      4 from Bio.SeqRecord import SeqRecord
      5 from Bio.SeqFeature import FeatureLocation, SeqFeature
----> 6 from Bio.Alphabet import DNAAlphabet
      7 
      8 from .MatplotlibPlottableMixin import MatplotlibPlottableMixin

~/Zarul/Software/anaconda3/envs/dna/lib/python3.6/site-packages/Bio/Alphabet/__init__.py in <module>
     19 
     20 raise ImportError(
---> 21     "Bio.Alphabet has been removed from Biopython. In many cases, the alphabet can simply be ignored and removed from scripts. In a few cases, you may need to specify the ``molecule_type`` as an annotation on a SeqRecord for your script to work correctly. Please see https://biopython.org/wiki/Alphabet for more information."
     22 )

ImportError: Bio.Alphabet has been removed from Biopython. In many cases, the alphabet can simply be ignored and removed from scripts. In a few cases, you may need to specify the ``molecule_type`` as an annotation on a SeqRecord for your script to work correctly. Please see https://biopython.org/wiki/Alphabet for more information.

What do I do now?

Genebank to circular view

I would like to plot a Genebank file not in the linear, but in the circular view.
Could you please provide code for that?
Thanks in advance.

Specify bokeh tools

I absolutely love this library, especially bokeh! I have a feature request, though:

It would be great if it were possible to specify the tools of the plot. Currently, I do it like this:

plot = graphic_record.plot_with_bokeh()

# remove hover tool
from bokeh.plotting._tools import process_tools_arg
tool_objs, tool_map = process_tools_arg(plot, "xpan,xwheel_zoom,reset,tap")
plot.tools = tool_objs

How I'd like it to work:

plot = graphic_record.plot_with_bokeh(tools=["xpan,xwheel_zoom,reset,tap"])

PS: In the function plot_with_bokeh of the class BokehPlottableMixin on line 78, you have a silly print statement. :)

plot_with_bokeh ignores strand=0 and still plots arrowhead

Using the GraphicRecord::plot with strand=0 plots a feature without an arrowhead but GraphicRecord::plot_with_bokeh treats strand=0 as the same as strand=+1.

Looks like an easy fix in BokehPlottableMixin::bokeh_feature_patch?

        if strand > 0:
            head_base = max(x1, x2 - delta)
        elif strand < 0:
            head_base = min(x1, x2 + delta)
        else:
            head_base = x2

Zoom in capability?

This is an amazing library - I love how tightly it is integrated with matplotlib.

I've got a genome that I'm trying to perform more in depth analysis (example code is below using the ncov2019 genome)

from dna_features_viewer import BiopythonTranslator
from Bio import SeqIO
import matplotlib.pyplot as plt


fig, (ax1, ax2, ax3, ax4, ax5) = plt.subplots(
    5, 1, figsize=(15, 10), sharex=True, gridspec_kw={"height_ratios": [5, 1, 1, 1, 1]}
)
record = SeqIO.read("sequence.gb", "genbank")
graphic_record = BiopythonTranslator().translate_record(record)
graphic_record.plot(ax=ax1, with_ruler=False, strand_in_label_threshold=4)

gc = lambda s: 100.0 * len([c for c in s if c in "GC"]) / 50
xx = np.arange(len(record.seq) - 50)
yy = [gc(record.seq[x : x + 50]) for x in xx]
ax2.fill_between(xx + 25, yy, alpha=0.3)
ax2.set_ylim(bottom=0)
ax2.set_ylabel("GC(%)")

ax3.plot(filtY[:, 0])
ax3.set_ylabel('(R/Y)')
ax4.plot(filtY[:, 1])
ax4.set_ylabel('(A/G)')
ax5.plot(filtY[:, 2])
ax5.set_ylabel('(C/T)')

So far, I'm able to generate a beautiful genome plot
Screenshot 2020-02-14 12 04 18

But when I try to zoom in with

for ax in [ax1, ax2, ax3, ax4, ax5]:
    ax.set_xlim([24000, 25000])

The plot seems to implode

Screenshot 2020-02-14 12 04 26

Not sure what is going on here (may require a closer look at the internals) - but these sorts of features would be incredibly useful to have ready out-of-the-box for genome wide analysis.

EDIT: the problem seems to be arising due to Jupyter. When I save these plots to a file, it seems to be ok

image

Although, this is still problematic - if I zoom in to a 50bp region, I get

---------------------------------------------------------------------------
ValueError                                Traceback (most recent call last)
~/miniconda3/envs/gert/lib/python3.7/site-packages/IPython/core/formatters.py in __call__(self, obj)
    339                 pass
    340             else:
--> 341                 return printer(obj)
    342             # Finally look for special method names
    343             method = get_real_method(obj, self.print_method)

~/miniconda3/envs/gert/lib/python3.7/site-packages/IPython/core/pylabtools.py in <lambda>(fig)
    242 
    243     if 'png' in formats:
--> 244         png_formatter.for_type(Figure, lambda fig: print_figure(fig, 'png', **kwargs))
    245     if 'retina' in formats or 'png2x' in formats:
    246         png_formatter.for_type(Figure, lambda fig: retina_figure(fig, **kwargs))

~/miniconda3/envs/gert/lib/python3.7/site-packages/IPython/core/pylabtools.py in print_figure(fig, fmt, bbox_inches, **kwargs)
    126 
    127     bytes_io = BytesIO()
--> 128     fig.canvas.print_figure(bytes_io, **kw)
    129     data = bytes_io.getvalue()
    130     if fmt == 'svg':

~/miniconda3/envs/gert/lib/python3.7/site-packages/matplotlib/backend_bases.py in print_figure(self, filename, dpi, facecolor, edgecolor, orientation, format, bbox_inches, **kwargs)
   2087                     orientation=orientation,
   2088                     bbox_inches_restore=_bbox_inches_restore,
-> 2089                     **kwargs)
   2090             finally:
   2091                 if bbox_inches and restore_bbox:

~/miniconda3/envs/gert/lib/python3.7/site-packages/matplotlib/backends/backend_agg.py in print_png(self, filename_or_obj, metadata, pil_kwargs, *args, **kwargs)
    525 
    526         else:
--> 527             FigureCanvasAgg.draw(self)
    528             renderer = self.get_renderer()
    529             with cbook._setattr_cm(renderer, dpi=self.figure.dpi), \

~/miniconda3/envs/gert/lib/python3.7/site-packages/matplotlib/backends/backend_agg.py in draw(self)
    384         Draw the figure using the renderer.
    385         """
--> 386         self.renderer = self.get_renderer(cleared=True)
    387         with RendererAgg.lock:
    388             self.figure.draw(self.renderer)

~/miniconda3/envs/gert/lib/python3.7/site-packages/matplotlib/backends/backend_agg.py in get_renderer(self, cleared)
    397                           and getattr(self, "_lastKey", None) == key)
    398         if not reuse_renderer:
--> 399             self.renderer = RendererAgg(w, h, self.figure.dpi)
    400             self._lastKey = key
    401         elif cleared:

~/miniconda3/envs/gert/lib/python3.7/site-packages/matplotlib/backends/backend_agg.py in __init__(self, width, height, dpi)
     84         self.width = width
     85         self.height = height
---> 86         self._renderer = _RendererAgg(int(width), int(height), dpi)
     87         self._filter_renderers = []
     88 

ValueError: Image size of 248267x575 pixels is too large. It must be less than 2^16 in each direction.

<Figure size 1080x720 with 4 Axes>

Visualize contig genbank file

Hey there, I am really astonished how easy it is with your script to visualize genes, but unfortunately I am working a lot with genome drafts, so unclosed genomes with many contigs in one genbank file. Is there a way to parse more than one and not getting the error ValueError: More than one record found in handle
Cheers

Hard-coded font size in plot_sequence

The GraphicRecord:plot_sequence function accepts a fontdict argument of which the size attribute is hard-coded. Calling the function with graphic_record.plot_sequence(ax=ax, fontdict={'size':6}) fails. Expected behavior would be to have a default font size that can be changed by fontdict argument.

How to use `plot_on_multiple_pages` with `ax` attribute ?

Dear
I would like to add multiple subplot in order to display annotation from genbank and sample feature from external input.
Each sample have a subplot in order to set accordingly a title
which a simplified version give:

a4_landscape = (11.69, 8.27)
fig = Figure(figsize=a4_landscape, dpi=300)
gs = GridSpec(no_sample+1, 1)
canvas = FigureCanvasAgg(fig)
axe1 = fig.add_subplot(gs[0])
_ = graphic_annotation.plot_on_multiple_pages(output, nucl_per_line=5000, n_lines=6, plot_sequence=False, ax=axe1, with_ruler=False, strand_in_label_threshold=4)
for sample_name, seq_features in features_variations.items():
    graphic_annotation = AnnotationTranslator().translate_record(annotation)
    variations_record = GraphicRecord(sequence_length=graphic_annotation.sequence_length,
                                          features=graphic_variations,
                                          plots_indexing='genbank')
        axe = fig.add_subplot(gs[1], sharex=axe1, label=sample_name)
        axe.set_title(sample_name)
        with_ruler = sample_number == no_sample  # ruler only on the latest axe
        _ = variations_record.plot(ax=axe, with_ruler=with_ruler, strand_in_label_threshold=4)
    fig.tight_layout()

but that do not work as ax would be define twice one time by my script and another time by the library which give this stacktrace:

  File "…/lib/python3.7/site-packages/fr/cea/cnrgh/variant/variation_viewer/__main__.py", line 183, in create_figure
    _ = graphic_annotation.plot_on_multiple_pages(output, nucl_per_line=5000, n_lines=6, plot_sequence=False, ax=axe1, with_ruler=False, strand_in_label_threshold=4)
  File "…/lib/python3.7/site-packages/dna_features_viewer/GraphicRecord/MultilinePlottableMixin.py", line 150, in plot_on_multiple_pages
    **plot_params
  File "…/lib/python3.7/site-packages/dna_features_viewer/GraphicRecord/MultilinePlottableMixin.py", line 78, in plot_on_multiple_lines
    line_ax = plot_line(line_index)
  File "…/lib/python3.7/site-packages/dna_features_viewer/GraphicRecord/MultilinePlottableMixin.py", line 73, in plot_line
    **plot_params

Circular DNA feature wrap issue

image

Hello, I have found that when I try to render a circular graphic record that has a feature that spans the "origin", it is instead incorrectly rendered as looping around the entire DNA segment. I see that this does not happen in your bioRxiv preprint, so maybe I am missing something obvious?

This is the raw text from the .gbk for the incorrect feature in question in the picture above:

enhancer        join(7368..7381,1..366)
                     /label="CMV enhancer (2)"
                     /identity="100.0"
                     /match length="100.0"
                     /Other:="enhancer"

Zoom in the locally_highlighted_record result

I upload the whole genome, and the result of the locally_highlighted_record is too small to recognize. Is any method can improve this problem?
I already set the parameter "figure_width=650".

no encoding declared in GraphicRecord.py

>>import dna_features_viewer

  File "~/libs/anaconda2/envs/py3/lib/python3.7/site-packages/dna_features_viewer/GraphicRecord/GraphicRecord.py", line 206
    label = label[: max_label_length - 1] + "…"
                                               ^
SyntaxError: Non-ASCII character '\xe2' in file ~libs/anaconda2/envs/py3/lib/python3.7/site-packages/dna_features_viewer/GraphicRecord/GraphicRecord.py on line 206, but no encoding declared; see http://python.org/dev/peps/pep-0263/ for details

edge colouring

Very nice package and works also very smooth with larger datasets but the genes since they are so small are becoming a single line.
To visualise different categories I would like to apply colouring to them. However is it also possible to colour the edges? Since the only thing I can see are the edges since they are so small and all turn into a black line instead of any other colour.

plot_with_bokeh gives BAD_COLUMN_NAME errors and uses default font when using bokeh 2.3.0

When using plot_with_bokeh the labels are plotted with the default font instead of Arial, and errors are printed:

ERROR:bokeh.core.validation.check:E-1001 (BAD_COLUMN_NAME): Glyph refers to nonexistent column name. This could either be due to a misspelling or typo, or due to an expected column being missing. : key "text_font" value "arial" [renderer: GlyphRenderer(id='1037', ...)]

This happens when using bokeh 2.3.0 but not earlier versions. The problem is that the most recent bokeh has changed how the text_font value is interpreted (see bokeh/bokeh#11044) and in the plot_with_bokeh function the plot.text call needs to use text_font=value("arial") instead of text_font="arial".

How to display differences from Variant Calling File?

Dear,

I would like to use your awesome library with pysam in order to display the difference between two sequences.
I see they are GeneBlock for this purpose. So how to create a such instance from a list of variations ?

Thanks

best regards

CroppingGraphicRecord.crop: ValueError at boundary condition

Hi!

I really enjoy your DnaFeaturesViewer!

I discovered a bug when cropping at the end of a graphic_record:

The graphic_record.span is (0, 391390)

I want to crop it as follows: graphic_record.crop((388247, 391390))

But this gets me a ValueError:

  File "project/gene_loci_comparison/gene_loci_comparison.py", line 71, in create_graphic_record
    graphic_record = graphic_record.crop(crop)
  File "venv/gene_loci_comparison/lib64/python3.7/site-packages/dna_features_viewer/GraphicRecord/GraphicRecord.py", line 116, in crop
    raise ValueError("out-of-bound cropping")
ValueError: out-of-bound cropping

If I crop graphic_record.crop((388247, 391390 - 1)), it works, but I loose a base at the end.

Thanks for this beautiful piece of software! :)

Overlaping arrows

Great tool!

The only thing I couldn't figure is if you want all your gene arrows on the same line with overlapping arrows.
I didn't find any option that would allow me to do so. Is there any? If yes would it draw the tip of the arrow on top the next gene arrow or on the bottom?

Thank you

Vertical Plot

Hi, I'm wondering if it's possible to make vertically oriented plots using this library? Specifically, I am trying to do something like in this example except having the plot oriented vertically for a figure.

plot_with_bokeh does not work with features without labels

Small example:

from bokeh.resources import CDN
from bokeh.embed import file_html
from dna_features_viewer import GraphicFeature, GraphicRecord

features_label = [GraphicFeature(start=1, end=11, strand=1, color='green', label='some label')]
features_no_label =  [GraphicFeature(start=1, end=11, strand=1, color='green')]

record_label = GraphicRecord(sequence_length=15, features=features_label, first_index = 0)
record_no_label = GraphicRecord(sequence_length=15, features=features_no_label, first_index = 0)

plot_label = record_label.plot_with_bokeh(figure_width=8)
plot_no_label = record_no_label.plot_with_bokeh(figure_width=8)

Error:
File "test.py", line 12, in
plot_no_label = record_no_label.plot_with_bokeh(figure_width=8)
File "C:\Users\user\Desktop\venv\lib\site-packages\dna_features_viewer\GraphicRecord.py", line 428, in plot_with_bokeh
max_y = max([data["annotation_y"] for f, data in plot_data.items()])
ValueError: max() arg is an empty sequence

Which, after some trial and error seems to originate in line 213 in GraphicRecord.py

 if feature.label is not None:

I'm not sure if this is part of the design, or a bug. But in either case, I't be nice to have a 'you need labels' error message so you know what to change instead of just trying by trial and error.

Apart from that, great package!

Circular plasmid text annotation issues

image

This is a very useful library, thank you for developing it! I am interested in using DnaFeaturesViewer for visualizing plasmids, so I am exclusively using the circular graphic record. I have found that when a plasmid has even a modest amount of annotations, they quickly stack and become illegible. Would it be possible to have alternative layouts for these annotations? Maybe split the annotations into quadrants (top, left, bottom, right) or allow them to be placed inline onto the graphic itself?

Also, support for for Bokeh in circular visualization mode would be amazing! Currently, it just defaults to a linear picture, even while using a circular graphic record.

Thank you again!

Broken Axis

Hey, first of all I want to thank you for the very nice package.
I have a question or maybe an extension to your package.

I am visualizing the exon/intron structure of a gene. Actually, the introns are very big compared to the exons and therefore there is a lot of free space between the interesting exon parts. Is there a way to rescale the parts where no GraphicFeature is defined.

I attached a file where one can see that the colored parts (exons) are very small and there is a lot of space between them. I wanted to ask if there is a way to reduce the white space between the exons.

Kind regards,
Lisi

bildschirmfoto_2021-04-26_um_10 48 59

Feature Annotations Below Track

Hi, is it possible to have feature annotations appear below a plot? I have a figure like this, with a genome track underneath another plot for visualization, and I would like the text boxes to go below the track if possible:

image

Recommend Projects

  • React photo React

    A declarative, efficient, and flexible JavaScript library for building user interfaces.

  • Vue.js photo Vue.js

    🖖 Vue.js is a progressive, incrementally-adoptable JavaScript framework for building UI on the web.

  • Typescript photo Typescript

    TypeScript is a superset of JavaScript that compiles to clean JavaScript output.

  • TensorFlow photo TensorFlow

    An Open Source Machine Learning Framework for Everyone

  • Django photo Django

    The Web framework for perfectionists with deadlines.

  • D3 photo D3

    Bring data to life with SVG, Canvas and HTML. 📊📈🎉

Recommend Topics

  • javascript

    JavaScript (JS) is a lightweight interpreted programming language with first-class functions.

  • web

    Some thing interesting about web. New door for the world.

  • server

    A server is a program made to process requests and deliver data to clients.

  • Machine learning

    Machine learning is a way of modeling and interpreting data that allows a piece of software to respond intelligently.

  • Game

    Some thing interesting about game, make everyone happy.

Recommend Org

  • Facebook photo Facebook

    We are working to build community through open source technology. NB: members must have two-factor auth.

  • Microsoft photo Microsoft

    Open source projects and samples from Microsoft.

  • Google photo Google

    Google ❤️ Open Source for everyone.

  • D3 photo D3

    Data-Driven Documents codes.