Coder Social home page Coder Social logo

broadinstitute / tangram Goto Github PK

View Code? Open in Web Editor NEW
221.0 12.0 45.0 143.91 MB

Spatial alignment of single cell transcriptomic data.

License: BSD 3-Clause "New" or "Revised" License

Jupyter Notebook 99.13% Python 0.87%
spatial-data visium gene-expression scrna-seq snrna-seq computational-biology

tangram's Introduction

PyPI version

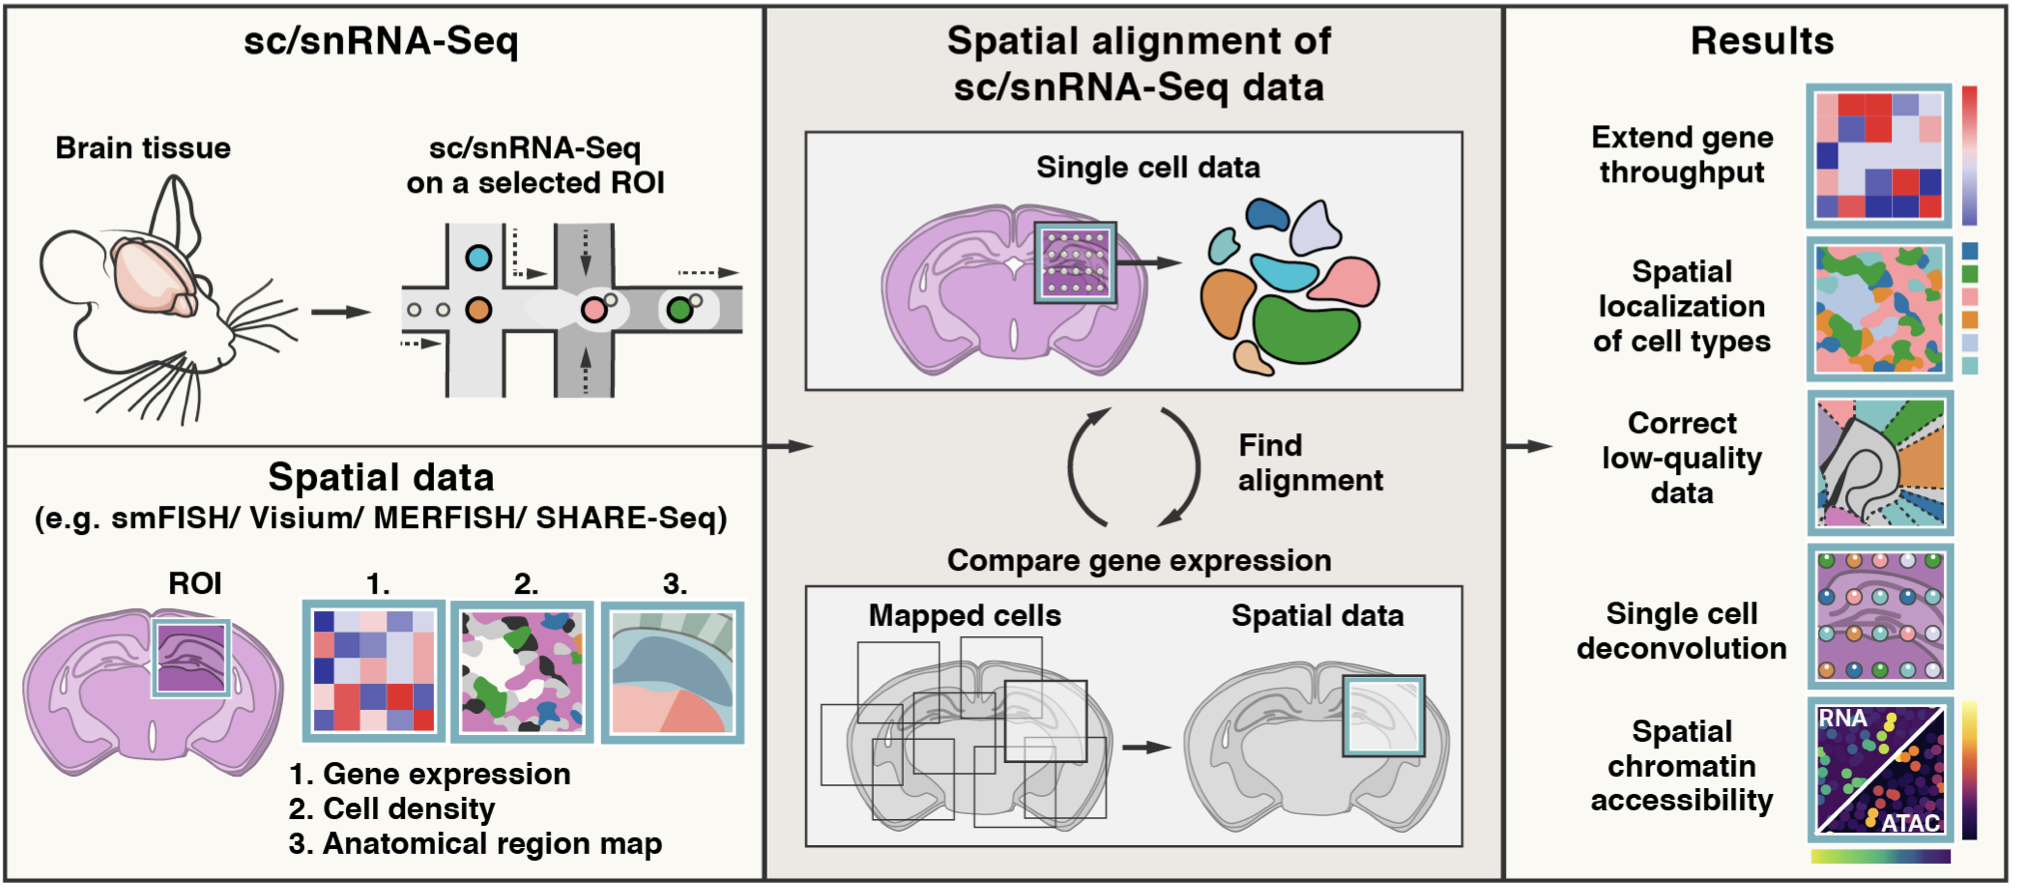
Tangram is a Python package, written in PyTorch and based on scanpy, for mapping single-cell (or single-nucleus) gene expression data onto spatial gene expression data. The single-cell dataset and the spatial dataset should be collected from the same anatomical region/tissue type, ideally from a biological replicate, and need to share a set of genes. Tangram aligns the single-cell data in space by fitting gene expression on the shared genes. The best way to familiarize yourself with Tangram is to check out our tutorial and our documentation. colab tutorial
If you don't use squidpy yet, check out our previous tutorial.

Tangram_overview


How to install Tangram

To install Tangram, make sure you have PyTorch and scanpy installed. If you need more details on the dependences, look at the environment.yml file.

  • set up conda environment for Tangram
    conda env create -f environment.yml
  • install tangram-sc from shell:
    conda activate tangram-env
    pip install tangram-sc
  • To start using Tangram, import tangram in your jupyter notebooks or/and scripts
    import tangram as tg

Two ways to run Tangram

How to run Tangram at cell level

Load your spatial data and your single cell data (which should be in AnnData format), and pre-process them using tg.pp_adatas:

    ad_sp = sc.read_h5ad(path)
    ad_sc = sc.read_h5ad(path)
    tg.pp_adatas(ad_sc, ad_sp, genes=None)

The function pp_adatas finds the common genes between adata_sc, adata_sp, and saves them in two adatas.uns for mapping and analysis later. Also, it subsets the intersected genes to a set of training genes passed by genes. If genes=None, Tangram maps using all genes shared by the two datasets. Once the datasets are pre-processed we can map:

    ad_map = tg.map_cells_to_space(ad_sc, ad_sp)

The returned AnnData,ad_map, is a cell-by-voxel structure where ad_map.X[i, j] gives the probability for cell i to be in voxel j. This structure can be used to project gene expression from the single cell data to space, which is achieved via tg.project_genes.

    ad_ge = tg.project_genes(ad_map, ad_sc)

The returned ad_ge is a voxel-by-gene AnnData, similar to spatial data ad_sp, but where gene expression has been projected from the single cells. This allows to extend gene throughput, or correct for dropouts, if the single cells have higher quality (or more genes) than spatial data. It can also be used to transfer cell types onto space.


How to run Tangram at cluster level

To enable faster training and consume less memory, Tangram mapping can be done at cell cluster level. This modification was introduced by Sten Linnarsson.

Prepare the input data as the same you would do for cell level Tangram mapping. Then map using following code:

    ad_map = tg.map_cells_to_space(
                   ad_sc, 
                   ad_sp,         
                   mode='clusters',
                   cluster_label='subclass_label')

Provided cluster_label must belong to ad_sc.obs. Above example code is to map at 'subclass_label' level, and the 'subclass_label' is in ad_sc.obs.

To project gene expression to space, use tg.project_genes and be sure to set the cluster_label argument to the same cluster label in mapping.

    ad_ge = tg.project_genes(
                  ad_map, 
                  ad_sc,
                  cluster_label='subclass_label')

How Tangram works under the hood

Tangram instantiates a Mapper object passing the following arguments:

  • S: single cell matrix with shape cell-by-gene. Note that genes is the number of training genes.
  • G: spatial data matrix with shape voxels-by-genes. Voxel can contain multiple cells.

Then, Tangram searches for a mapping matrix M, with shape voxels-by-cells, where the element M_ij signifies the probability of cell i of being in spot j. Tangram computes the matrix M by maximizing the following:

where cos_sim is the cosine similarity. The meaning of the loss function is that gene expression of the mapped single cells should be as similar as possible to the spatial data G, under the cosine similarity sense.

The above accounts for basic Tangram usage. In our manuscript, we modified the loss function in several ways so as to add various kinds of prior knowledge, such as number of cell contained in each voxels.


Frequently Asked Questions

Do I need a GPU for running Tangram?

Mapping with cluster mode is fine on a standard laptop. For mapping at single cell level, GPU is not required but is recommended. We run most of our mappings on a single P100 which maps ~50k cells in a few minutes.

How do I choose a list of training genes?

A good way to start is to use the top 1k unique marker genes, stratified across cell types, as training genes. Alternatively, you can map using the whole transcriptome. Ideally, training genes should contain high quality signals: if most training genes are rich in dropouts or obtained with bad RNA probes your mapping will not be accurate.

Do I need cell segmentation for mapping on Visium data?

You do not need to segment cells in your histology for mapping on spatial transcriptomics data (including Visium and Slide-seq). You need, however, cell segmentation if you wish to deconvolve the data (ie deterministically assign a single cell profile to each cell within a spatial voxel).

I run out of memory when I map: what should I do?

Reduce your spatial data in various parts and map each single part. If that is not sufficient, you will need to downsample your single cell data as well.


How to cite Tangram

Tangram has been released in the following publication

Biancalani* T., Scalia* G. et al. - Deep learning and alignment of spatially-resolved whole transcriptomes of single cells in the mouse brain with Tangram Nature Methods 18, 1352–1362 (2021)

If you have questions, please contact the authors of the method:

PyPI maintainer:

The artwork has been curated by:

tangram's People

Contributors

gaddamshreya1 avatar gscalia avatar hejin0701 avatar hejinhuang avatar lewlin avatar ziqlu0722 avatar

Stargazers

 avatar  avatar  avatar  avatar  avatar  avatar  avatar  avatar  avatar  avatar  avatar  avatar  avatar  avatar  avatar  avatar  avatar  avatar  avatar  avatar  avatar  avatar  avatar  avatar  avatar  avatar  avatar  avatar  avatar  avatar  avatar  avatar  avatar  avatar  avatar  avatar  avatar  avatar  avatar  avatar  avatar  avatar  avatar  avatar  avatar  avatar  avatar  avatar  avatar  avatar  avatar  avatar  avatar  avatar  avatar  avatar  avatar  avatar  avatar  avatar  avatar  avatar  avatar  avatar  avatar  avatar  avatar  avatar  avatar  avatar  avatar  avatar  avatar  avatar  avatar  avatar  avatar  avatar  avatar  avatar  avatar  avatar  avatar  avatar  avatar  avatar  avatar  avatar  avatar  avatar  avatar  avatar  avatar  avatar  avatar  avatar  avatar  avatar  avatar  avatar

Watchers

 avatar  avatar  avatar  avatar  avatar  avatar  avatar  avatar  avatar  avatar  avatar  avatar

tangram's Issues

question about save figures to pdf

Your idea is very interesting. And thanks to your useful tutorial link, I've got my result by processing my scRNA-seq data. But cause I use R in my daily work , I'm unfamiliar about how to save the image to PDF after tg.plot_cell_annotation_sc. Hope you could give me a hand.

Thanks a lot!

conda package conflict

Hello,

I have cloned the repo and am running:

conda env create -f environment.yml

But I get this error:
error

Not sure what to do besides install things one at a time.

To harmonize scRNA-Seq reference to align spatial data

Hi,

I am using Tangram to align scRNA-Seq reference onto spatial data. My scRNA-Seq reference is a collection of samples from different datasets. As a result, the raw gene expression of the scRNA-Seq reference showed a batch effect due to sample sources. May I ask if you have any suggestions to harmonize the batch effect when aligning to spatial data? Thanks.

SC data assumptions -- raw counts

My understanding is that the assumption behind Tangram is that the same biological processes generated both the SC data and the ST data, and that ideally both data sets will come from the same sample.

Is Tangram expecting raw counts for the SC data? Or will it still work if the count data is normalized in some way?

More generally, how well can we expect Tangram to work if the SC reference data is from other, biologically similar samples? Or even a composite SC reference built by integrating multiple samples? In this last case we would normally do SCT Transform / Harmony to integrate samples, which is a kind of normalization ...

I guess we can always try it and see, but interested in your thoughts.

Thanks :)

where to get Allen1_cell_count.h5ad dataset

Dear Tommaso,

I want to run the mapping-visium-example.ipynb notebook. Currently I could not find where to get the Allen1_cell_count.h5ad dataset. Could you please tell me how to get the dataset?

Thanks!

Interpreting project_genes

Hi, Thank you for all your help in the running tangram!

For interpreting the project_genes results, I noticed that it returns a "spot-by-gene AnnData containing spatial gene expression from the single cell data." I am confused on how each spot has one measurement per gene, because I thought that the goal of deconvolution was to get to single cell resolution (which would be multiple cells per spot). If there were two cells in one spot and one cell had very high expression of a marker gene and the other cell had very low expression of the same gene, would the project_genes return a "medium" expression of that particular gene?

I did look at the figure from plot_genes_sc and noticed that there is a difference in the predicted vs measured, but am confused on what difference I am looking for and exactly what that represents. One of the figures is below.

Finally, I would like to use the single cell resolution to do some neighborhood analysis -- looking at which individual genes have spatial patterns, any pairs / groups of genes that have spatial patterns together, and then repeat with cell type / cluster (which cells have spatial patterns, any pairs / groups of cells that have spatial patterns together). I was looking through the squidpy tutorial and noticed that there was not any deconvolution in the pipeline. How would you recommend approaching this?

image

questions on voxels and cropping spatial data

Hi,

thank you for this very cool method! very interesting paper, am finally getting around and trying out the method on Visium data.

have a couple of questions with respect to data cropping and spatial data shape

spatial data matrix with shape voxels-by-genes. Voxel can contain multiple cells.

what exactly is a voxel in the case of Visium?
the way I understand is that the maximum voxel is a spot, and so the spatial matrix would be of shape (spots, genes). The minimum therefore would be a pixel? If that's the case, then the mapping (if perfectly converged) would be identical for all the pixels under each spot?

Does the prior on cell density have shape (voxels,) ?

If the above is true, then if I have cell segmentation info for each spot, would it makes sense to generate voxels with shape voxel_shape < spot_shape, so to have something like: voxel_1,voxel_2 = spot_n[0:x,:], spot_n[x:,:], which would make voxel_1, voxel_2 identical in gene expression space, but with different cell density priors (e.g. 3 cells under voxel_1 and 5 cells under voxel_2) ?

I run out of memory when I map: what should I do?
Reduce your spatial data in various parts and map each single part. If that is not sufficient, you will need to downsample your single cell data as well.

this would essentially only happen with non-visium data, where there is pixel-level gene expression value ? (or yes if using an atlas as reference)

Thank you !

Question regarding ad_map variable

Hi, Thanks to authors for creating such a necessary tool for the spatial transcriptomics field. I have doubt regarding the
ad_map object, whether the sum of the probability of all the spatial cells mapped to each cluster is 1
or the sum of the probability of each spatial cell assigned to all the clusters is 1?
I read the paper, but it was not quite clear to me. When I print the value of b then it is 1. You can see down. What is the reasoning behind each cluster probability to be 1?

ad_map = tg.map_cells_to_space(ad_sc, ad_sp,mode='clusters',cluster_label='knownClusters')
gives ad_map object
AnnData object with n_obs × n_vars = 23 × 39521
    obs: 'knownClusters', 'cluster_density'
    var: 'uniform_density', 'rna_count_based_density'
    uns: 'train_genes_df', 'training_history'

    a= np.sum(ad_map.X,axis=0)
    b= np.sum(ad_map.X,axis=1)
    print(len(a),   len(b)) 
    39521,      23
    print(b[0:10]) gives
    [1.0000064  1.0000123  1.0000033  1.0000218  1.0000048  0.99999535
0.99999803 0.9999933  0.99999917 0.9999956 ]

Parameter adjustment

Hi, I am interested in using Tangram for my data.

We have multiple types of spatial transcriptome data(Visium/merFISH...) and single-cell data(10X/smart-seq), so we hope to run different data pairs with different parameters to get the best results. Which parameters need to be adjusted only for different types of data pairs? What do these parameters mean?

Thank you,
Longfei Li

Incorrect scale factor used by default

Hello,

I've noticed a mismatch between histology pixel coordinates and spots (spatial coordinates) when using the tg.plot_cell_annotation_sc function, which went away when I manually supplied the scale_factor argument. If I understand correctly, when adata_st.uns['spatial'] exists, the idea is to use that information, which should include scale factor, to accurately overlap the histology and spatial coords. In particular, my spatial AnnData had the scale factor stored in adata_st.uns['spatial'][sample_name]['scalefactors']['tissue_hires_scalef'], which I believe is a standard location where it should be found (rather than needing to specify scale_factor explicitly).

I traced the source of the "mismatch" to the default assignment of scale factor as 0.1, which is passed to sc.pl.spatial even when adata_st.uns['spatial'] exists. I imagine the default of 0.1 only makes sense when adata_st.uns['spatial'] doesn't exist.

I believe the same issue exists for the tg.plot_genes_sc function, though I haven't explicitly checked this. Apologies if I'm misunderstanding, and I've stored the scale factor in a non-standard location. Note that I'm using tangram 1.0.2 as installed through pip, and am following along the squidpy tutorial.

Thanks for providing the Tangram software!

Best,

-Nick

plot_cell_annotation_sc not found

I've been using your package to deconvolute some visium data following the tutorial. I have successfully made it to the ad_map creation. However, when I try to plot I receive the below error and it looks like it can't find the function. Any help is appreciated!

AttributeError: module 'tangram' has no attribute 'plot_cell_annotation_sc'

Using tangram with HE samples - deconvolution

Hi,

Thanks for developing this tool. I have scRNA-seq data and Visium data - but have HE, non-fluorescent images. I am wondering if I can run Tangram to integrate the data? I am particularly interested in the deconvolution approach.

Thanks,

Cell type percentages per spot based on Tangram cell probabilities?

Hi,

from the matrix P(spatial spots X cells) I'd like to get the percentages for each cell type per spot.
Starting from the probability matrix spatial spots X cells, I was thinking to proceed in this way:

  1. assign to each cell a known cell type
  2. calculate the median probability per cell type, obtaining the matrix spatial spot X cell type
  3. normalize each row value on the rowSum
  4. (optional) filter out values < 0.01 and rescale percentages similarly in (3)

Do you see any pitfalls in this methodology? Would you recommend any another strategies to calculate cell type percentages per spot? I observed that generalising on cell types starting from individual cell probabilities gives me slightly better predictions rather than calculating the probability for each cell type, but maybe it's data-dependent.

Best,
Carlo

About the coordinates

Hi, thanks so much to provide the useful tool for a python user.
I am going to use a sc-RNA data to annotate my 10X visum spatial transcriptomes data. I only have the coordinates for each spot, not the cells within the spot. Can I use this tool also ? From the exsample, I can see there is a pkl file which provides the cells number as well as the individual cell coordinates in the spot, which I don't have, or I can see from 10X visum platform, it's impossible to have those information.

packaging?

Hi,

was wondering if you plan to release a pip/conda installable version of Tangram? Even just a setup.py file that would make it installable via git would be very useful!

Thank you!

EDIT: just saw #8 looking forward to see it merged!

Analysis for other type of tissue

Hello
I'm Joy,a graduate student, trying to use tangram. First, thanks for such a wonderful tool.

I was wondering that basic Tangram model already trained with mouse brain tissue only.
I'm trying to segment cells(from other tissue which is not brain) with the cell segmentation function and proceed with deconvolution on visium data, because if the model is trained only with brain tissue, there is a possibility of analyzing it incorrectly.
If so should i train the model?
i thought that i don't need to train the model when proceed the deconvolution cuz the model already trained some data basically.

if i should train the model to handle other tissue, let me know how to train the model with a few tissue data and scRNA data.

Thank you.
Joy

Add b/w plotting option to tg.plot_genes_sc()

It would be super useful if you could add an option to tg.plot_genes_sc() and tg.plot_cell_annotation_sc() so that the tissue image is shown in black and white. The pink colour of HE stains tends to blur the spot colours. Also, an option to change the alpha of tissue images and spots would be appreciated. Scanpy has similar options for sc.pl.spatial(visium, color="total_counts", bw=True, alpha_img=0.8). Thanks!

What exactly is in `Allen1_cell_centroids.pkl` and how can I make my own?

Hi,

I'm very eager to test your pipeline now using my Visium data. However, in your example notebook, there is this section:

'Load cells coordinates on Visium image'
cells_coordinates = mapping.utils.read_pickle('data/Allen1_cell_centroids.pkl')

The file Allen1_cell_centroids.pkl is not present in your data folder, and it is not clear how you can reproduce the file.

Could you please give an example on how to generate this file from the Space Ranger output?

Thanks

project_genes input inconsistency?

I was trying to run the project_genes and got an error that my .obs indices were not equal. I looked through the documentation was confused which inputs the project_genes takes: the single cell adata or the spatial adata? In the code the argument name adata_sc implies that it should be single cell, but the argument descriptions states spatial.

To follow up, what should the obs.index be representing in these adata inputs?

def project_genes(adata_map, adata_sc, cluster_label=None, scale=True):
"""
Transfer gene expression from the single cell onto space.
Args:
adata_map (AnnData): single cell data
adata_sp (AnnData): gene spatial data
cluster_label (AnnData): Optional. Should be consistent with the 'cluster_label' argument passed to map_cells_to_space function.
scale (bool): Optional. Should be consistent with the 'scale' argument passed to map_cells_to_space function.
Returns:
AnnData: spot-by-gene AnnData containing spatial gene expression from the single cell data.
"""

Interpretation of project_cell_annotation output

Hello, I am interested in using Tangram to integrate my Visium/single cell data and I wanted to better understand the output of project_cell_annotation stored in tangram_ct_pred. Are these values useful on the absolute scale or only relative? I notice that your plotting function standardizes all of these values to 0-1 scale. Thanks!

Typo in tutorial

Hi, I assume the following section in your tutorial should rather say 'spatial data' than 'scRNAseq'? At least that's what I see in my data.

Some genes are detected with very different levels of sparsity - typically they are much more sparse in the scRNAseq than in the spatial data. This is due to the fact that technologies like Visium are more prone to technical dropouts.

Network for registration?

Hi,

In the manuscript there is mention and demonstration (Fig 6, 7, 8) of a NN used to determine the coronal depth and automatically register slices to the ABA CCF. Is the automatic image registration and automated region calling capability available as part of Tangram?

Thanks!

Example data missing?

Hello,

I was trying out the Visium example, but couldn't find the marker gene data that is used to subset relevant markers.
The exact file that I think missing is "spacejams_visp_markers.pkl". It would be nice if you can put the download link as you did on snRNAseq data and others.

Best regards,
Heesoo

Co-localization of cell types using cell type maps

Hello,

First, thanks for your amazing method and easy-to-follow tutorials.

I've used your method to analyze a Visium generated dataset. Our H&E images have low resolution and we can not trust the deconvolution result as we have low AUC score, and segmentation seems to fail in capturing cell counts. I would like to know if you have any suggestion on how we can perform analysis of co-localization using the mapped annotations. Since you also mention in your tutorial that you recommend not performing deconvolution for these type of analyses.

Thanks for your time.

followup on squidpy integration

Hi @lewlin @ziqlu0722 @gscalia ,

following up on the chat re adding Tangram to Squidpy, I digged again into the repo and followed this tutorial: https://github.com/broadinstitute/Tangram/blob/master/example/1_tutorial_tangram.ipynb, here's my comments (in random order):

tg.pp_adatas

Very useful function, but I was wondering if it would be possible to make everything happen in place, instead of copying over the anndata and reindexing? I'm thinking of something like this: https://github.com/YosefLab/scvi-tools/blob/b4256ebb84ebebd70fb920f73d13df9b9bbb73db/scvi/data/_anndata.py#L79
docs: https://docs.scvi-tools.org/en/stable/api/reference/scvi.data.setup_anndata.html#scvi.data.setup_anndata

It would boil down to finding a common set of markers from either the two adatas or an external list (as you show in the tutorial) and add it as a boolean series to the two adatas: adata_[space, sc]["markers_tangram"]. It would be straightforward for the mapper to subset and create the tensors afterward e.g. here:

S = np.array(adata_cells.X.toarray(), dtype='float32')

Of course this can happen in the squidpy call, so we could also work it out there in case you prefer current behavior. I think it would be desirable for memory req.

tg.map_cells_to_space

Really cool that it accepts AnnData now! This makes it very convenient. There is a weird behaviour with the argument d (density?), which is set to None by default and is indeed exposed by the function, but is then re-set to either None or np.ones(G.shape[0])/G.shape[0] according to mode.

In our tutorial we set it to d = np.array(adata_st.obs.cell_count) / adata_st.obs.cell_count.sum() since we show how to get segmentation masks counts (and coordinates for further plotting at the end) for each spot, with the image container. Is this a bug or the behaviour changed? Also, it's missing from the docstring

ut.project_cell_annotations

def project_cell_annotations(adata_map, annotation='cell_type'):

we could save this output to adata_space.obsm["[tangram/deconv]_results"]. In case we have info on the number of cells per spot (e.g. after segmentation), would this still work out?
I remember in the previous tutorial there was an additional filtering step like this:

# highest probability a cell i is filtered if F_i > 0.5'
filtered_voxels_to_types = [
    (j, adata_sc.obs.cell_subclass[k])
    for i, j, k in zip(F_out, resulting_voxels, range(len(adata_sc)))
    if i > 0.5
]

I guess such a filter could also follow adata_map.X.T @ df, and potentially make the matrix sparse?

Meanwhile, I'll open a PR on squidpy for starting the external module addition.

Happy to provide more feedback or contribute, let me know what you think!

best,
Giovanni

count_cell_annotations doesn't work with specific column values

I have been working on my personal data set following the tutorial given by tangram on deconvolution.
All the code till count_cell_annotations seems to work all good and issue no problem.
However, when choosing the specific annotation for count_cell_annotations, the system returns this error.
ad_map, adata_sc, and adata_st were all formatted based on the tangram tutorial and had been working for all the processes.

TypeError Traceback (most recent call last)
~\AppData\Local\Temp/ipykernel_36176/1374048480.py in
----> 1 tg.count_cell_annotations(
2 ad_map,
3 adata_sc,
4 adata_st,
5 annotation="our_annotation",

~\anaconda3\lib\site-packages\tangram\utils.py in count_cell_annotations(adata_map, adata_sc, adata_sp, annotation, threshold)
281
282 for k, v in vox_ct:
--> 283 df_vox_cells.iloc[k, df_vox_cells.columns.get_loc(v)] += 1
284
285 adata_sp.obsm["tangram_ct_count"] = df_vox_cells

~\anaconda3\lib\site-packages\pandas\core\indexes\base.py in get_loc(self, key, method, tolerance)
3359 casted_key = self._maybe_cast_indexer(key)
3360 try:
-> 3361 return self._engine.get_loc(casted_key)
3362 except KeyError as err:
3363 raise KeyError(key) from err

~\anaconda3\lib\site-packages\pandas_libs\index.pyx in pandas._libs.index.IndexEngine.get_loc()

~\anaconda3\lib\site-packages\pandas_libs\index.pyx in pandas._libs.index.IndexEngine.get_loc()

Different celltype ratios of single cell data and spatial data

Hi,

Thanks for sharing the Tangram. It is a very interesting work. I wonder can the tangram algorithm works well when the ratios of cell types of spatial data and single-cell data are different? For example, cell type A takes up 90% of spatial data, while takes up 10% of single-cell data. Although the "clustering" mode is provided for the data from different samples/tissues, do you still assume that the cell-type ratios of single-cell data and spatial data should be similar?

Look forward to your reply. Thank you very much!

Best,
Cathy

Question about voxels spatial position

Your idea is very interesting. And I'm processing data from nanoball which is a new method for spatial RNA-seq.
And I found your paper because you have tried to assign one voxel to more than one cells, which I think is very meaningful.
But, I have a question about your model: do you add some restrainer to voxels or cells to avoid some distant voxels assigned to cell. In your loss function, I think have no restriction about spatial position, or your restrict it in other part of your model.

Outdated seaborn dependency

Hello,

This is a fairly small problem, but I figured it's still best to create an issue for it- in the most recent tutorial (example/1_tutorial_tangram.ipynb), the following function is called:

tg.plot_training_scores(ad_map, bins=50, alpha=.5)

This in turn seems to call seaborn.histplot, a function specific to seaborn>0.11.1, but the environment.yml file in this repository installs seaborn 0.10.1. When following through the tutorial in my own python file, I get the following error:

Traceback (most recent call last):
  File "/dcl02/lieber/ajaffe/SpatialTranscriptomics/LIBD/spython/tangram_testing/example_orig_nick.py", line 55, in <module>
    tg.plot_training_scores(ad_map, bins=50, alpha=.5)
  File "/users/neagles/.conda/envs/tangram/lib/python3.8/site-packages/tangram/plot_utils.py", line 26, in plot_training_scores
    sns.histplot(data=df, y='train_score', bins=10, ax=axs_f[0]);
AttributeError: module 'seaborn' has no attribute 'histplot'

Thus I believe environment.yml should be updated to require seaborn 0.11.1 instead of 0.10.1 (this fixed the issue for me).

Best,
-Nick

the coordinates are flipped

Hello, thank you for creating such a useful tool, I am very happy to use it in my data, but when I draw a graph with tg.plot_cell_annotation_sc, I find that the coordinates are flipped, how can I solve it?

when I use scanpy I got this:
image

But tg.plot_cell_annotation_sc
image

Thanks a lot!

prior density

Hi,
Thanks for you great work.
Now I'm trying do perform tangram with squidpy. I am confused about the density_prior function. It's said in the help document:
density_prior (str, ndarray or None): Spatial density of spots, when is a string, value can be 'rna_count_based' or 'uniform', when is a ndarray, shape = (numbe r_spots,). This array should satisfy the constraints sum() == 1. If None, the density term is ignored. Default value is 'rna_count_based'.
what is "density_prior" and how the rna_count_based density are computed (using the raw counts, normalized counts or scaled data) ? I got lots of negative values. In my case, the scaled data is my adata.X, and the log normalized data is in adata.raw and the raw counts were not stored in my anndata object, so I think the negative values could be caused by the lack of raw counts. And what does "spatial density" mean ? Is it the cell number in a spot ?

Error running map_cells_to_space

Hi, I am interested in using Tangram for my research. I have Visium data and 10X genomics snRNA-seq data. I am following the tutorial, which works flawlessly for the data provided, but gives an error when running map_cells_to_space on my own data.

I am loading the Visium data straight from spaceranger, and I am constructing an anndata object from a .mtx file for the single nucleus data.

Here is the code that I am running:

import os, sys
import numpy as np
import pandas as pd
import matplotlib.pyplot as plt
import seaborn as sns
import scanpy as sc
import torch
from scipy import io
from scipy.sparse import coo_matrix, csr_matrix
import anndata

#sys.path.append('/home/exx/git/Tangram/')  # uncomment for local import
import tangram as tg

%load_ext autoreload
%autoreload 2
%matplotlib inline

data_dir = 'data/'

# load one visium sample:
ad_sp = sc.read_visium('Visium1/outs/')

# load single-cell data
X = io.mmread("{}zhou_counts.mtx".format(data_dir))

# create anndata object
ad_sc = anndata.AnnData(
    X=X.transpose().tocsr()
)

# load sample metadata:
sample_meta = pd.read_csv("{}zhou_meta.csv".format(data_dir))

# load gene names:
with open("{}zhou_gene_names.csv".format(data_dir), 'r') as f:
    gene_names = f.read().splitlines()
    
ad_sc.obs = sample_meta
ad_sc.obs.index = ad_sc.obs['barcode']
ad_sc.obs = ad_sc.obs.drop(labels='barcode', axis=1)
ad_sc.var.index = gene_names

markers = pd.read_csv('data/zhou_marker_genes.csv')

# only keep markers that are in both dataset:
markers = markers[markers.gene.isin(ad_sp.var.index)]

# prepare for mapping
tg.pp_adatas(ad_sc, ad_sp, genes=markers.gene.unique())

assert ad_sc.uns['training_genes'] == ad_sp.uns['training_genes']

ad_map = tg.map_cells_to_space(
    adata_sc=ad_sc,
    adata_sp=ad_sp,
    #device='cpu'
    device='cuda'
)

The error when running map_cells_to_space is the following:

INFO:root:Allocate tensors for mapping.
INFO:root:Begin training with 1500 genes and rna_count_based density_prior in cells mode...
---------------------------------------------------------------------------
ValueError                                Traceback (most recent call last)
<ipython-input-130-a433d3224cd2> in <module>
      3     adata_sp=ad_sp,
      4     #device='cpu'
----> 5     device='cuda'
      6 )

/dfs3b/swaruplab/smorabit/bin/software/miniconda3/envs/scvi-env/lib/python3.7/site-packages/tangram/mapping_utils.py in map_cells_to_space(adata_sc, adata_sp, cv_train_genes, cluster_label, mode, device, learning_rate, num_epochs, scale, lambda_d, lambda_g1, lambda_g2, lambda_r, lambda_count, lambda_f_reg, target_count, random_state, verbose, density_prior)
    311         )
    312         mapper = mo.Mapper(
--> 313             S=S, G=G, d=d, device=device, random_state=random_state, **hyperparameters,
    314         )
    315 

/dfs3b/swaruplab/smorabit/bin/software/miniconda3/envs/scvi-env/lib/python3.7/site-packages/tangram/mapping_optimizer.py in __init__(self, S, G, d, d_source, lambda_g1, lambda_d, lambda_g2, lambda_r, device, adata_map, random_state)
     59         self.target_density_enabled = d is not None
     60         if self.target_density_enabled:
---> 61             self.d = torch.tensor(d, device=device, dtype=torch.float32)
     62 
     63         self.source_density_enabled = d_source is not None

ValueError: too many dimensions 'matrix'

Celltype specific Expression value with Tangram

Thank you for creating Tangram,

incredibly useful and impressive tool, for cell deconvolution in spatial transcriptomics.

I wondered if Tangram has the ability to detect cell type specific expression values after single cell mapping and obtain cell type specific expression values of the cells.

Question about training score in reference dataset

Hello,

I am followind the tutorial but using a single nucleus dataset as reference, and trying to map it to a visium sample. It seems I am finding a very poor training score on the reference dataset (see attached figure). Is there some way I could improve that?

Thank you for creating and maintaining the package.

training_scores

Question about parallelizing over multiple GPUs

Hello!

I don't have much experience using PyTorch, and I was wondering if Tangram could be easily modified to parallelize over multiple GPUs? I am trying to map onto a spatial dataset which is quite large (~500k cells) and am running into this error:

RuntimeError: CUDA out of memory. 
Tried to allocate 52.38 GiB (GPU 0; 39.59 GiB total capacity; 
860.74 MiB already allocated; 
37.90 GiB free; 
882.00 MiB reserved in total by PyTorch) 
If reserved memory is >> allocated memory try setting max_split_size_mb to avoid fragmentation.  
See documentation for Memory Management and PYTORCH_CUDA_ALLOC_CONF

The GPUs I am using have a 40GB capacity so this error makes sense to me. Is there a way to split across 2 GPUs in PyTorch? I also understand that using mode = "cluster" can help alleviate the processing resources required, but was curious about this issue nonetheless.

Thank you!

Follow up on Spot-Level Deconvolution

Hello,

My colleagues and I have been able to use Tangram to successfully map genes onto our Visium spatial dataset thanks to your incredibly helpful tutorial. However, we would like to implement deconvolution (i.e. assigning cell types to each spot of the Visium slide) as part of our Tangram pipeline in order to generate images similar to the one included in the manuscript and attached below for reference but we are unsure how to go about it. I was not able to find functions related to deconvolution in the Git repository with the exception of df_to_cell_types in utils.py:

Tangram/tangram/utils.py

Lines 376 to 402 in eb867f5

# def df_to_cell_types(df, cell_types):
# """
# Utility function that "randomly" assigns cell coordinates in a voxel to known numbers of cell types in that voxel.
# Used for deconvolution.
# Args:
# df (DataFrame): Columns correspond to cell types. Each row in the DataFrame corresponds to a voxel and
# specifies the known number of cells in that voxel for each cell type (int).
# The additional column 'centroids' specifies the coordinates of the cells in the voxel (sequence of (x,y) pairs).
# cell_types (sequence): Sequence of cell type names to be considered for deconvolution.
# Columns in 'df' not included in 'cell_types' are ignored for assignment.
# Returns:
# A dictionary <cell type name> -> <list of (x,y) coordinates for the cell type>
# """
# df_cum_sums = df[cell_types].cumsum(axis=1)
# df_c = df.copy()
# for i in df_cum_sums.columns:
# df_c[i] = df_cum_sums[i]
# cell_types_mapped = defaultdict(list)
# for i_index, i in enumerate(cell_types):
# for j_index, j in df_c.iterrows():
# start_ind = 0 if i_index == 0 else j[cell_types[i_index - 1]]
# end_ind = j[i]
# cell_types_mapped[i].extend(j['centroids'][start_ind:end_ind].tolist())
# return cell_types_mapped

which is commented out. Is deconvolution forthcoming or am I overlooking something?

image

Like I mentioned before, we have otherwise been able to implement some of Tangram’s functionality already and we appreciate the help you’ve given us in the past.

Thank you,
Arta Seyedian

General Questions: Visium

I am attempting to use your tool for visium data and was hoping to clarify my analysis pipeline with your great tool. I currently am using publicly available single cell data, but will eventually have matched single cell data for the visium sample. I would ideally like to map the matched single cell data onto the visium spatial slide. From reading your tutorial, it seems that this would have to be done in two steps: deconvolution of the visium spatial spots and then mapping of the single cell data onto the slide. It was unclear from the tutorial if tangram is the appropriate method to be using for both these steps and which functions I should be using. Here are my questions:

  1. Is this two step assumption: (1) deconvolution using cell types determined by single cell clustering. (2) single cell mapping. correct? or can you jump directly to mapping of the single cells onto the visium spots?
  2. If tangram is not the appropriate method for the deconvolution (or the analysis I am describing), is there another method that you suggest that I can then utilize the output in the single cell mapping capabilities of tangram?
  3. Is there a tutorial on performing this analysis on Visium data specifically?

As I have never done this type of analysis before, any guidance would be appreciated.

Thank you so much for your time.

Kernel dying during map_cells_to_space

Hi I'm trying to run the vignette and the kernel keeps dying within seconds of using the "map_cells_to_space" function. Is this a known issue or am I doing something wrong? The code is below (the data is the same as in the Github repo data folder).

ad_sp = sc.read_h5ad('path/test_ad_sp.h5ad')
ad_sc = sc.read_h5ad('path/test_ad_sc.h5ad')
tg.pp_adatas(ad_sc, ad_sp, genes=None)

ad_map = tg.map_cells_to_space(ad_sc, ad_sp,
mode="cells",
num_epochs=100,
device='cpu')

Documenting impact of normalization and gene selection on the quality of the results

Hi Tommaso,
Thanks for the great tool! I'm trying to apply it for deconvolution of Visium data, and am puzzled with few questions.
First, what's the best way to normalize the data? In the example you mention that you didn't run log-normalization, but I didn't find actual discussion of that in the paper, while normalization was shown to be the most influential step for scRNA-seq analysis.
Second, what's the best way of selecting genes? I don't expect that we should just blindly take all 30k of them, right? It would be super-valuable to know, whether the method is robust to the gene set or whether one should try different sets until success.
Finally, would it be too bad if I provide constant density (parameter d) for all spots in the tissue? Our stainings are quite messed up, and I don't think segmentation is possible on them.

KeyError:"Spatial key 'spatial' not found in `adata.uns`."

hello,
when i use nuclues image and spatial data to deconvolute the data, there appears one error that 'spatial key' 'spatial' not found. However, we don't have this key in our data as we use stereo seq rather than visium to access spatial data. So is there any solution to this problem?
屏幕截图 2022-05-22 130421

Map multimodal data such as SHARE-seq to reveal spatial patterns of chromatin accessibility

Hi, thank you very much for developing such a helpful tool! I am interested in mapping multimodal data such as SHARE-seq to reveal spatial patterns of chromatin accessibility, but I don't know how to do that. I can map snRNA-seq to spatial data, but I have no idea to transfer snATAC-seq profile of the same cells to space. I want to visualize inferred spatial patterns of chromatin accessibility and transcription factor motif scores at single-cell resolution.
Thank you very much if there is a tutorial or code.

missing areas in plot_cell_annotation_sc

Hi!

After running the map_cells_to_space and plot_cell_annotation_sc, I noticed that a lot of my spots ended up dropping out and the plot results in large areas missing. Is this to be expected?

image

Question about citation of dataset

Hello.

I've read your tutorial about tangram via the link https://github.com/broadinstitute/Tangram/blob/master/tutorial_tangram_without_squidpy.ipynb. This link contains a snRNA-seq dataset and a slide-seq2 dataset collected from MOp area in adult mouse brain. I want to use this dataset for further scientific research but this website doesn't provide a clear citation. I am wondering whether you could provide the data source or published paper to help me.

Thanks for your help.

Recommend Projects

  • React photo React

    A declarative, efficient, and flexible JavaScript library for building user interfaces.

  • Vue.js photo Vue.js

    🖖 Vue.js is a progressive, incrementally-adoptable JavaScript framework for building UI on the web.

  • Typescript photo Typescript

    TypeScript is a superset of JavaScript that compiles to clean JavaScript output.

  • TensorFlow photo TensorFlow

    An Open Source Machine Learning Framework for Everyone

  • Django photo Django

    The Web framework for perfectionists with deadlines.

  • D3 photo D3

    Bring data to life with SVG, Canvas and HTML. 📊📈🎉

Recommend Topics

  • javascript

    JavaScript (JS) is a lightweight interpreted programming language with first-class functions.

  • web

    Some thing interesting about web. New door for the world.

  • server

    A server is a program made to process requests and deliver data to clients.

  • Machine learning

    Machine learning is a way of modeling and interpreting data that allows a piece of software to respond intelligently.

  • Game

    Some thing interesting about game, make everyone happy.

Recommend Org

  • Facebook photo Facebook

    We are working to build community through open source technology. NB: members must have two-factor auth.

  • Microsoft photo Microsoft

    Open source projects and samples from Microsoft.

  • Google photo Google

    Google ❤️ Open Source for everyone.

  • D3 photo D3

    Data-Driven Documents codes.