taipanrex / pyvisgraph Goto Github PK
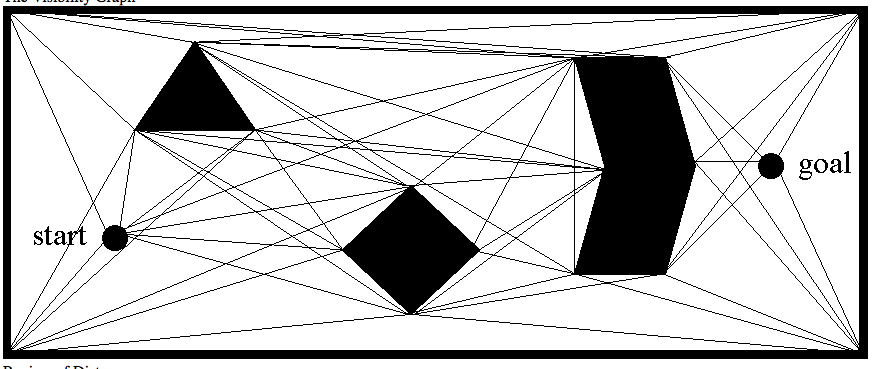
View Code? Open in Web Editor NEWGiven a list of simple obstacle polygons, build the visibility graph and find the shortest path between two points
License: MIT License
Given a list of simple obstacle polygons, build the visibility graph and find the shortest path between two points
License: MIT License


  below is a convex polygon, each point should only have 2 visible points, but point_3 got 3.
  polygon_crossing function need review, as it return false when checking mid point (208.5, 227)

    self.point_1 = Point(298, 163.0)
    self.point_2 = Point(263, 168.0)
    self.point_3 = Point(199, 194.0)
    self.point_4 = Point(192, 227.0)
    self.point_5 = Point(218, 260.0)

    g = vg.VisGraph()
    g.build([[self.point_1, self.point_2, self.point_3, self.point_4, self.point_5]])
If try to add a incorrect polygon, should raise an exception. Should be simple polygons, i.e. min. 3 points, no intersecting lines etc.
Add standardized performance testing for benchmark use.
If there are two points of equal distance, the priority in the priority_dict will be same. heapq will then revert to the next value (which are the Points themselves) and try and compare. Point does not have a lt (or a cmp for that matter, so not sure why this isnt a problem in Python2) and it raises a ValueError as Points are not comparable.
A quick fix is to add a lt to Point class, and just compare their hash. This way its kind of random which solution is chosen.
When open_edges is initialized, the scanline checks intersection against all Edges in graph. It might be faster on graphs with many obstacle polygons to check if the scanline crosses the bounding box of each polygon first. For the boxes it does not cross, all edges in that polygon can be ignored.
I am trying to create a visibility graph from a shapefile, following the examples.
The example programs run fine, and I am able to get a correct path.
For my own shapefile, the visibility graph seem to never avoid crossing the polygons. So solution paths always cross a polygon if a polygon exists between them.
Here is my original map, plotting the polygons with matplotlitb.

For faster debugging, I made a reduced shapefile with only two polygons.
Here, I plotted all the edges in graph.visgraph.get_edges(). You can also see the solution path passing through the polygon.

Any idea what might cause this? Happy to share code if it helps.
The code starts by converting a raster to polygons with fiona, saving them as a shapefile, then following example 1. Not too experienced with geospatial data, so I could have made an error here. But the polygons load fine in QGIS.
If you are running build() with multiple workers, CTRL-C will not kill them and you have to end the processes through the task manager/kill in separate terminal. The below solution should work:
def do_work(i):
    try:
        print 'Work Started: %d %d' % (os.getpid(), i)
        time.sleep(2)
        return 'Success'
    except KeyboardInterrupt, e:
        pass

def main():
    pool = multiprocessing.Pool(3)
    p = pool.map_async(do_work, range(6))
    try:
        results = p.get(0xFFFF)
    except KeyboardInterrupt:
        print 'parent received control-c'
        return
tests test_colin1 and test_colin2 illustrate this. One way to solve this would be to track the previous point, if it was visible, p is also visible.
I tried to build a visibility graph with the following input:
[[vg.Point(x=119.55624999999999, y=16.48333333333367), vg.Point(x=203.7872976182326, y=81.64246915103985), vg.Point(x=203.78733213720346, y=112.326984303335), vg.Point(x=189.70101758191677, y=112.326984303335), vg.Point(x=184.99113388465582, y=75.10000000000025), vg.Point(x=184.99113388465582, y=103.01666666666668), vg.Point(x=133.69454408285583, y=103.01666666666668), vg.Point(x=133.69454408285583, y=75.10000000000025), vg.Point(x=131.22787741618916, y=75.10000000000025), vg.Point(x=131.22787741618916, y=103.0166666666666), vg.Point(x=119.55624999999999, y=103.01666666666759)]].
This was the result:

I solved this by rounding the points before giving them as input.
I suggest fixing this bug.
I found that this doesnt work for very small shapes. Because in the result, coordinates are rounded to 2 decimal places.
So i kindly request you to add a parameter for decimal places which will support feet or meter accuracy.
In the examples folder and the 1_build_graph_from_shapefiles.py file, change the description from line 27:31 with the following:
# In this example a visibility graph will be created from the GSHHS shorelines
# available at: http://www.soest.hawaii.edu/pwessel/gshhg/
# 1. Download the shorelines in the format of shapefiles and select the wanted resolution
#    and level (in this example we use GSHHS (type), Crude (quality), L1 (region)).
# 2. Copy all the related files (shx, shp, prj, dbf) from the following subfolder (GSHHS -> c)
#    and only the *C1 relevant files to the folder that contains this script.
same_point is not defined and should be. Initiate to None, then throw an exception if still None after the two if statements. There are instances where a point of a polygon is on the edge of another polygon. That means their distances are equal, but have no common points. same_point therefore does not exist...
See test test_shortest_path. I had first made a new visible_edges list for origin and destination, then make a shallow copy of visgraph and combine them. The problem is that visgraph is a dict of lists and a Python shallow copy will only go 1 level deep, so when adding edges to the copy dict, its adding to visgraph as well. I am considering reverting the new edges by tracking a list of new edges and using set operations to remove them.
I am using this to model a city with the buildings and no-fly zones(NFZ) which will have 3d representations, for navigating an UAV through these buildings and NFZs. Has there been any attempt to extend this to 3D? Or are there any leads in this direction? If not I would love to make an attempt at extending this to 3D
Let's say I have a first shape with points [(0, 0), (1, 0), (1, 1)] and a second shape with points [(0, 0), (1, 0), (1, -1)]
This crashes the program with error :
File "pyvisgraph/vis_graph.py", line 82, in build
    for edge in _vis_graph(self.graph, batch):
  File "pyvisgraph/vis_graph.py", line 156, in _vis_graph
    for p2 in visible_vertices(p1, graph, scan='half'):
  File "pyvisgraph/visible_vertices.py", line 110, in visible_vertices
    insort(open_edges, k)
  File "pyvisgraph/visible_vertices.py", line 346, in insort
    if x < a[mid]: hi = mid
  File "pyvisgraph/visible_vertices.py", line 388, in __lt__
    aslf = angle2(self.p1, self.p2, self.edge.get_adjacent(same_point))
UnboundLocalError: local variable 'same_point' referenced before assignment
Currently implemented by checking if the mid-point of each visible edge is on the interior of a polygon using point_in_polygon(). This runs in O(n^2), is there a faster way?
One optimization is to create a polygon class and track if it is convex or concave. Point_in_polygon is only needed for concave polygons.
Should only be updating visgraph. Have not looked at why graph is also being updated. Basically when you update([point]), point in graph.
I have started developing this on the documentation branch. I will host these on readthedocs.io, using Sphinx.
There will be two parts to the documentation 1) from the user perspective 2) from the developer perspective.
In the ccw function defined in visible_vertices.py, the term area = (B.x - A.x) * (C.y - A.y) - (B.y - A.y) * (C.x - A.x) is evaluated. Rounding error caused by Python number representation when computing the term can mean that the function evaluates colinear points as noncolinear. This can cause lots of problems later on (evaluated many edges incorrectly in my particular application's visibility graph).
I am using Python 2.7 so I cannot make use of math.isclose(), so I defined an isclose method in the file and then used that to check if the area as computed by ccw was close to zero with an absolute tolerance of 0.0000000000000001.
I narrowed down a mistake in evaluating visible vertices to a failure to detect a point inside a polygon. In the function polygon_crossing there is a section intended to evaluate edges where one or both edge points sit on the ray from the point to +INF in the X direction. It fails in some cases.
In the picture below, the red line indicates two points mistakenly identified as visible to each other. In the process, a point inside the T-shaped polygon along the red line shown is mistakenly identified as outside the polygon.

I never found the bug exactly, but I came up with some slightly reworked logic that seems functional so far. The reworked logic is as follows:
It is generally best to include the license file in the distributed source tarball. It is helpful for downstream packaging (and generally expected). Can you add that to the next release on PyPi?
Since this package seems to be intended for large scale navigation on earth I wonder if the input polygons are given in (latitude, longitude) coordinates. In that case the distance the actual distance between two points would not be euclidian but the haversine distance right? I am curious how this issue has been incorporated.
I ask because my packages https://github.com/MrMinimal64/extremitypathfinder and https://github.com/MrMinimal64/timezonefinder are related to this issue. Thanks
When the start or end point is on the boundary of a polygon, VisGraph.shortest_path() throws an error, as demonstrated in this test case:
import pyvisgraph as vg
polys = [[vg.Point(3.0,2.0), vg.Point(6.0,2.0), vg.Point(6.0,7.0), vg.Point(3.0,7.0)]]
g = vg.VisGraph()
g.build(polys)
s = vg.Point(3.0,5.0)
e = vg.Point(8.0,5.0)
path = g.shortest_path(s, e)
print path
---------------------------------------------------------------------------
KeyError                                  Traceback (most recent call last)
<ipython-input-64-23f53555023b> in <module>()
      5 s  = vg.Point(3.0,5.0)
      6 e = vg.Point(8.0,5.0)
----> 7 path = g.shortest_path(s, e)
      8 print path

pyvisgraph\vis_graph.py in shortest_path(self, origin, destination)
    128             for v in visible_vertices(destination, self.graph, origin=orgn):
    129                 add_to_visg.add_edge(Edge(destination, v))
--> 130         return shortest_path(self.visgraph, origin, destination, add_to_visg)
    131
    132     def point_in_polygon(self, point):

pyvisgraph\shortest_path.py in shortest_path(graph, origin, destination, add_to_visgraph)
     68         path.append(destination)
     69         if destination == origin: break
---> 70         destination = P[destination]
     71     path.reverse()
     72     return path

KeyError: Point(8.00, 5.00)
Not sure if this is the intended behavior.
It seems unusual that pyvisgraph will run the shortest path along a polygon boundary, e.g. as in the illustration below, yet not allow the start or end point to be on the boundary.

(source code for this illustration is here)
In this application of a pixelated map with integer coordinates, it's not a trivial issue: the start and end points must be 1-pixel outside the polygon, yet the interior points of the path can be on the polygon boundary.
My clunky workaround is to use Shapely to move the start and/or end points outward along the edge normal by 0.1 units. This avoids the error, and gives the correct result when the path coordinates are rounded back to integers.
An AVL Tree has O(log n) insert, delete and search, which is better than Python lists' sort O(n log n) and delete O(n). Critical for the performance of Lee's algorithm.
_Hi
I was trying to use the algorithm with shapely polygons.
To pass the points to the graph I'm using polygon.exterior
When I run the algorithm I have the shortest path that is crossing the polygon. Below are the link to the plot and zoom of the area where the path crosses the polygon.
All the land is represented by one polygon, no multipolygons or overlaping polygons.
https://www.dropbox.com/s/rlyxf8e7sw6yn0t/land%20crossing.png?dl=0 (polygon plot with shortest path)
https://www.dropbox.com/s/i6b5ziwplauxqj9/land%20crossing%20zoom.png?dl=0 (zoom)
Any clue how to solve this problem and what am I doing wrong ?_
SOLVED:
I checked than when you call polygon.exterior you might have points with a huge number of decimal points, so just round the points coordinates to a limited number of decimal points for the coordinates. This solved my problem
Hi. Sorry if this is an already available feature. Is it possible to have the visibility graph take into consideration a boundary polygon of an arbitrary number of points and arbitrary shape as in:
https://tildesites.bowdoin.edu/~ltoma/teaching/cs3250-CompGeom/spring16/Assignments/visgraph.png
Would it be possible to alter the visibile_vertices function to detect points on the edge of a polygon as well?
For example in the following example:
p1 = vg.Point(0.20,0.1)
p2 = vg.Point(0.50,0.5)
p3 = vg.Point(0.49,0.5)
polys = [[(0,0),(1,0),(0,1)]]
G = vg.Graph(polys)
vg.visible_vertices.visible_vertices(p1,G1,destination= p2) will return [Point(0.00, 1.00), Point(0.00, 0.00), Point(1.00, 0.00)]
vg.visible_vertices.visible_vertices(p1,G1,destination= p3) will return [Point(0.49, 0.50), Point(0.00, 1.00), Point(0.00, 0.00), Point(1.00, 0.00)]
Would it be possible to maybe alter the visibile_vertices function to get [Point(0.00, 1.00), Point(0.00, 0.00), Point(1.00, 0.00), Point(0.50, 0.50)] from vg.visible_vertices.visible_vertices(p1,G1,destination= p2) as well? Or is there another way to achieve this result?
Hi there @TaipanRex
I just wanted to say thanks for this awesome library and the associated blog writeups! I've been porting it across to js here
In doing so I was tinkering with the performance and found that the int() operation this line made a significant difference to my performance.
On data with 1400 points calculating the graph takes either 4 seconds (using the existing float) vs 30 seconds (converting on the integer). I don't know if it's just the js parseInt function that is super slow but just thought I'd give you a heads up.
Anyway thanks again :)
Rowan
As I have mentioned before I really enjoy your project and I have an idea for an improvement.
One worker
When building a graph from polygons derived from shorelines such as GSHHS_c_L1 containing 742 shapes using 1 worker the output works nicely even though there is no indication in time when it will be done:
[Done][Rem.][Avg t]
[  79][1608][0.051]
This is sufficient for small graphs, but complex sets of polygons such as the intermediate shoreline set as GSHHS_i_L1 this can take a long time with one worker and with a time estimate it is even harder to plan around and perhaps do over the weekend.
More than one worker
Using more than one worker the different workers overwrite the progress output on the same line and the output is garbled and it is even harder to find out when the process will be done. Using say 16 workers it is almost impossible to decipher the progress.
 [Done][Rem.][Avg t] [Done][Rem.][Avg t] [Done][Rem.][Avg t] [Done][Rem.][Avg t]
[63.0C[ 281][ 140][0.059]
Proposed solution
I was thinking of rewriting the current progress bar with a modern alternative such as tqdm or progressbar2, but wanted to make sure that this is inline with your thoughts on the progress bar before I started.
First of all, thanks for the very nice library. I really enjoy it. I think I have found a bug, which I have detailed below.
I am using the polygon shoreline set GSHHS_c_L1 and I am trying to calculate the distance between the the two points:
p1 = (179, 0)
p2 = (-179, 0)
The true distance between the points is probably something close to the geopy.distance.greater_circle distance of 120 nm as the points are very close to each other with no polygons in the way.
The pyvisgraph distance is 21595 nm and the calculated graph is shown below using folium. It is quite clear that the problem is that pyvisgraph does not take into account the crossing of the antimeridian. Is there any way this could be enabled or is there something I have overlooked?

Request for support of polygons with interior holes. I think the core of the code will work as is if there is some way to represent them.
For now my hack is this: when creating the list of polygons for the graph creation, specify the exterior polygon ring first, then put a blank polygon (empty list) in front of every matching interior ring. Then in the init method for the graph I catch those empty lists and rewind the pid by one. The resulting behavior for the visibility graph seems fine so far.
I was wondering if might be a good idea to have an examples folder in the library showing how to use the package.
For myself at least I needed write some extra code to use the package to read shapefiles, calculate shortest distance and plot the voyages on maps, so I was thinking that a small examples folder could contain some minimal working examples to do these things just to get users of for a flying start?
I have examples ready if you are interested I could make a pull-request with these for the project?
Kind regards
Thomas Jansson
Hi! This is an amazing library and I have really enjoyed working with it. I have come across an issue I haven't been able to root cause. Some of the shapefiles I have used (such as: https://geodata.lib.berkeley.edu/catalog/ark28722-s7d02x) will have an IndexError during if self._open_edges[index] == edge, where the index is -1 (calculated from index = self._index(p1, p2, edge) - 1 in the delete function of class OpenEdges. I have been unable to figure out why some shapefiles would lead to this. I have examined and cleaned the polygons closely in QGIS. Any ideas on how to overcome this?
overlaps = True
while overlaps:
overlaps = False
for each polygon n:
for each polygon m:
# https://techoverflow.net/2017/02/23/computing-bounding-box-for-a-list-of-coordinates-in-python/
# checking bounding boxes is a quick way to see if two polygons potentially overlap.
if the bounding box of n overlaps with the bounding box of m:
# combine the polygons or return both if they don't actually overlap
https://stackoverflow.com/questions/2667748/how-do-i-combine-complex-polygons
overlaps = True
Worst case this runs in O(n^3), i.e. all polygons overlap.
Implement algorithm to reduce number of points in a polygon:
Help please.
I didn't use shape to specify the obstacles. I just manually input the polygons like:
polys = [[vg.Point(0.0,1.0), vg.Point(3.0,1.0), vg.Point(1.5,4.0)],[vg.Point(4.0,4.0), vg.Point(7.0,4.0), vg.Point(5.5,8.0)]]
Is it wrong? The boundary is specified by the convex hull vertices of all points in a polygon.

When you run closest_point, the point it returns is actually on a edge of the polygon. This does not seem to have an effect when using shortest_path or update, but must be fixed. Need to extend the line just slightly to get the point outside of the polygon. See test_closest_point.
This will be used to enhance point_in_polygon and possibly edge initialization.
Implement a config solution so a user can set T, T2, COLIN_TOLERANCE, INF through the API. Should probably be implemented in the VisGraph class - https://stackoverflow.com/a/43941592.
Those constants should also be renamed to something more meaningful...
Right now point_in_polygon will check all polygons in graph, using polygon_crossing. Instead, each polygon's bounding box should be stored when initializing graph. Then point_in_polygon can first check against the bounding box, then polygon_crossing.
A declarative, efficient, and flexible JavaScript library for building user interfaces.
🖖 Vue.js is a progressive, incrementally-adoptable JavaScript framework for building UI on the web.
TypeScript is a superset of JavaScript that compiles to clean JavaScript output.
An Open Source Machine Learning Framework for Everyone
The Web framework for perfectionists with deadlines.
A PHP framework for web artisans
Bring data to life with SVG, Canvas and HTML. 📊📈🎉
JavaScript (JS) is a lightweight interpreted programming language with first-class functions.
Some thing interesting about web. New door for the world.
A server is a program made to process requests and deliver data to clients.
Machine learning is a way of modeling and interpreting data that allows a piece of software to respond intelligently.
Some thing interesting about visualization, use data art
Some thing interesting about game, make everyone happy.
We are working to build community through open source technology. NB: members must have two-factor auth.
Open source projects and samples from Microsoft.
Google ❤️ Open Source for everyone.
Alibaba Open Source for everyone
Data-Driven Documents codes.
China tencent open source team.