Coder Social home page Coder Social logo

slowkow / ggrepel Goto Github PK

View Code? Open in Web Editor NEW
1.2K 27.0 93.0 34.3 MB

:round_pushpin: Repel overlapping text labels away from each other in your ggplot2 figures.

Home Page: https://ggrepel.slowkow.com

License: GNU General Public License v3.0

R 69.43% C++ 29.28% Python 0.90% CSS 0.20% Just 0.20%
ggplot2 cran visualization text rstats

ggrepel's Introduction

ggrepel

Build Status CRAN_Status_Badge CRAN_Downloads_Badge

Overview

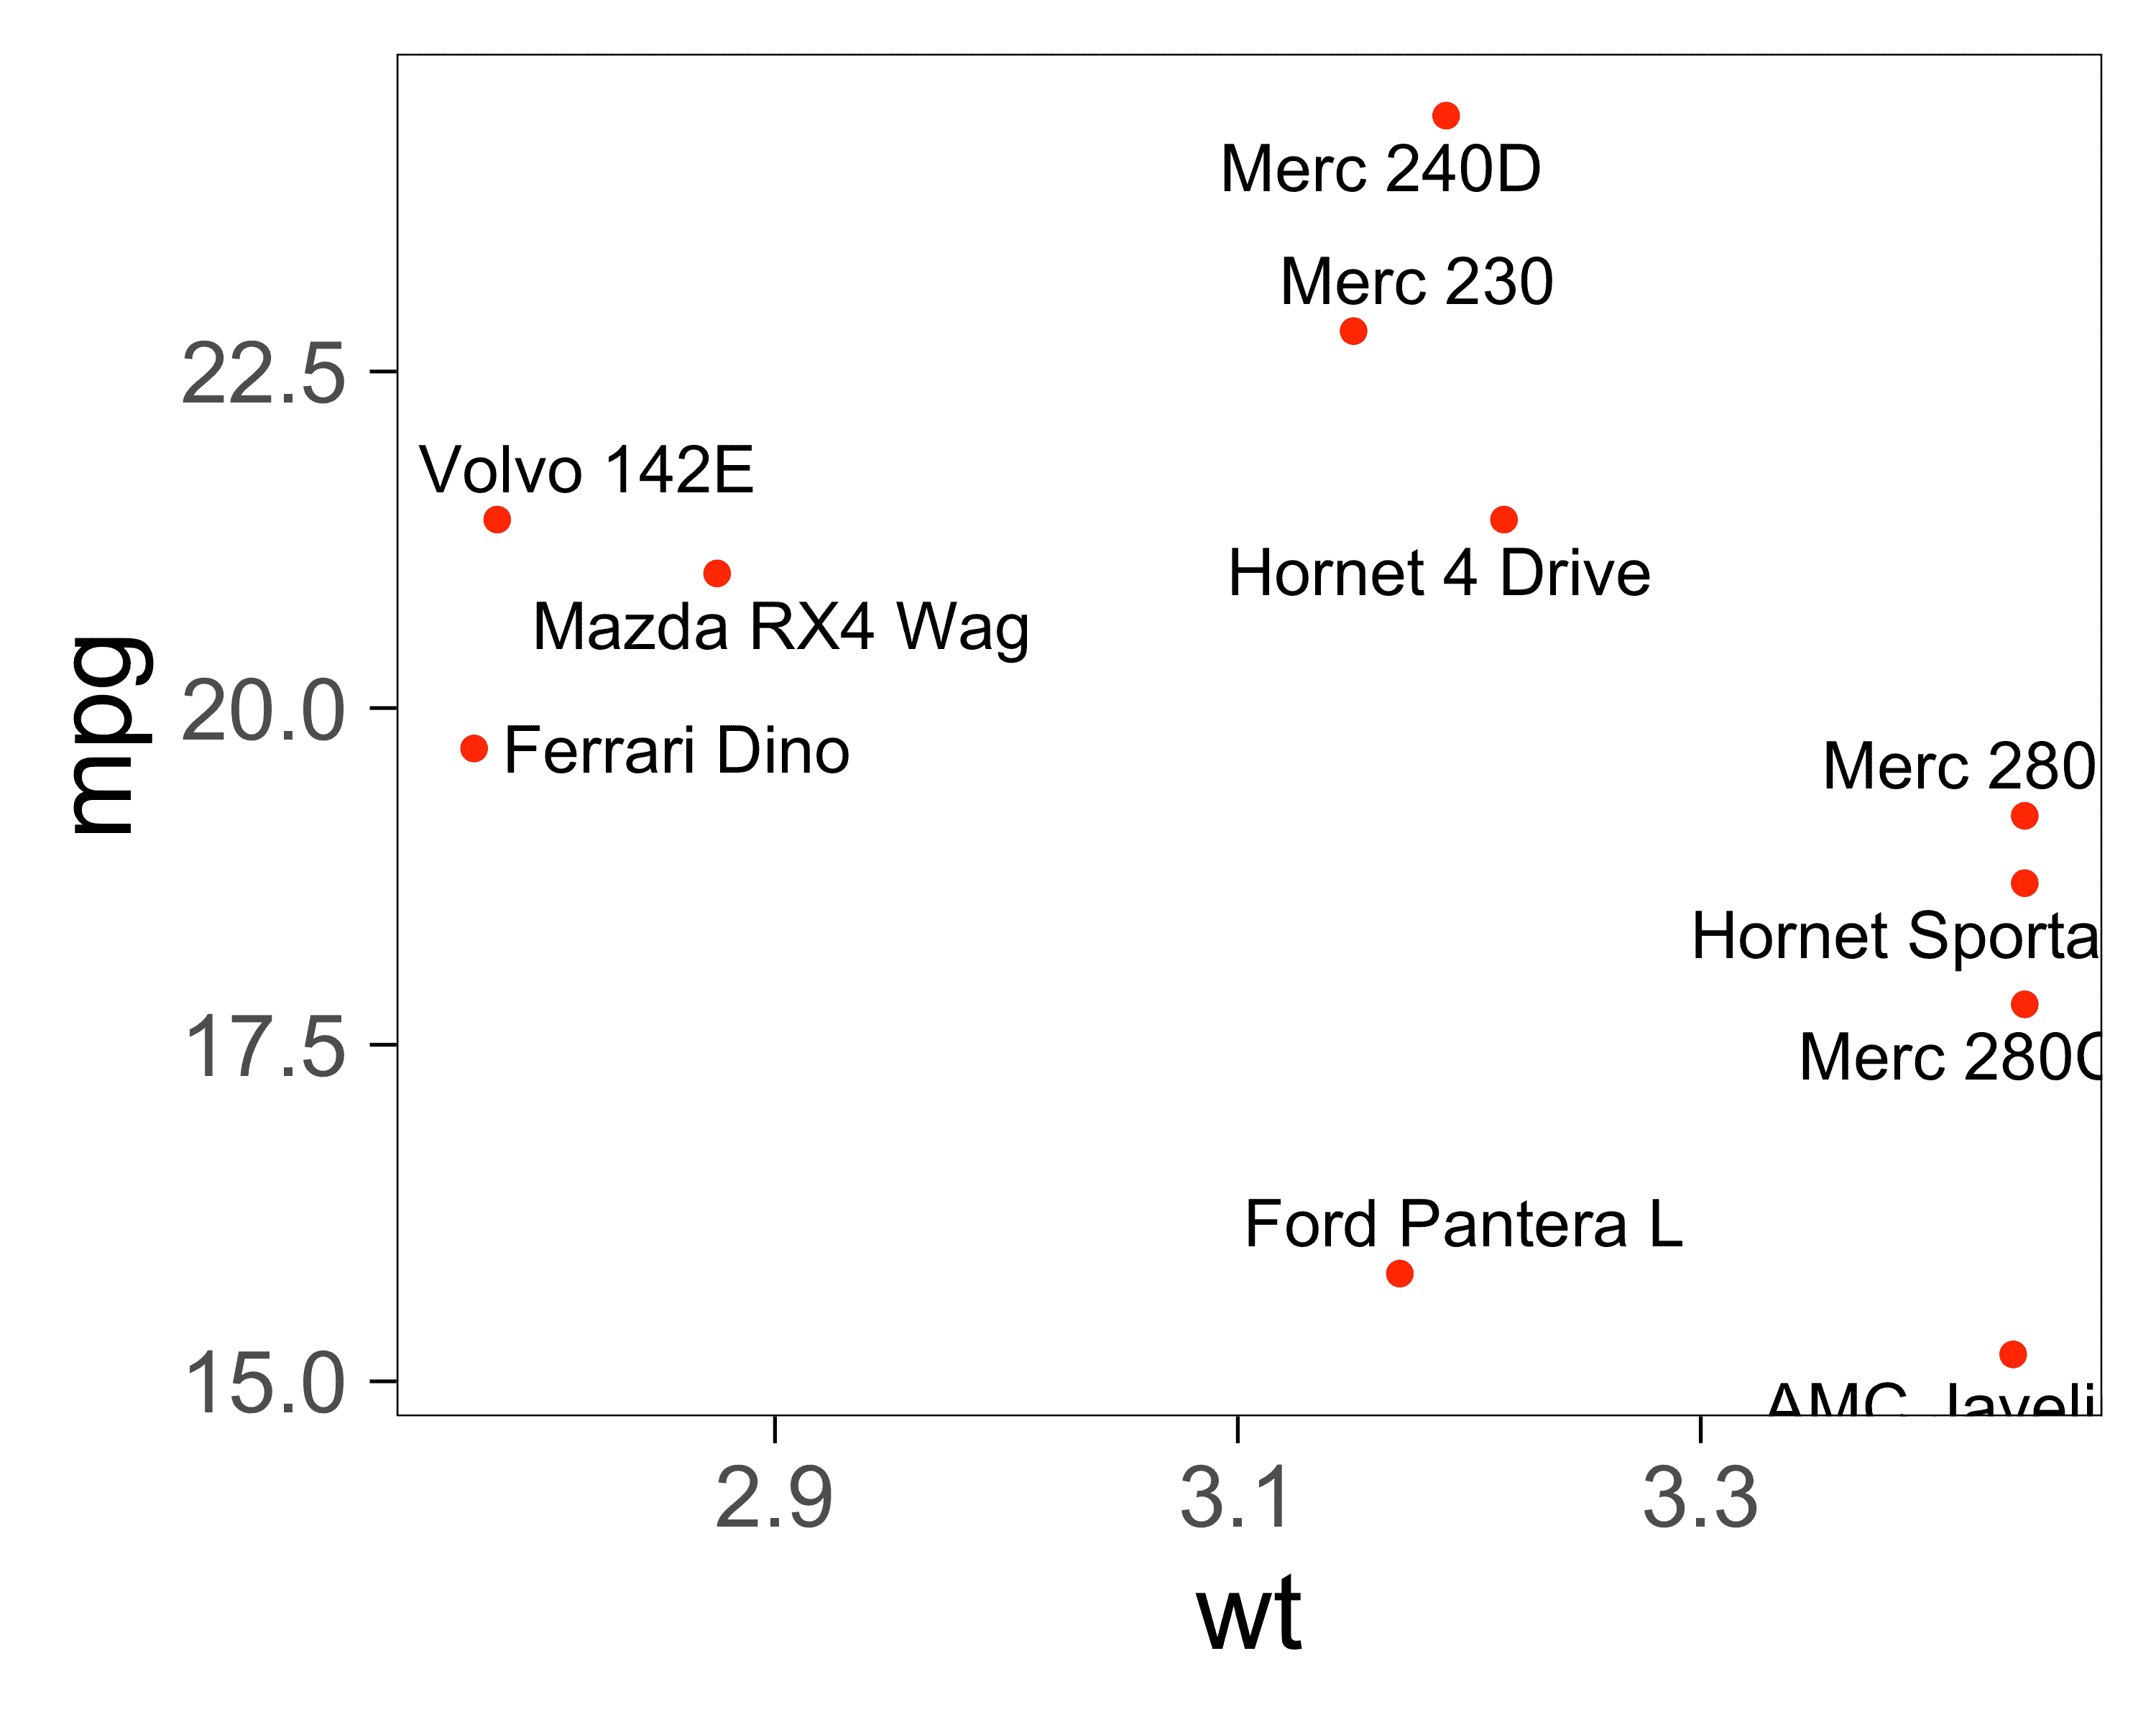
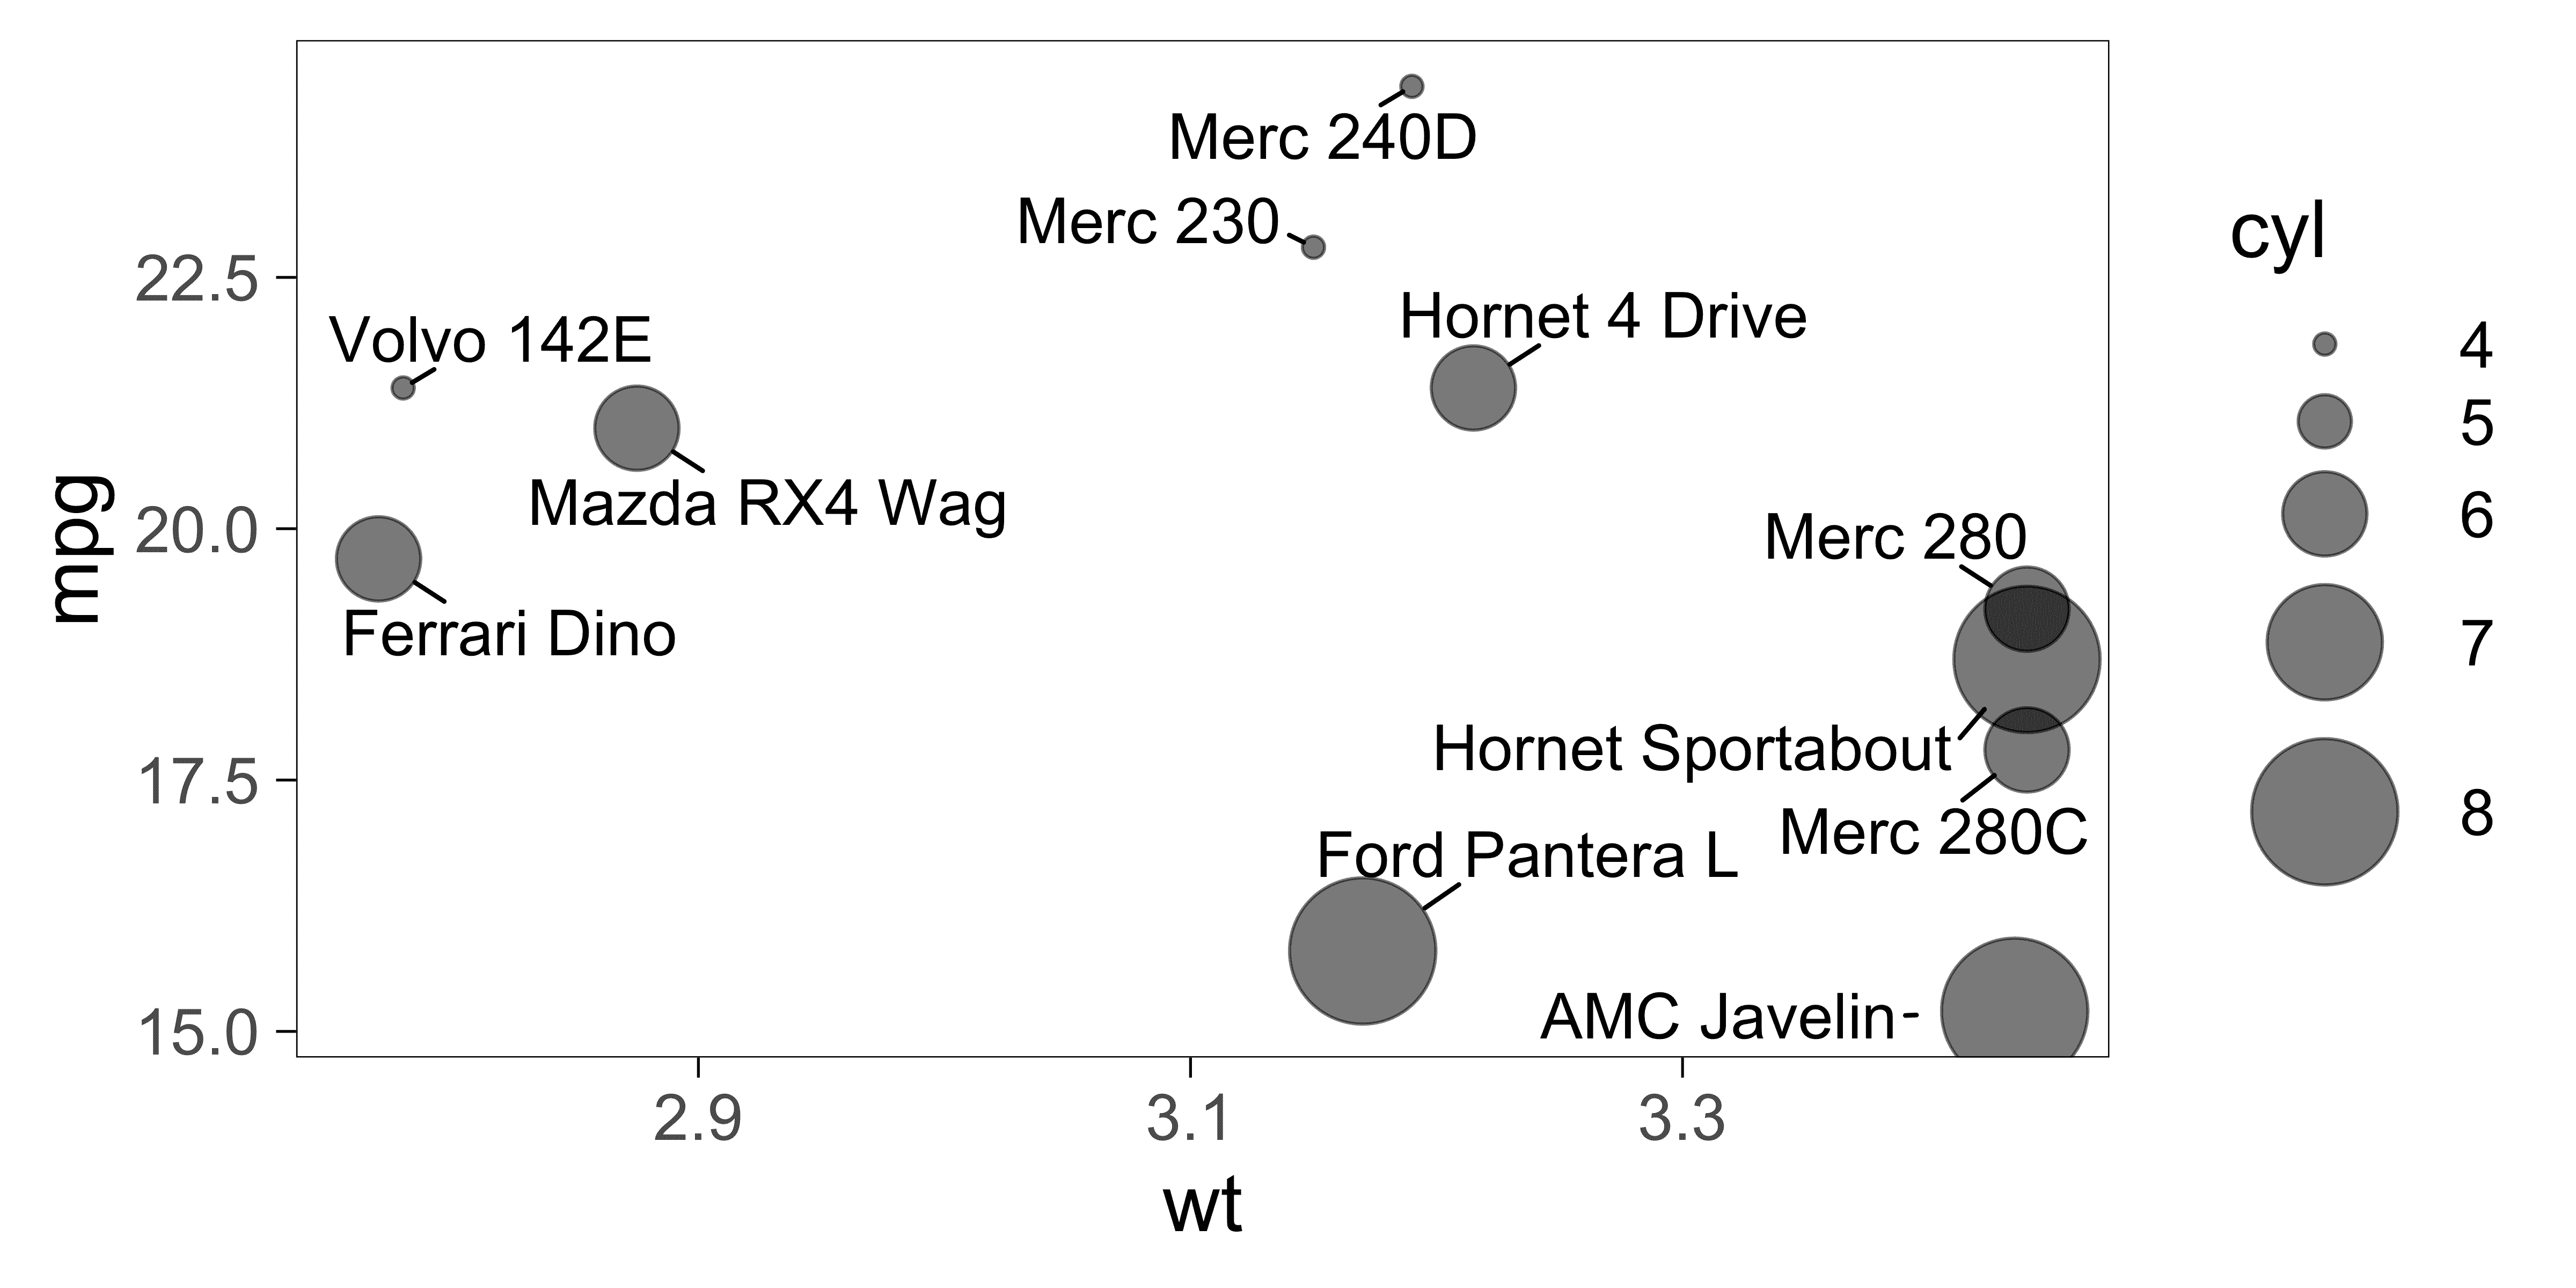
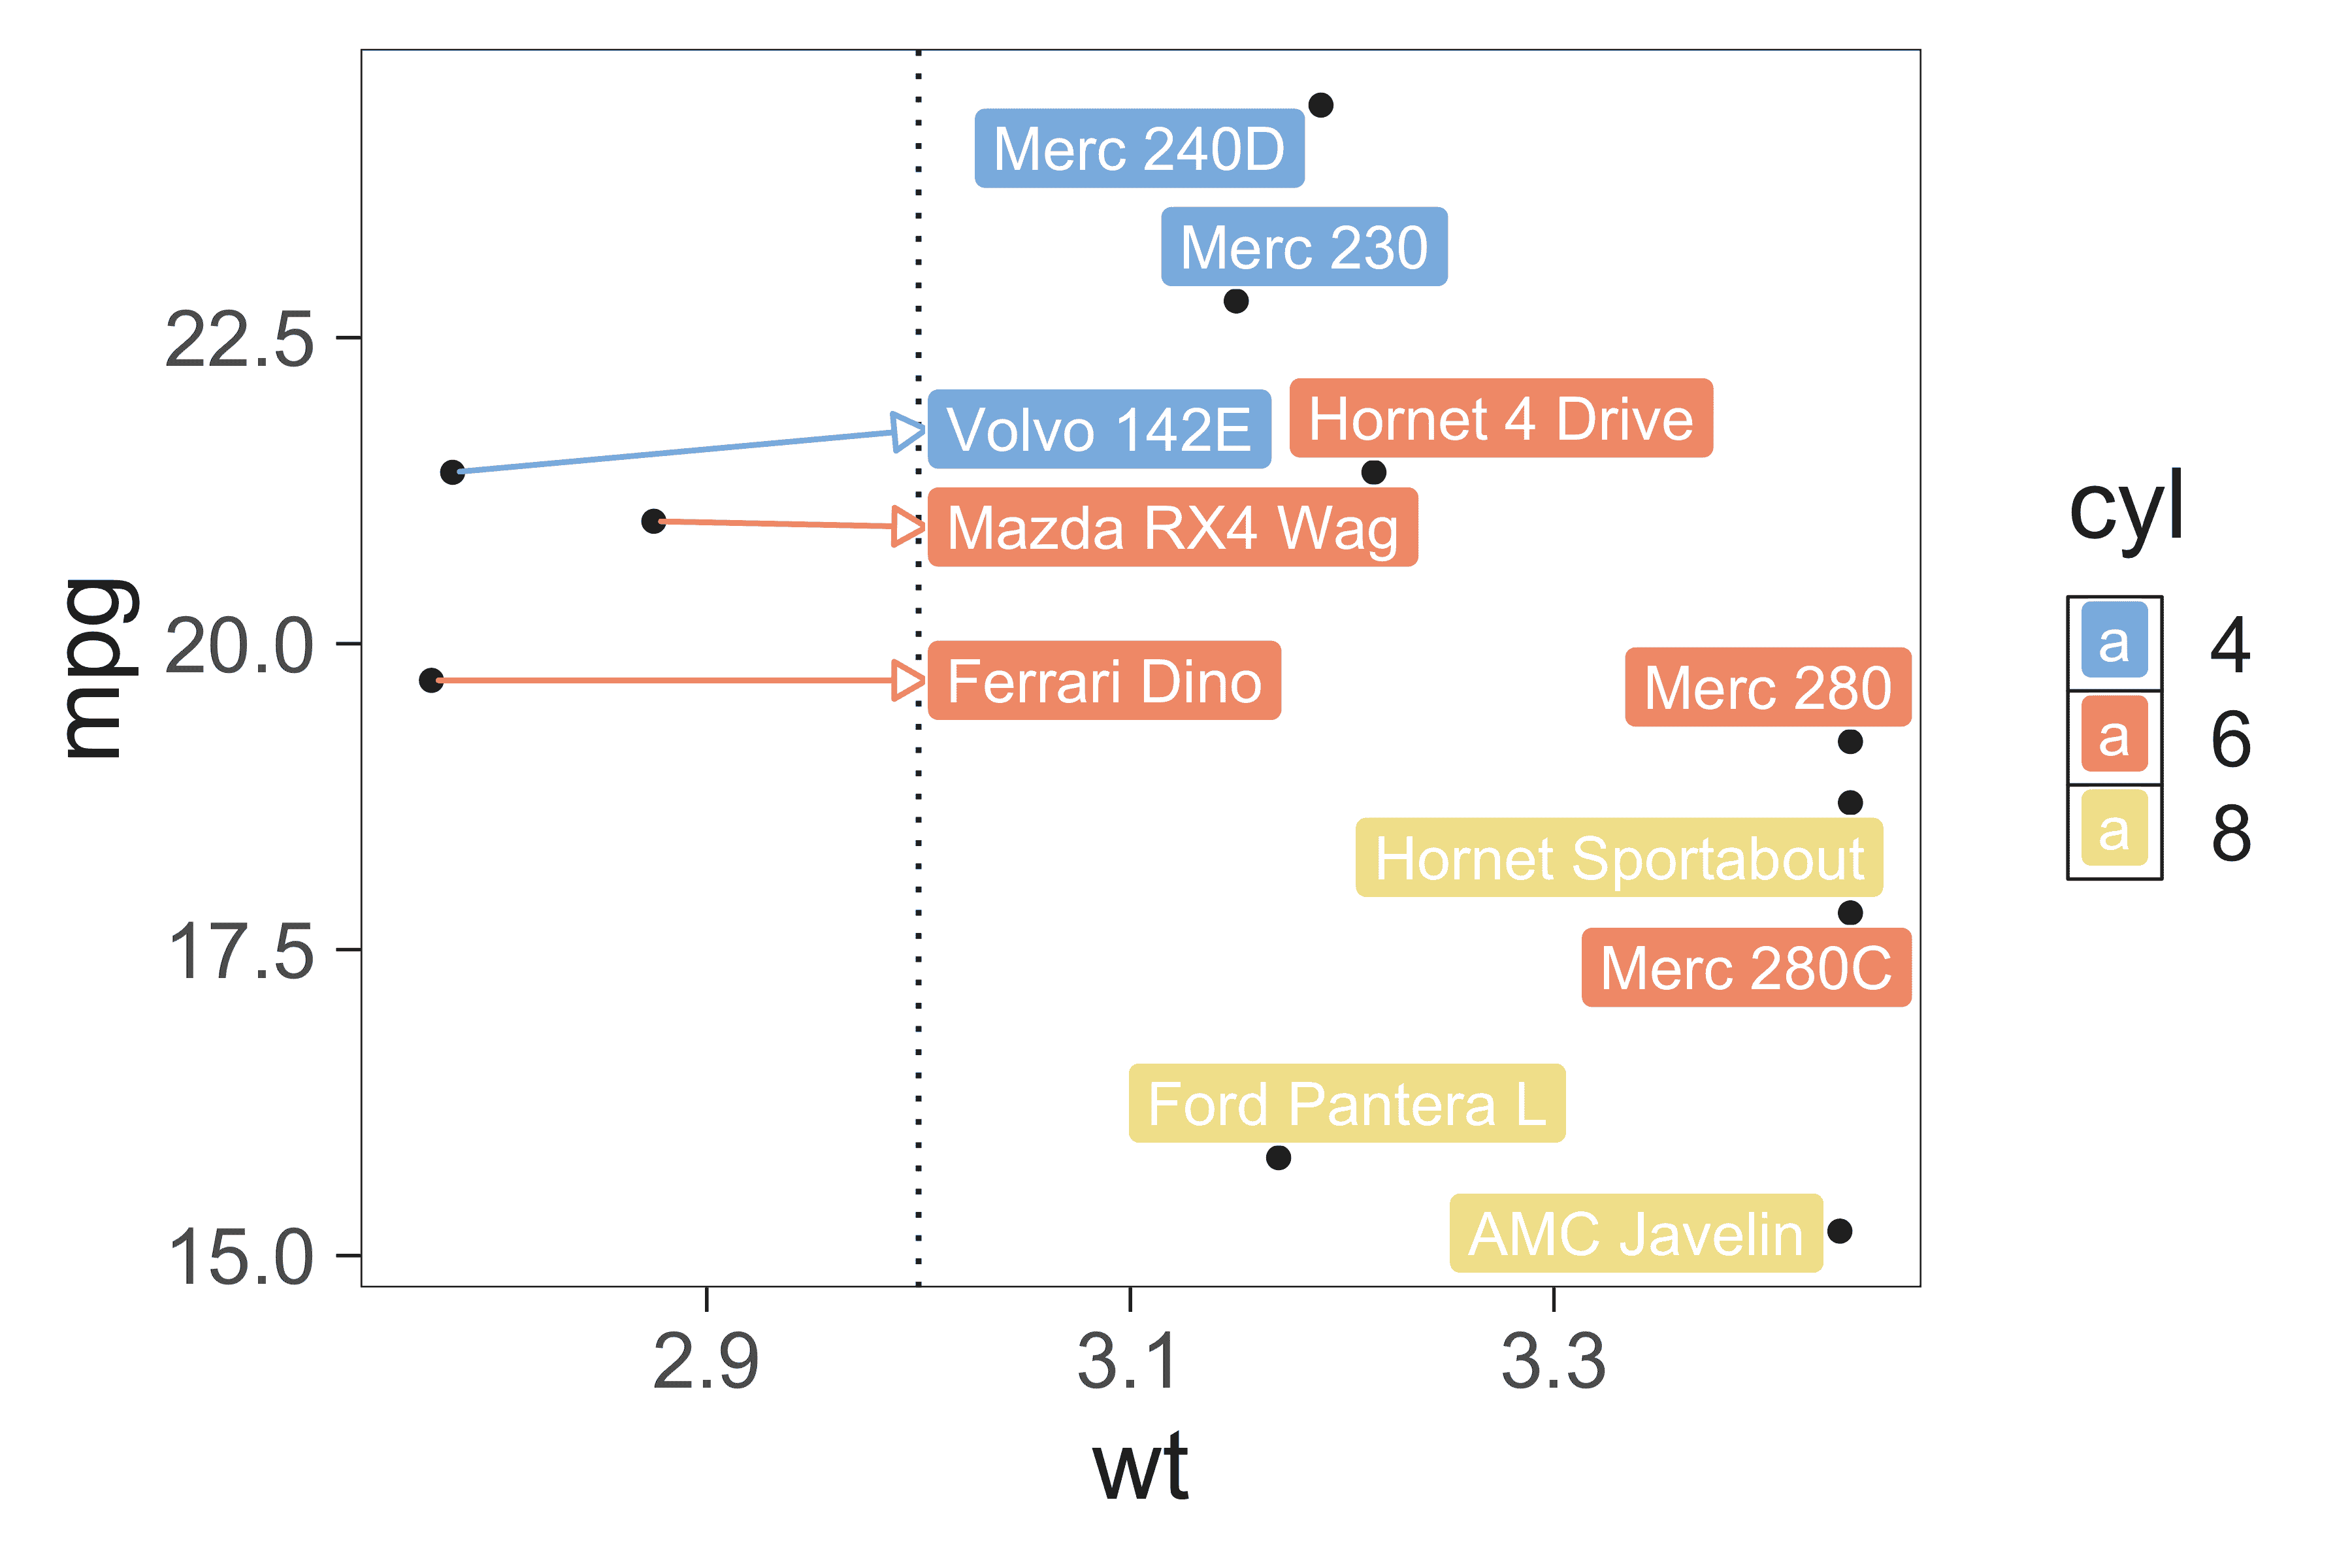
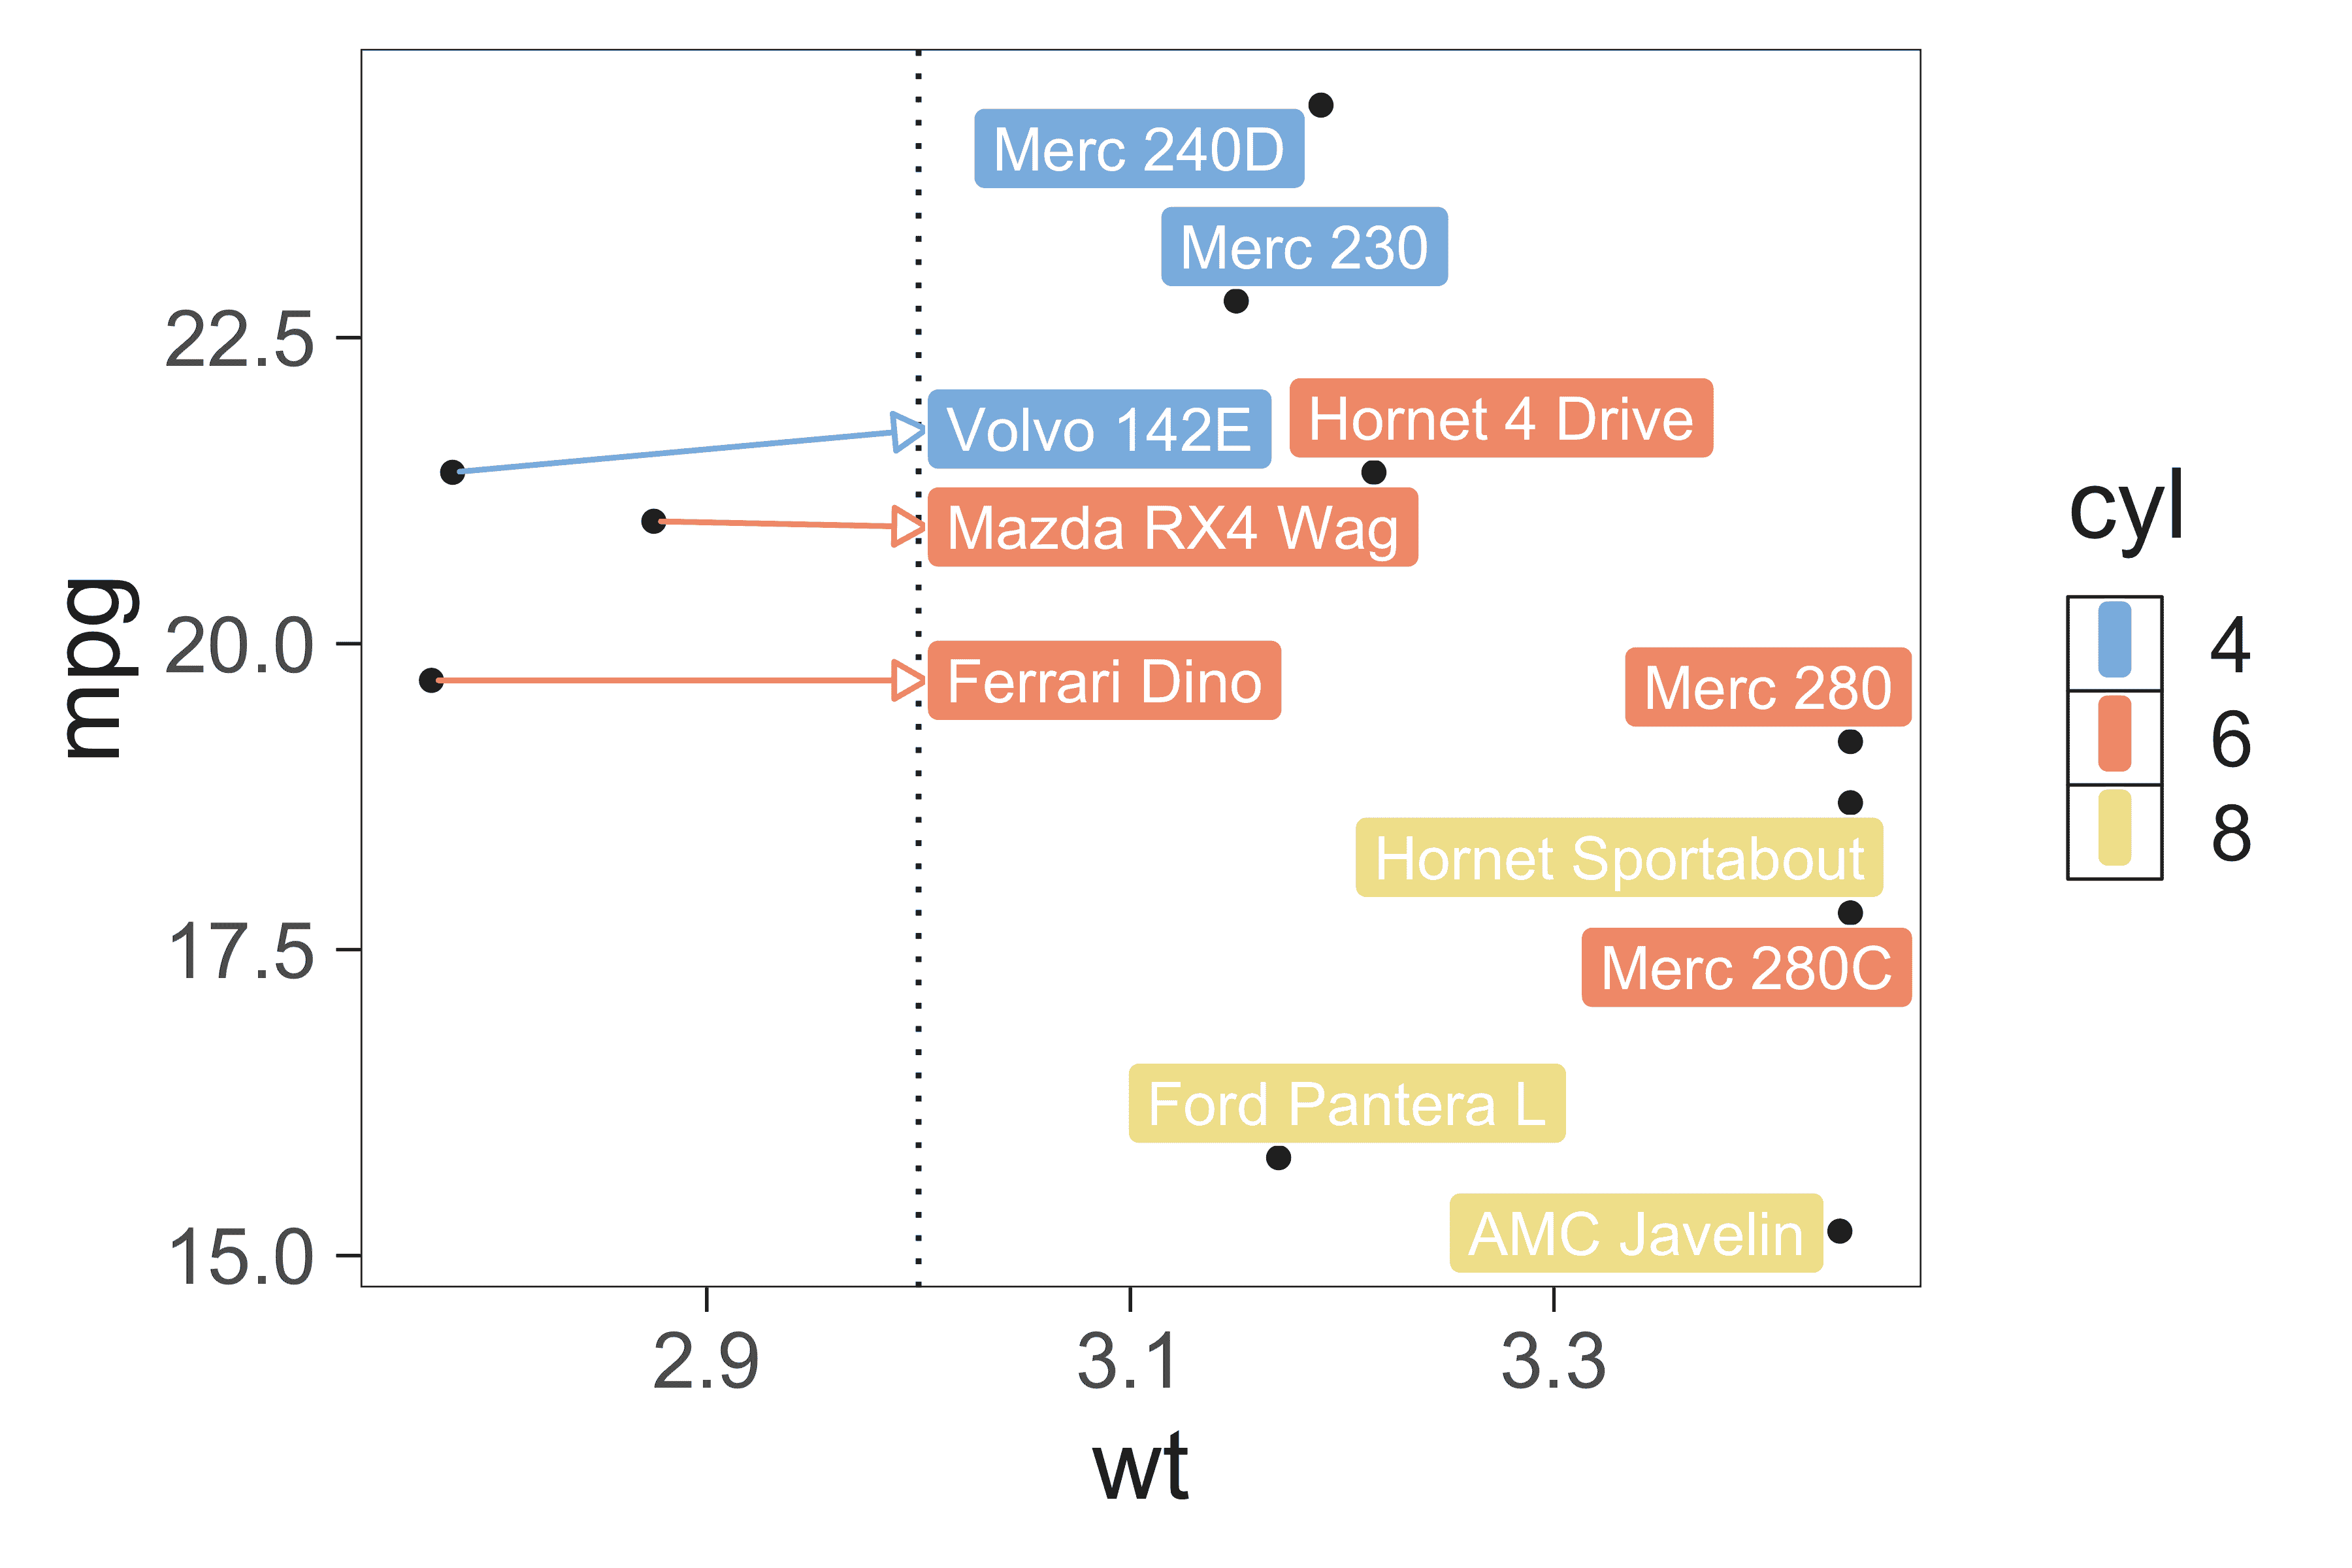
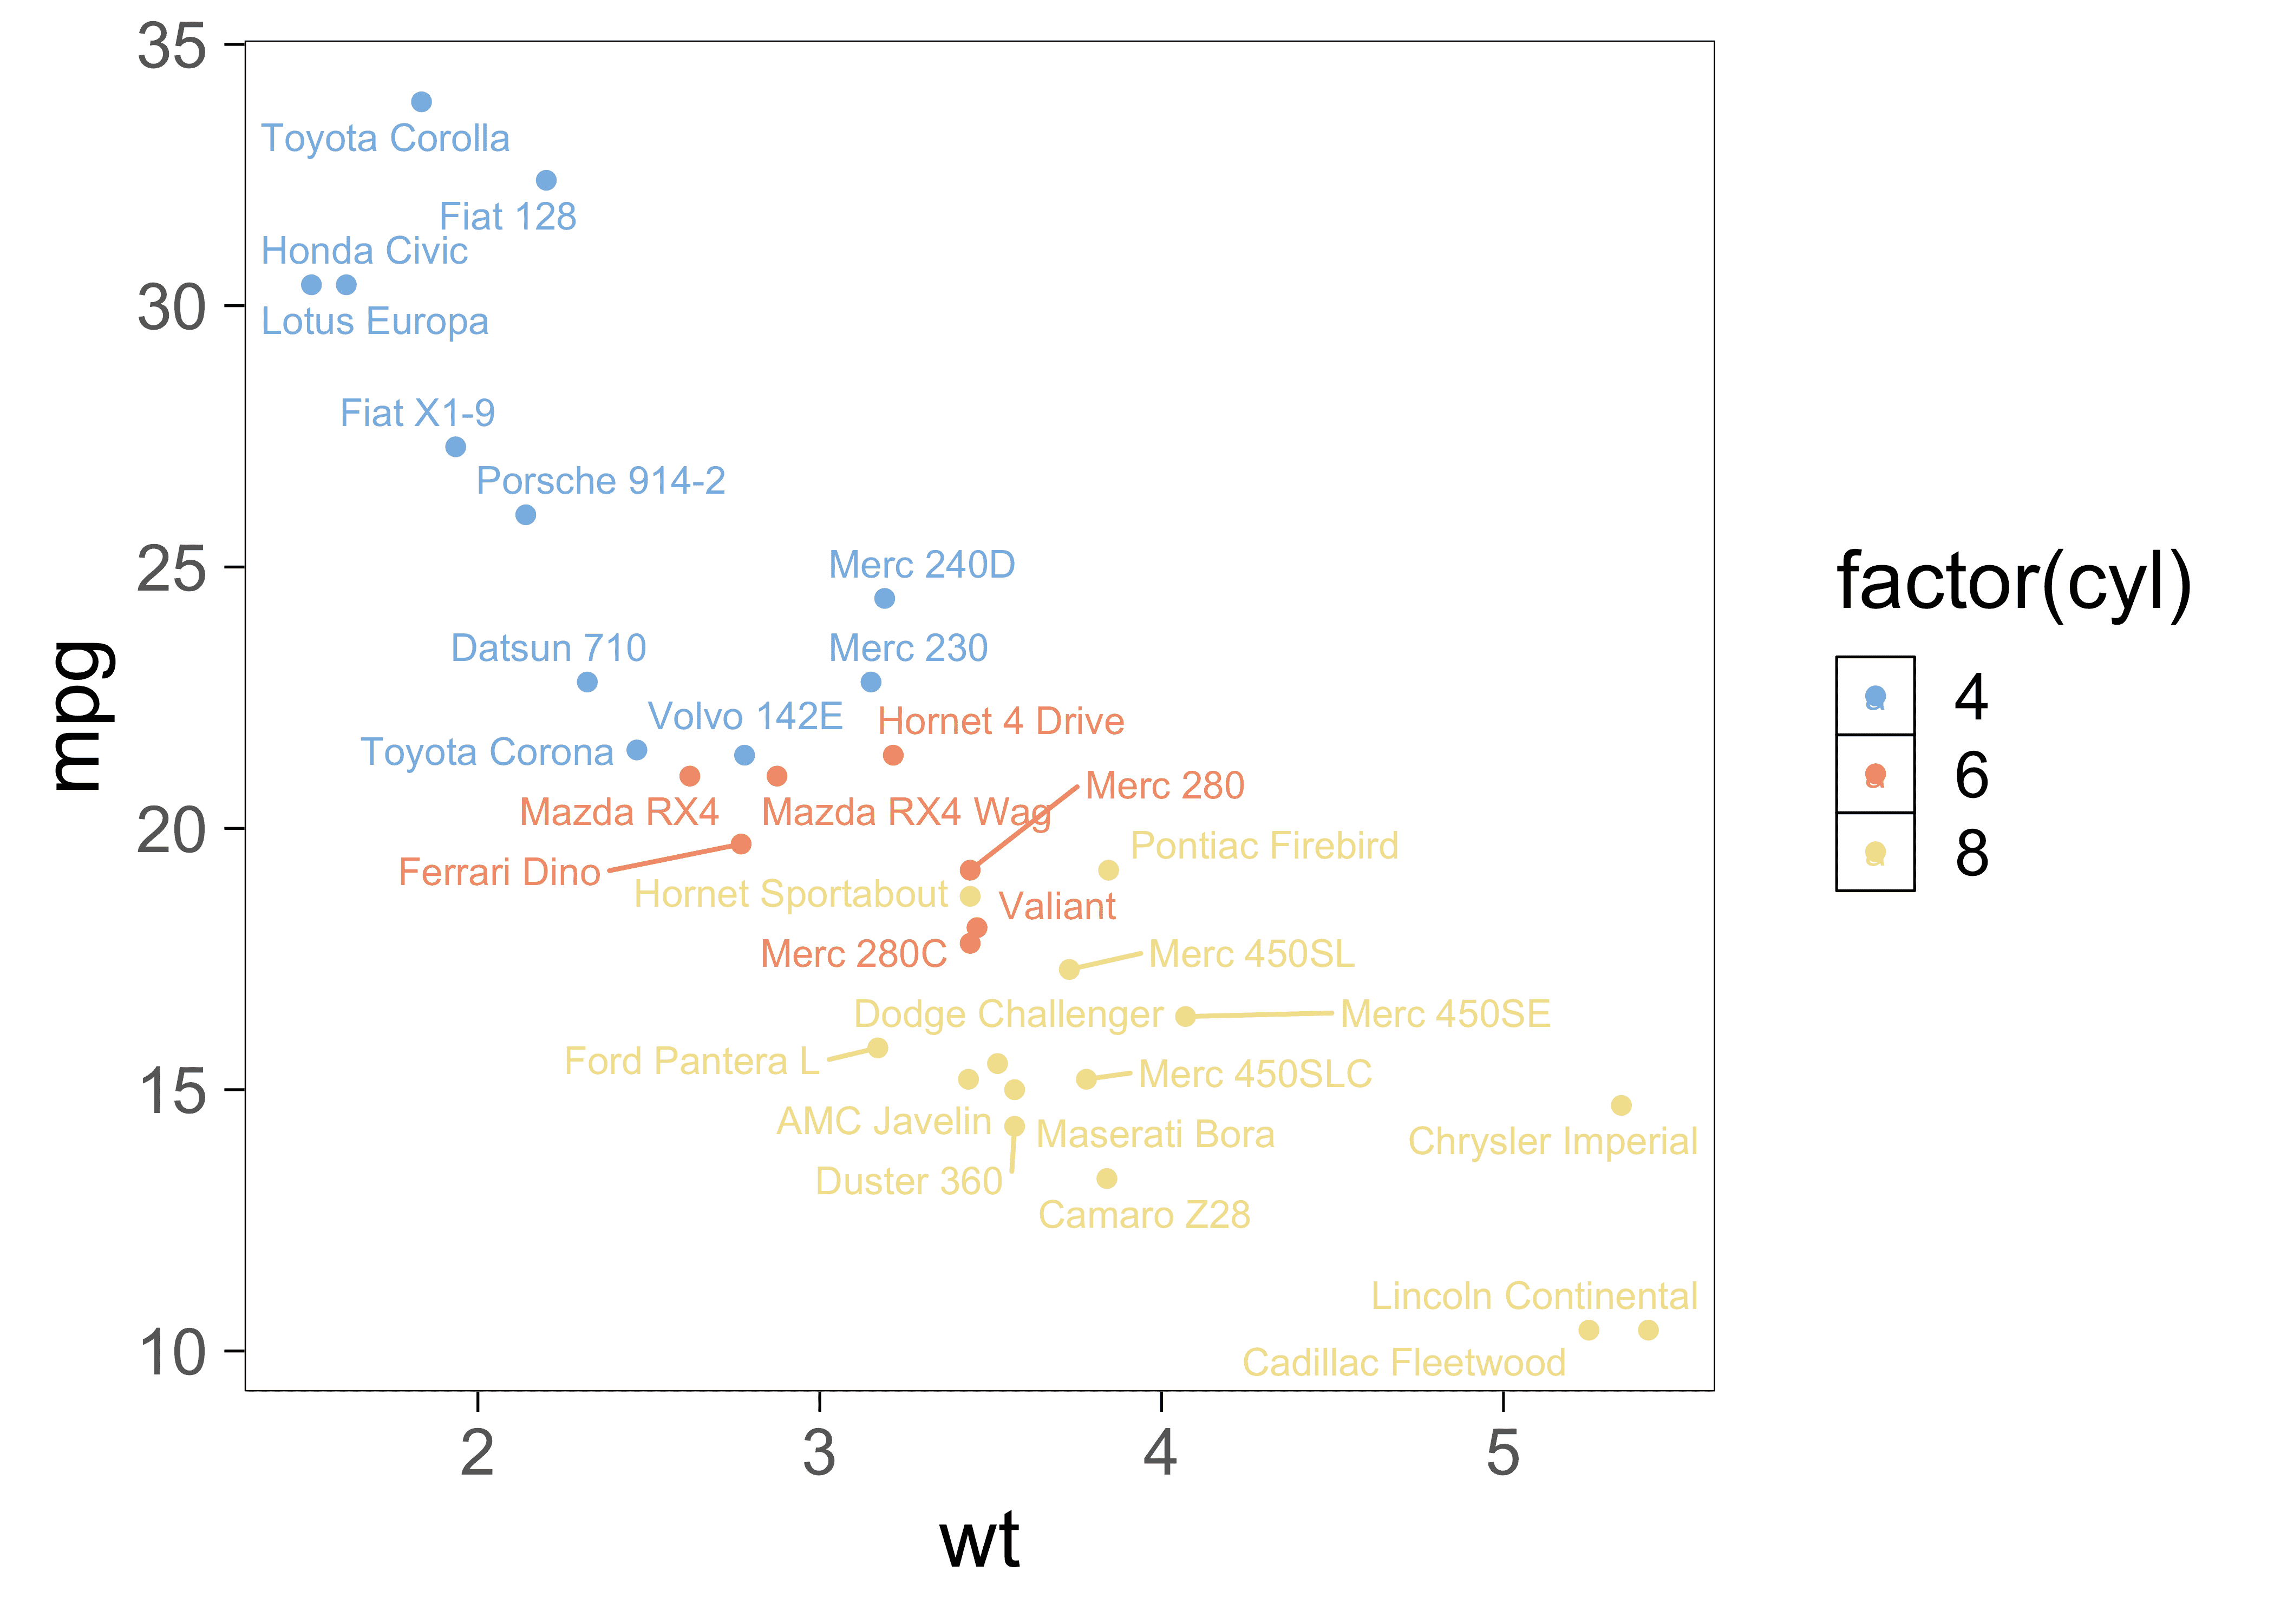
ggrepel provides geoms for ggplot2 to repel overlapping text labels:

  • geom_text_repel()
  • geom_label_repel()

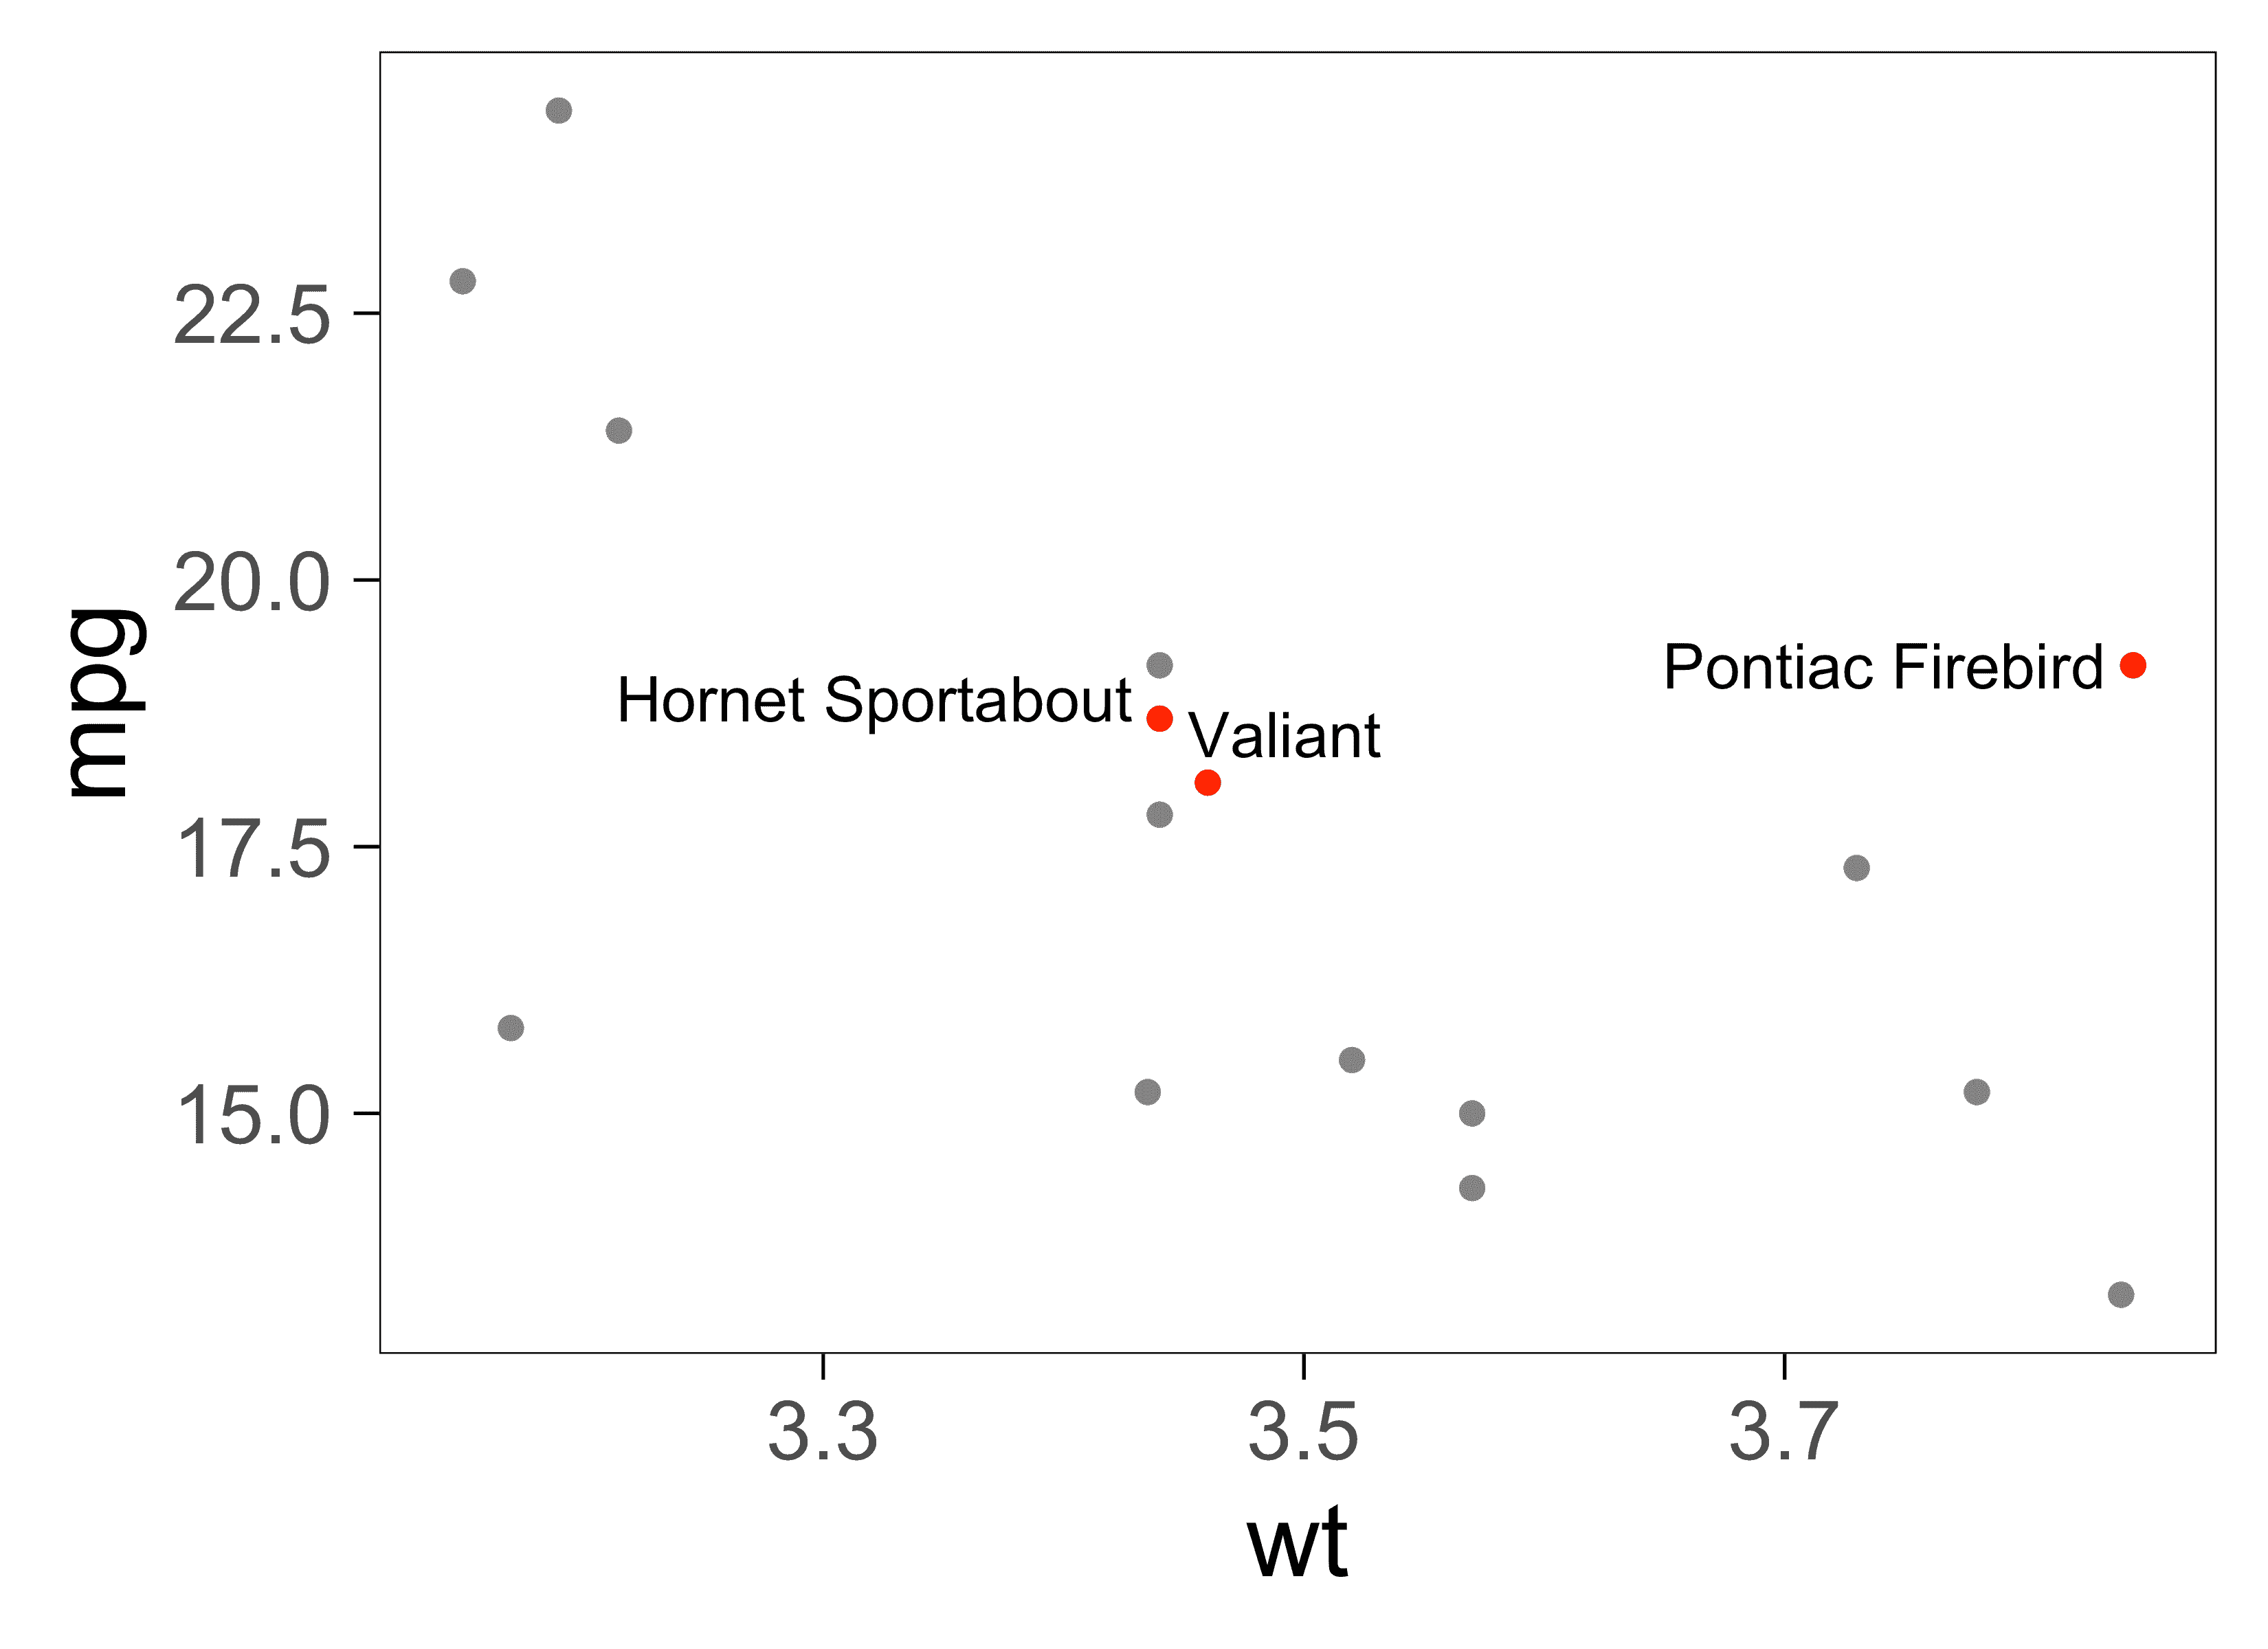
Text labels repel away from each other, away from data points, and away from edges of the plotting area.
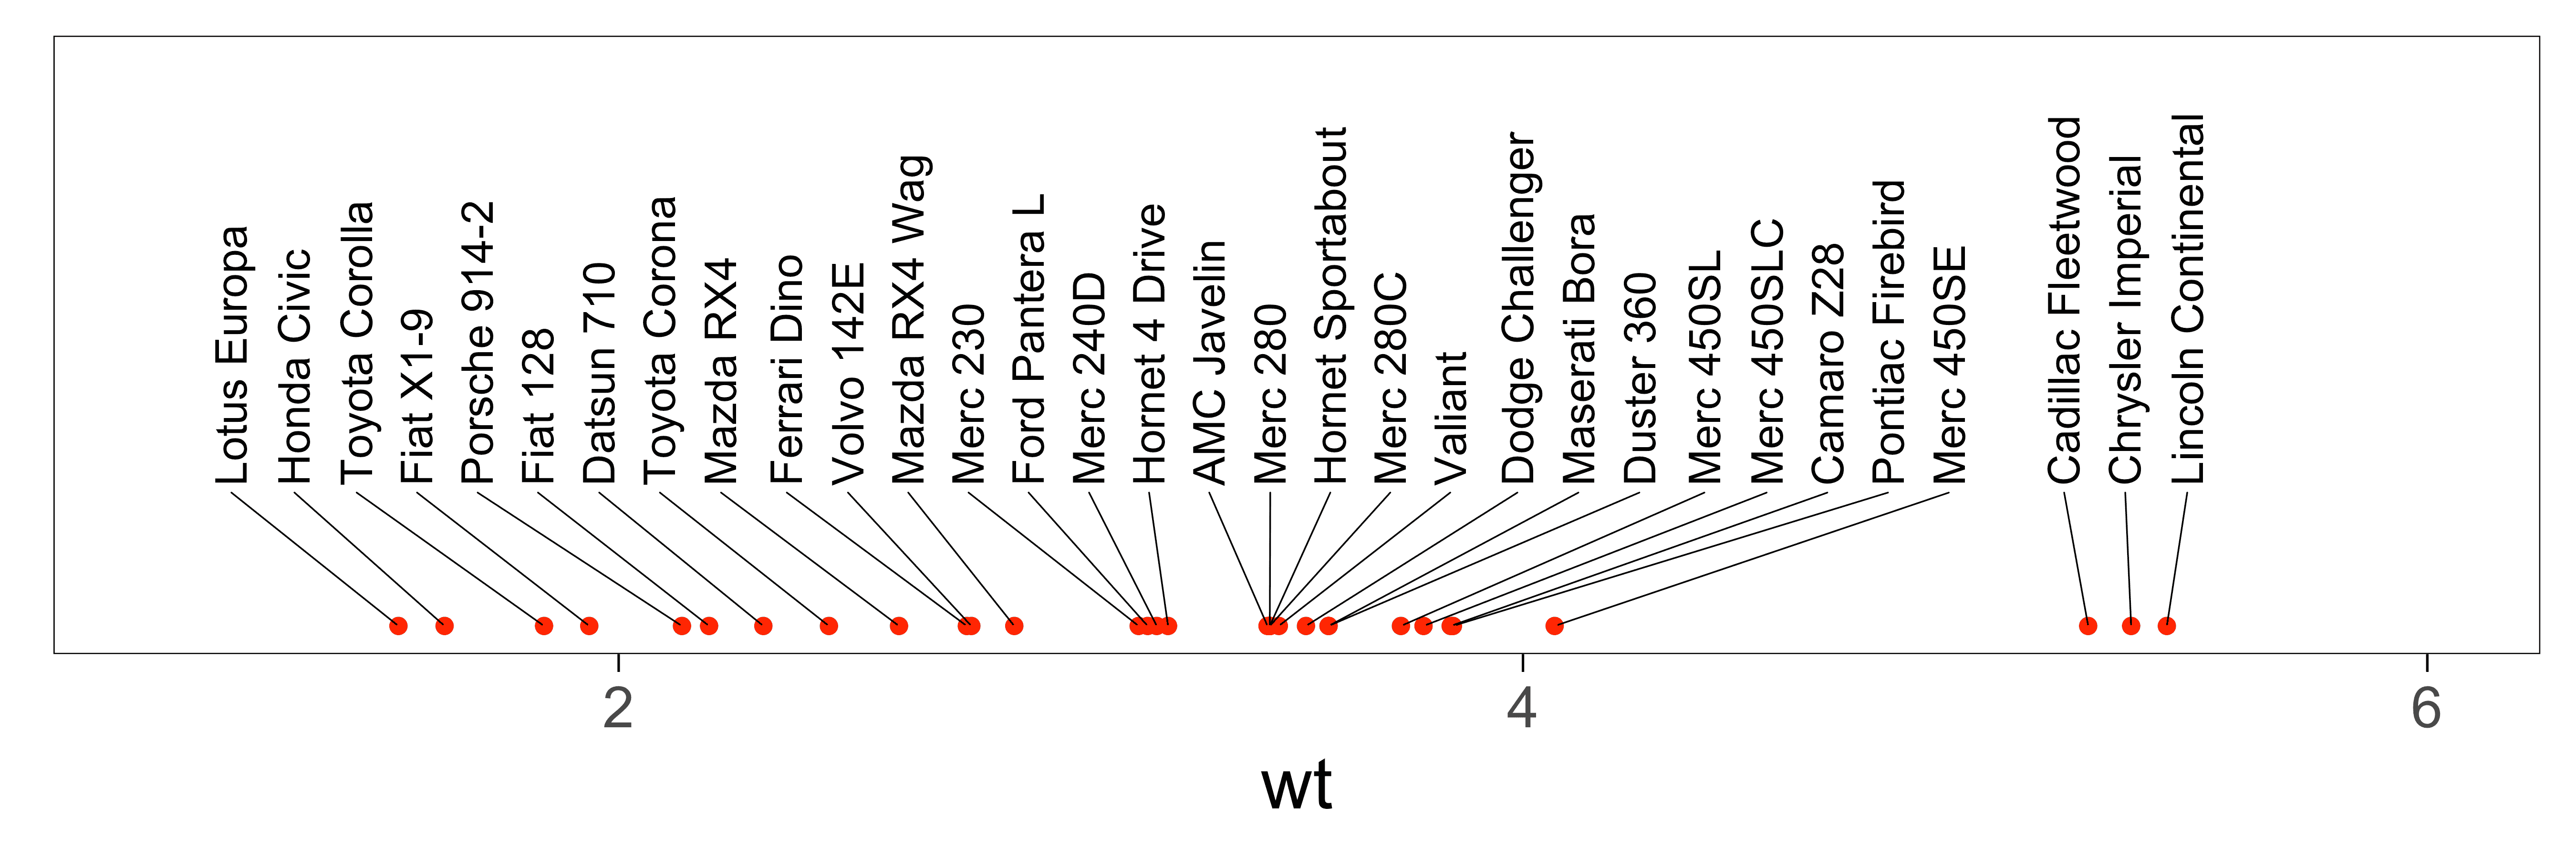
library(ggrepel)
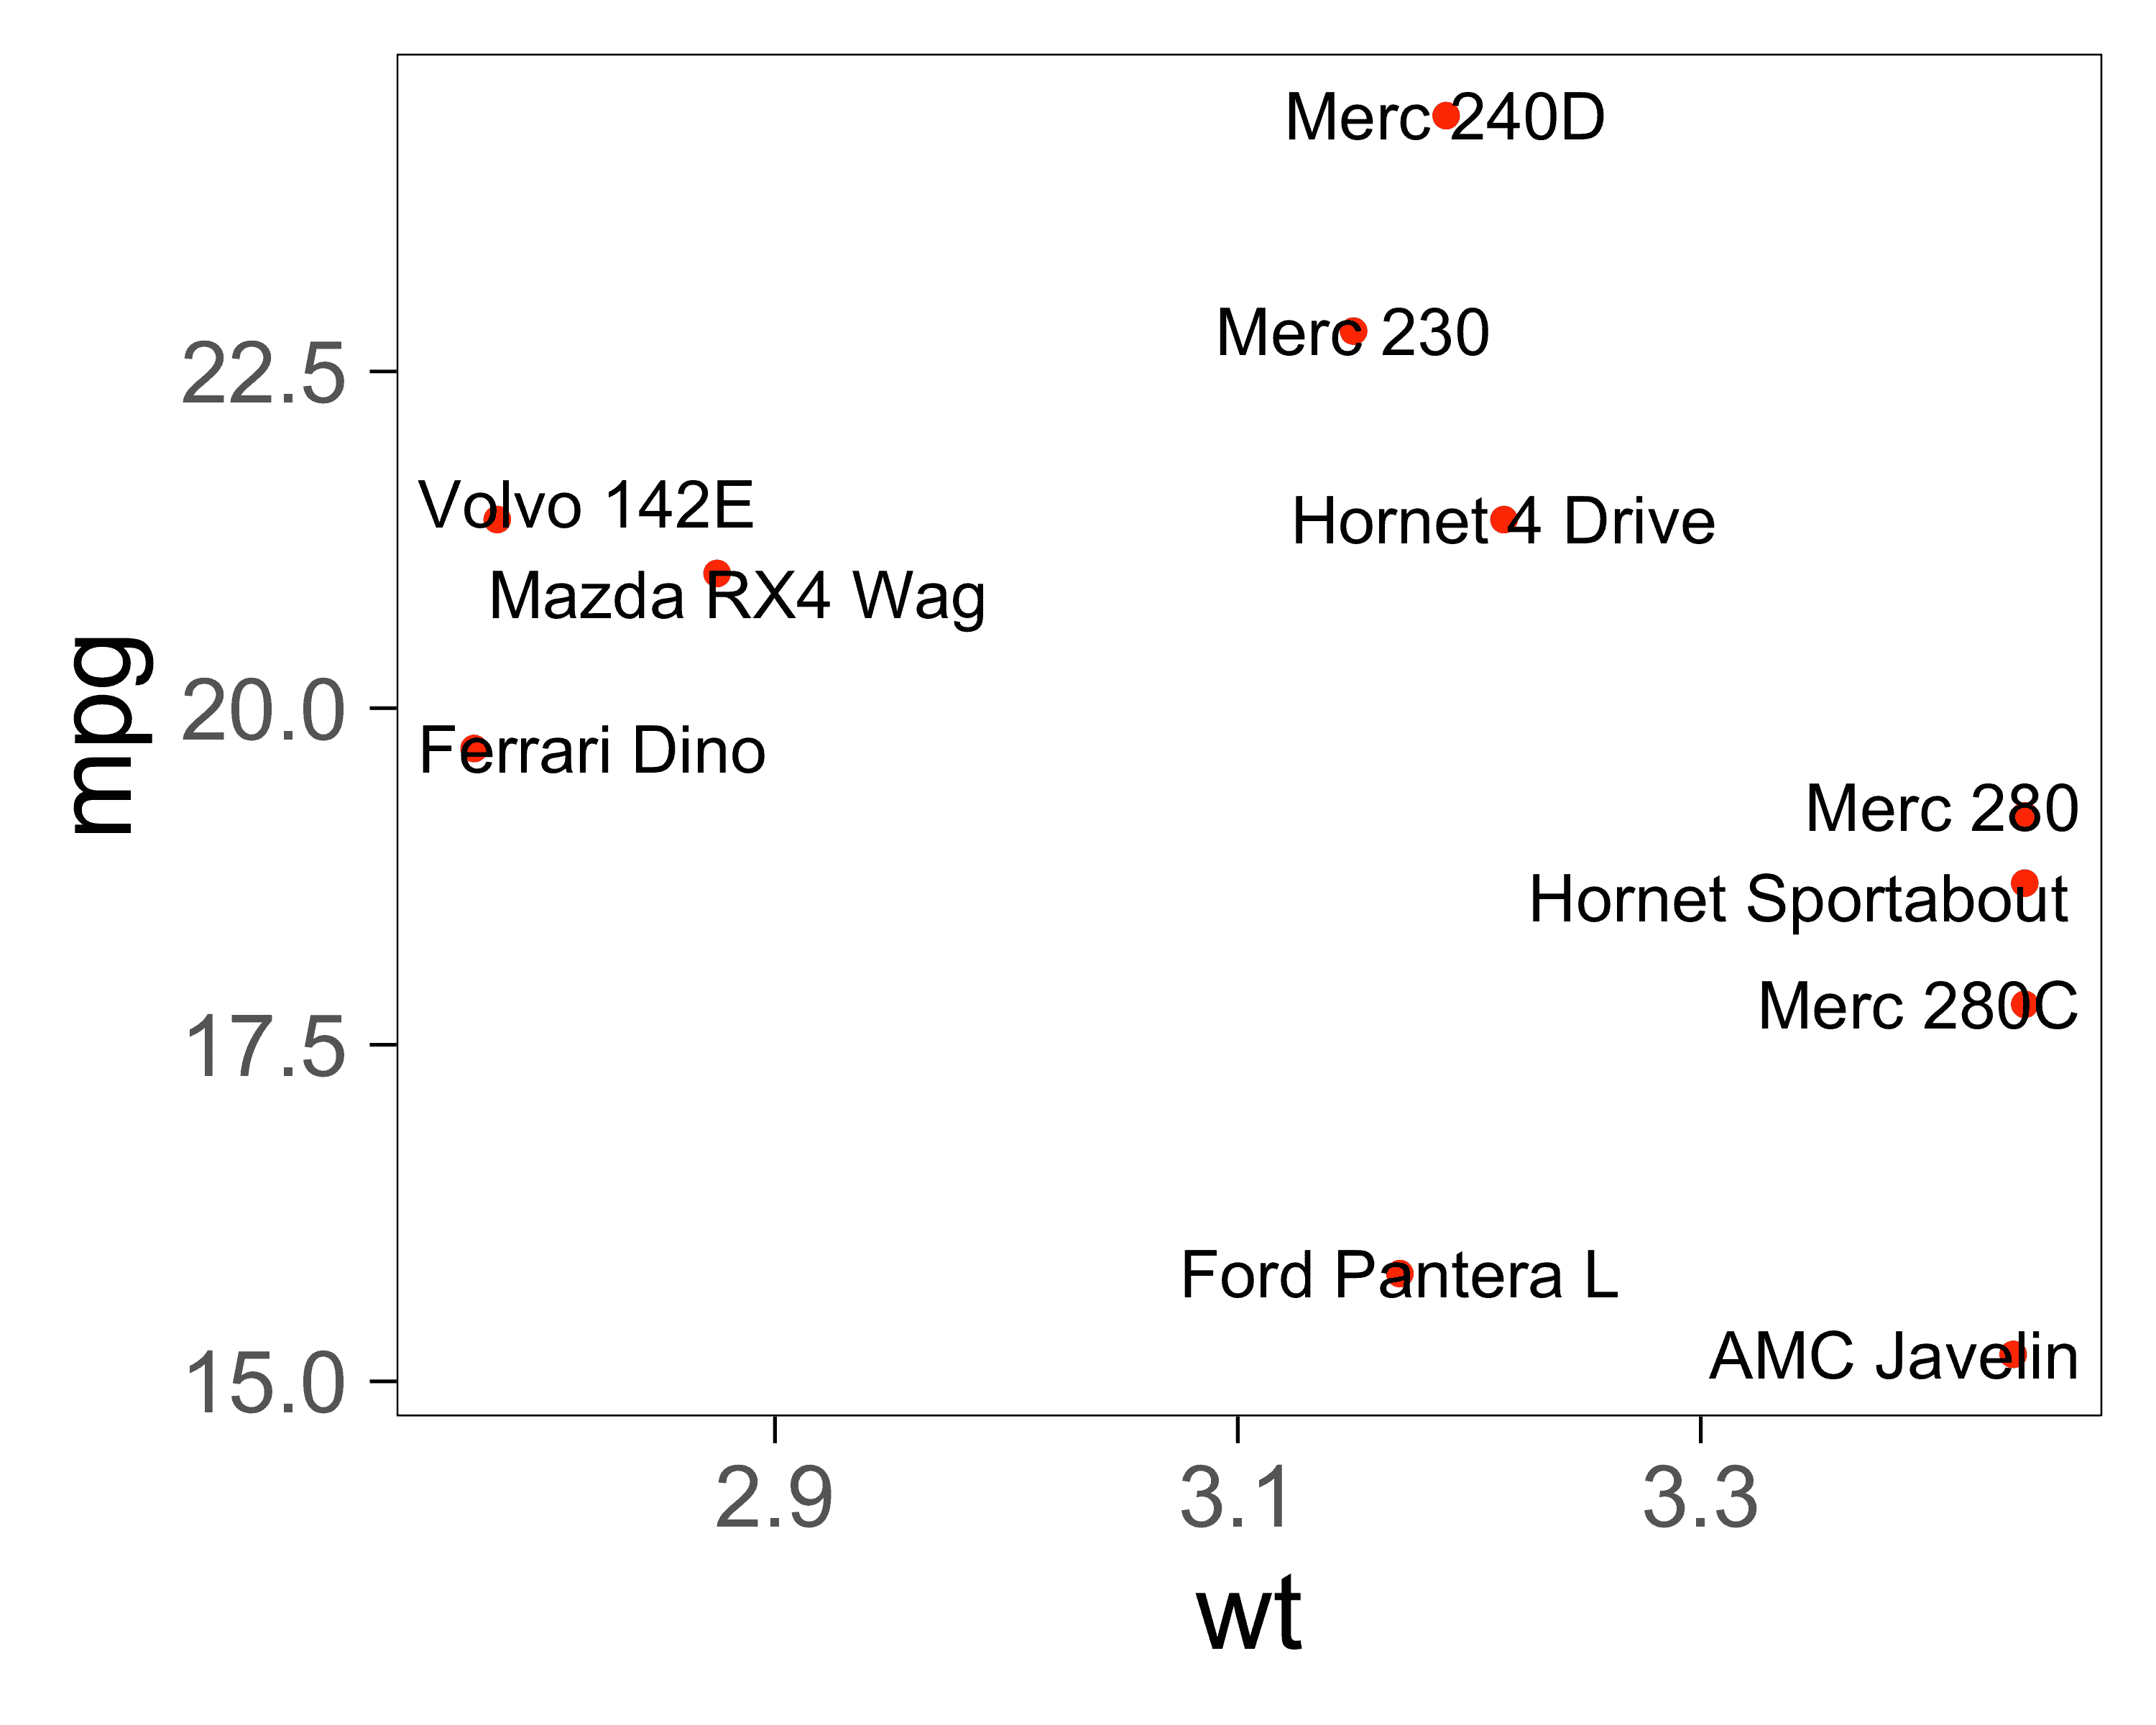
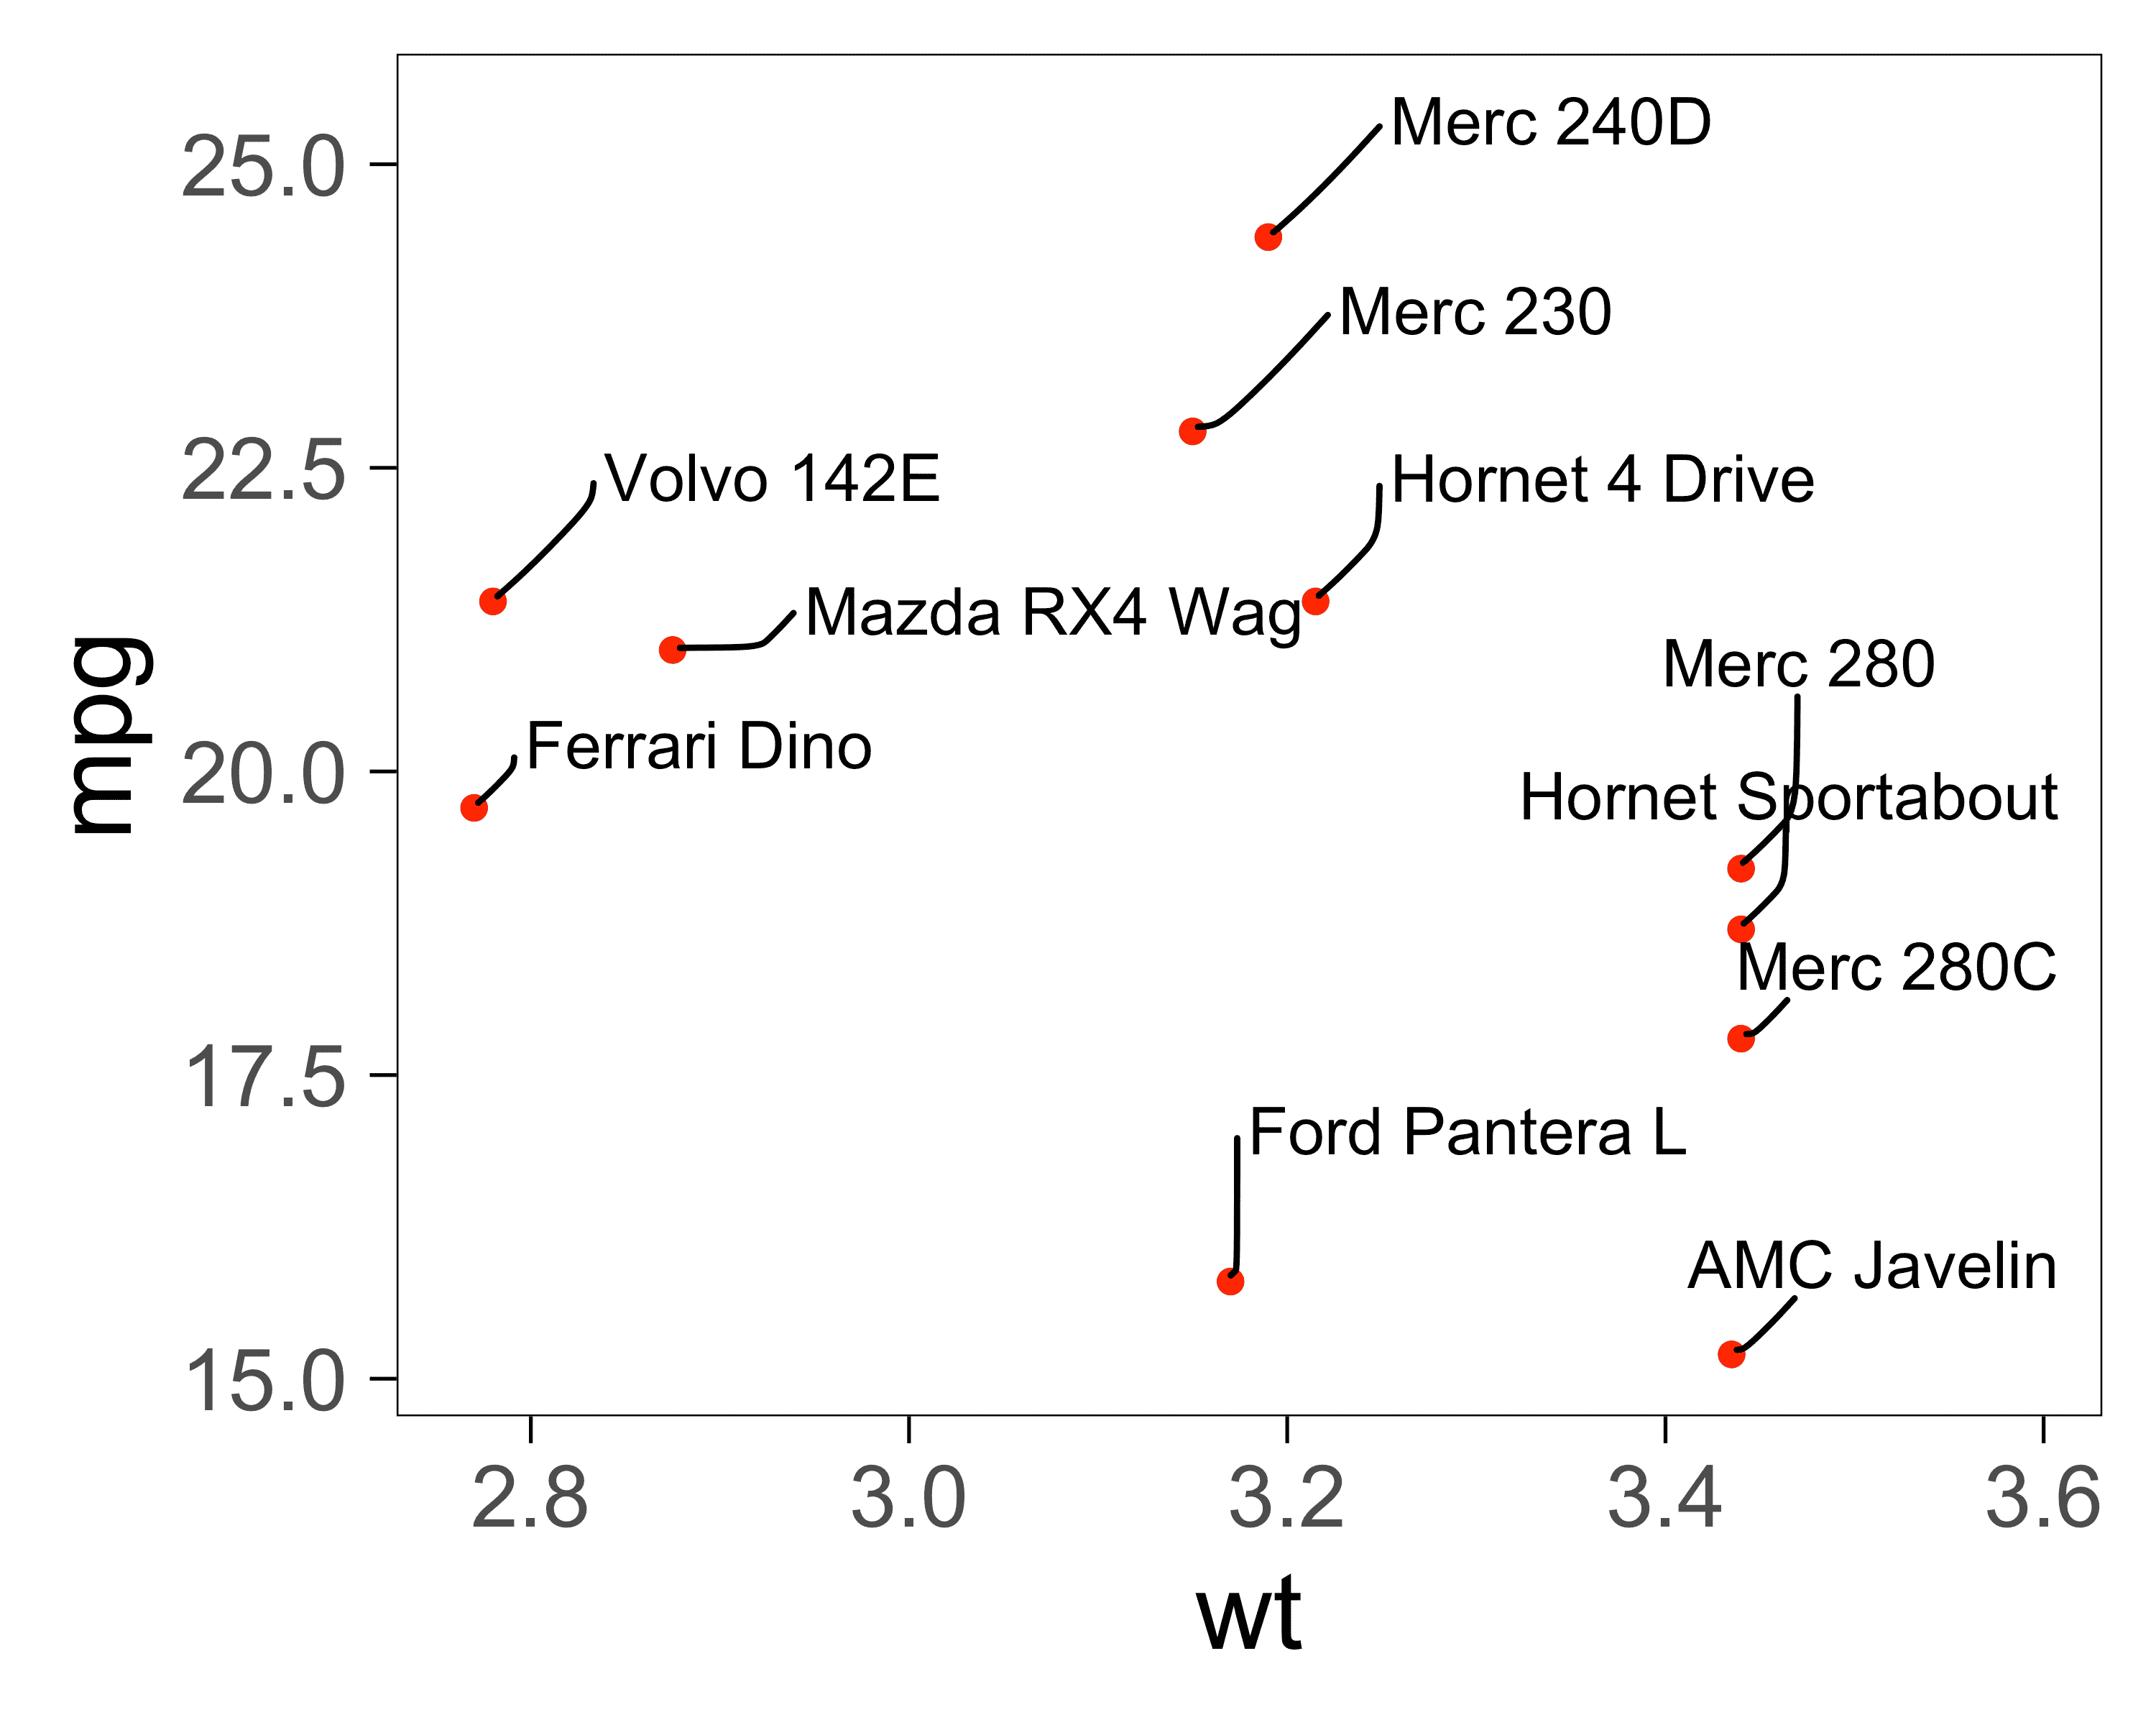
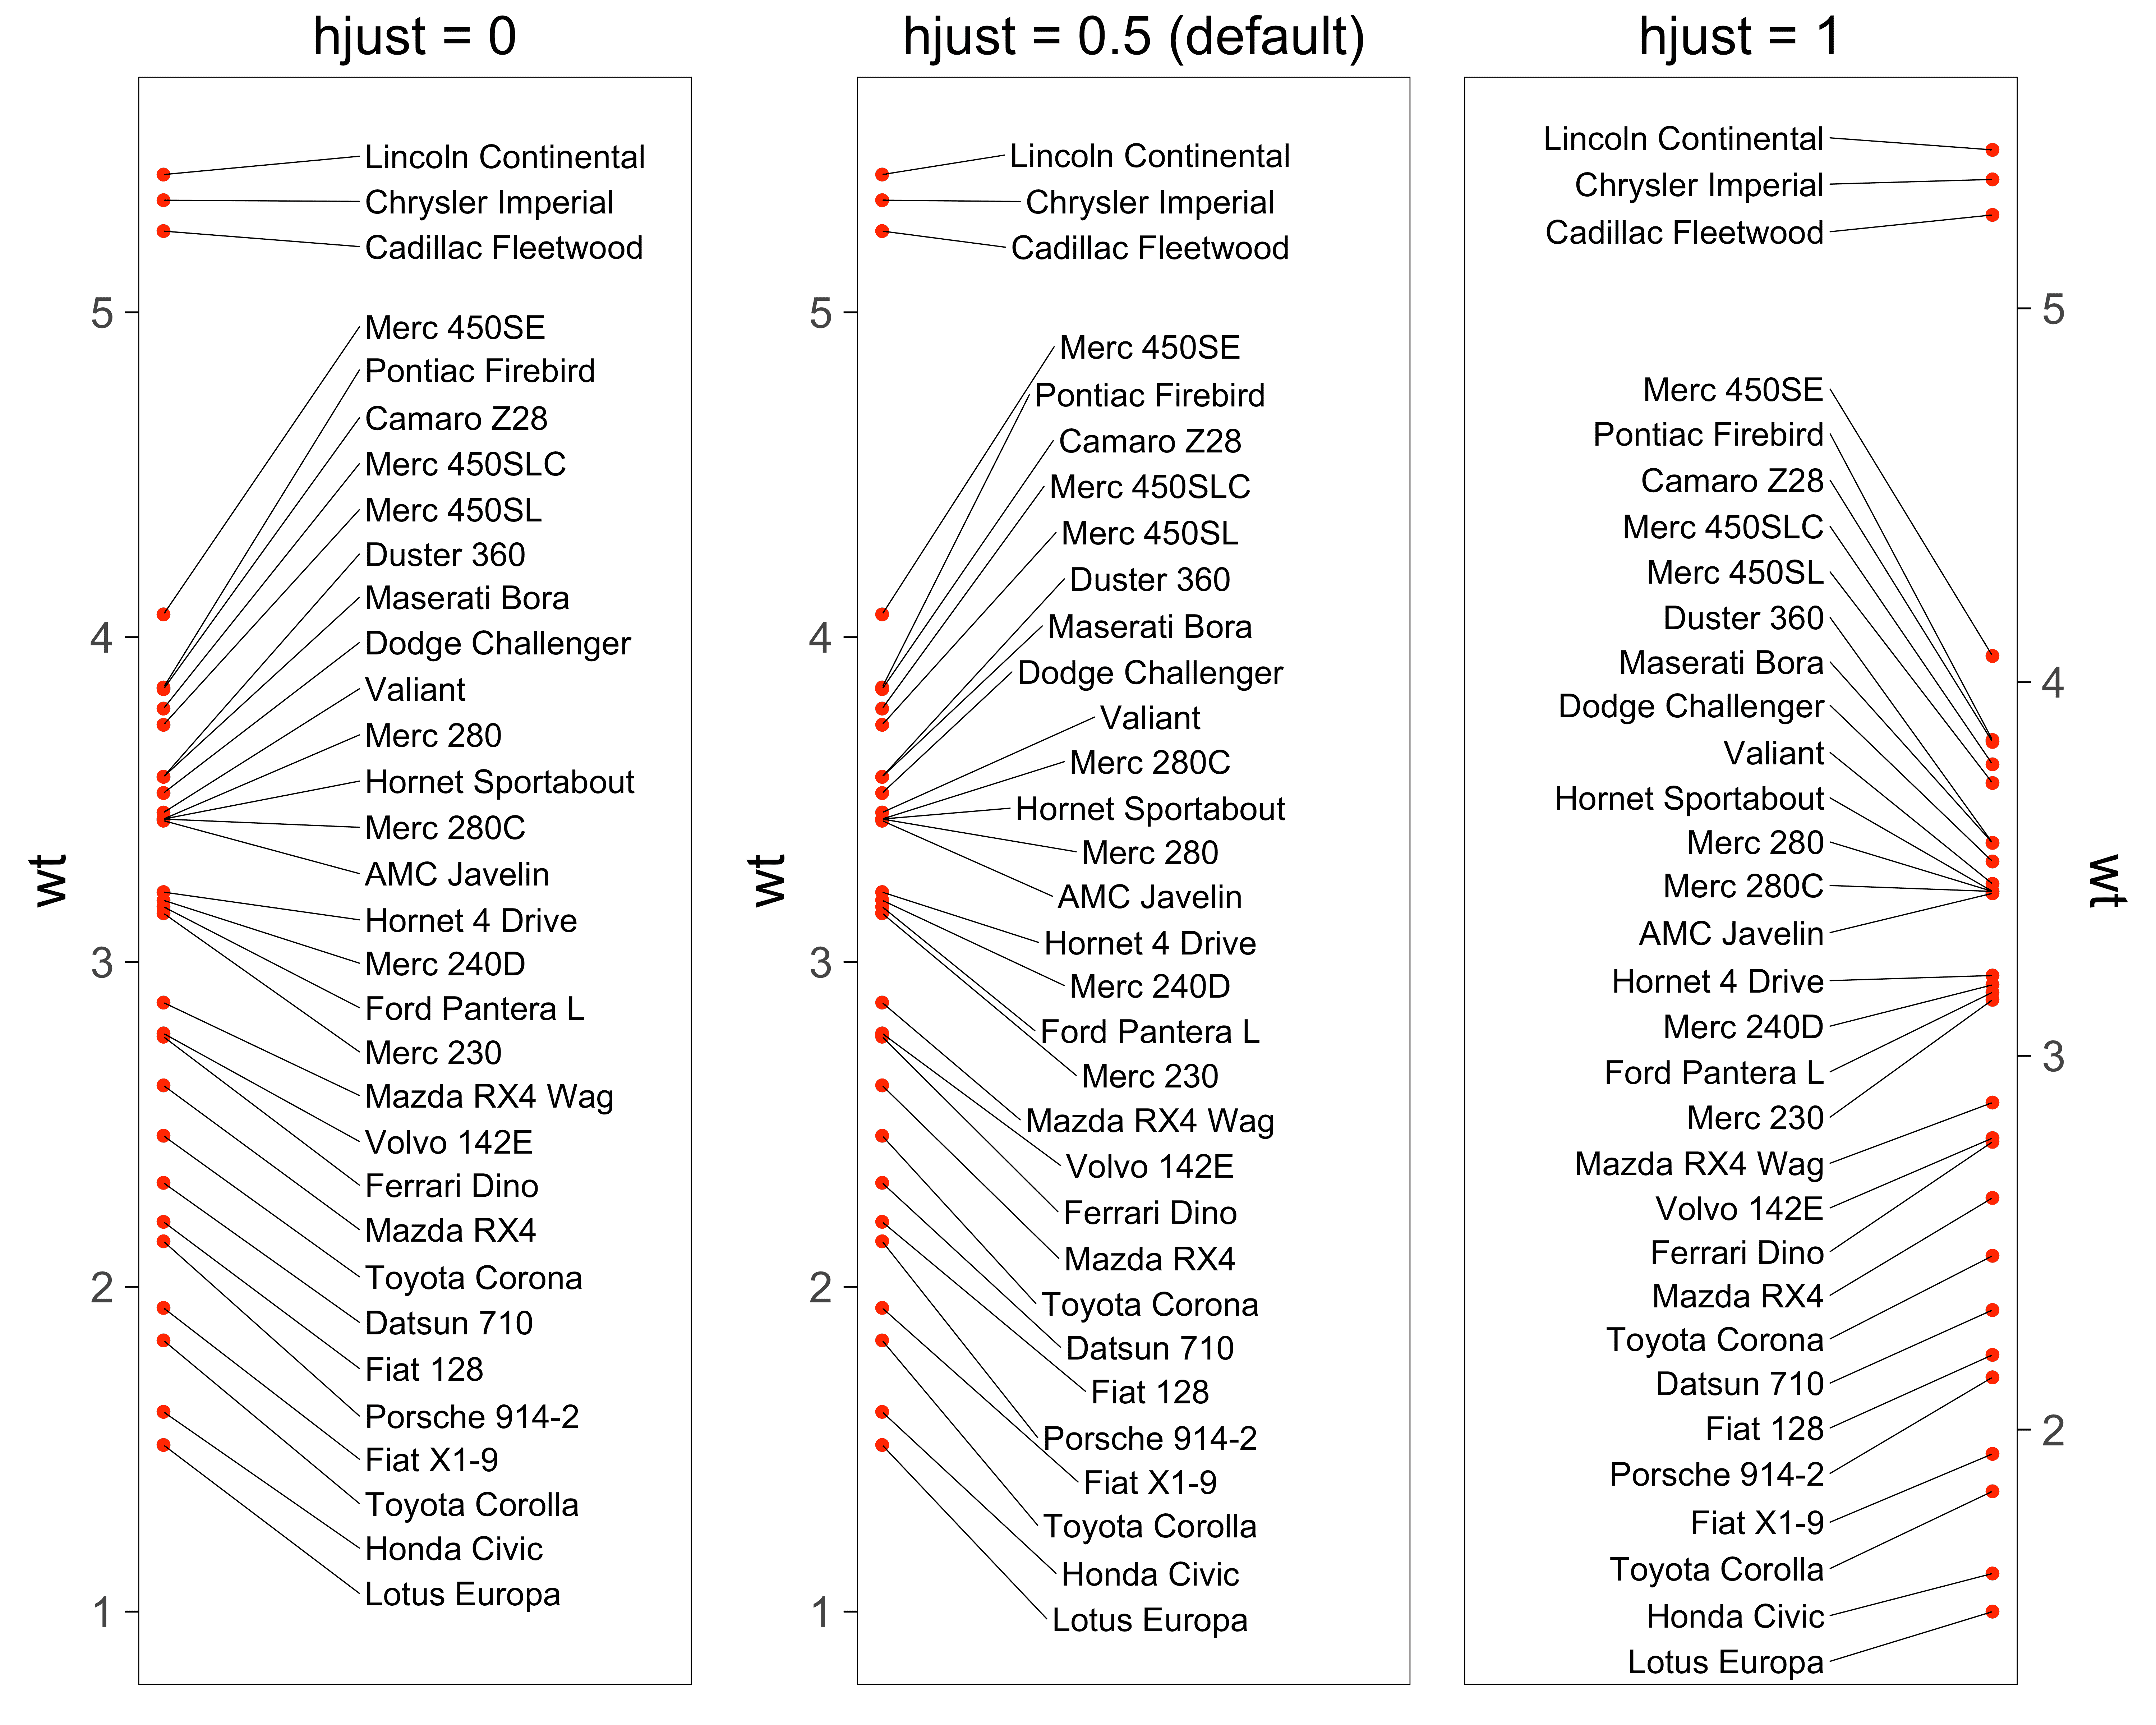
ggplot(mtcars, aes(wt, mpg, label = rownames(mtcars))) +
  geom_text_repel() +
  geom_point(color = 'red') +
  theme_classic(base_size = 16)

Installation

# The easiest way to get ggrepel is to install it from CRAN:
install.packages("ggrepel")

# Or get the the development version from GitHub:
# install.packages("devtools")
devtools::install_github("slowkow/ggrepel")

Usage

See the examples page to learn more about how to use ggrepel in your project.

Examples

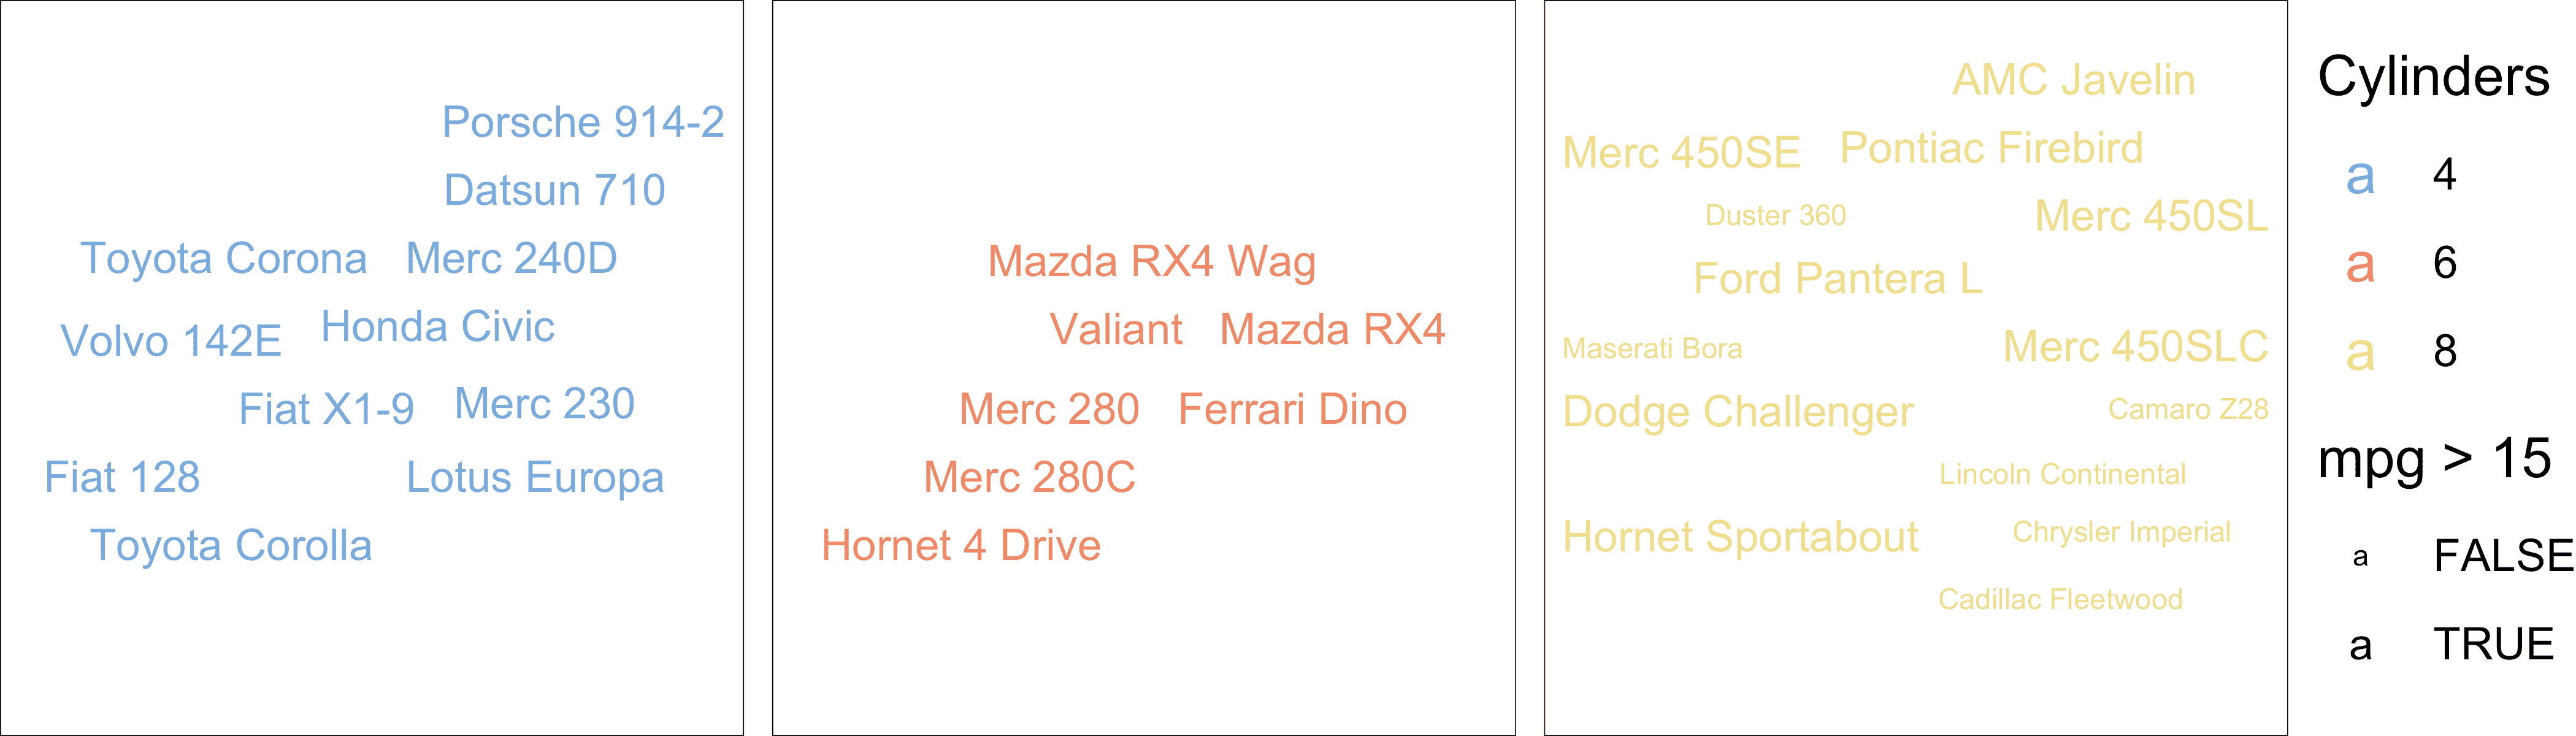
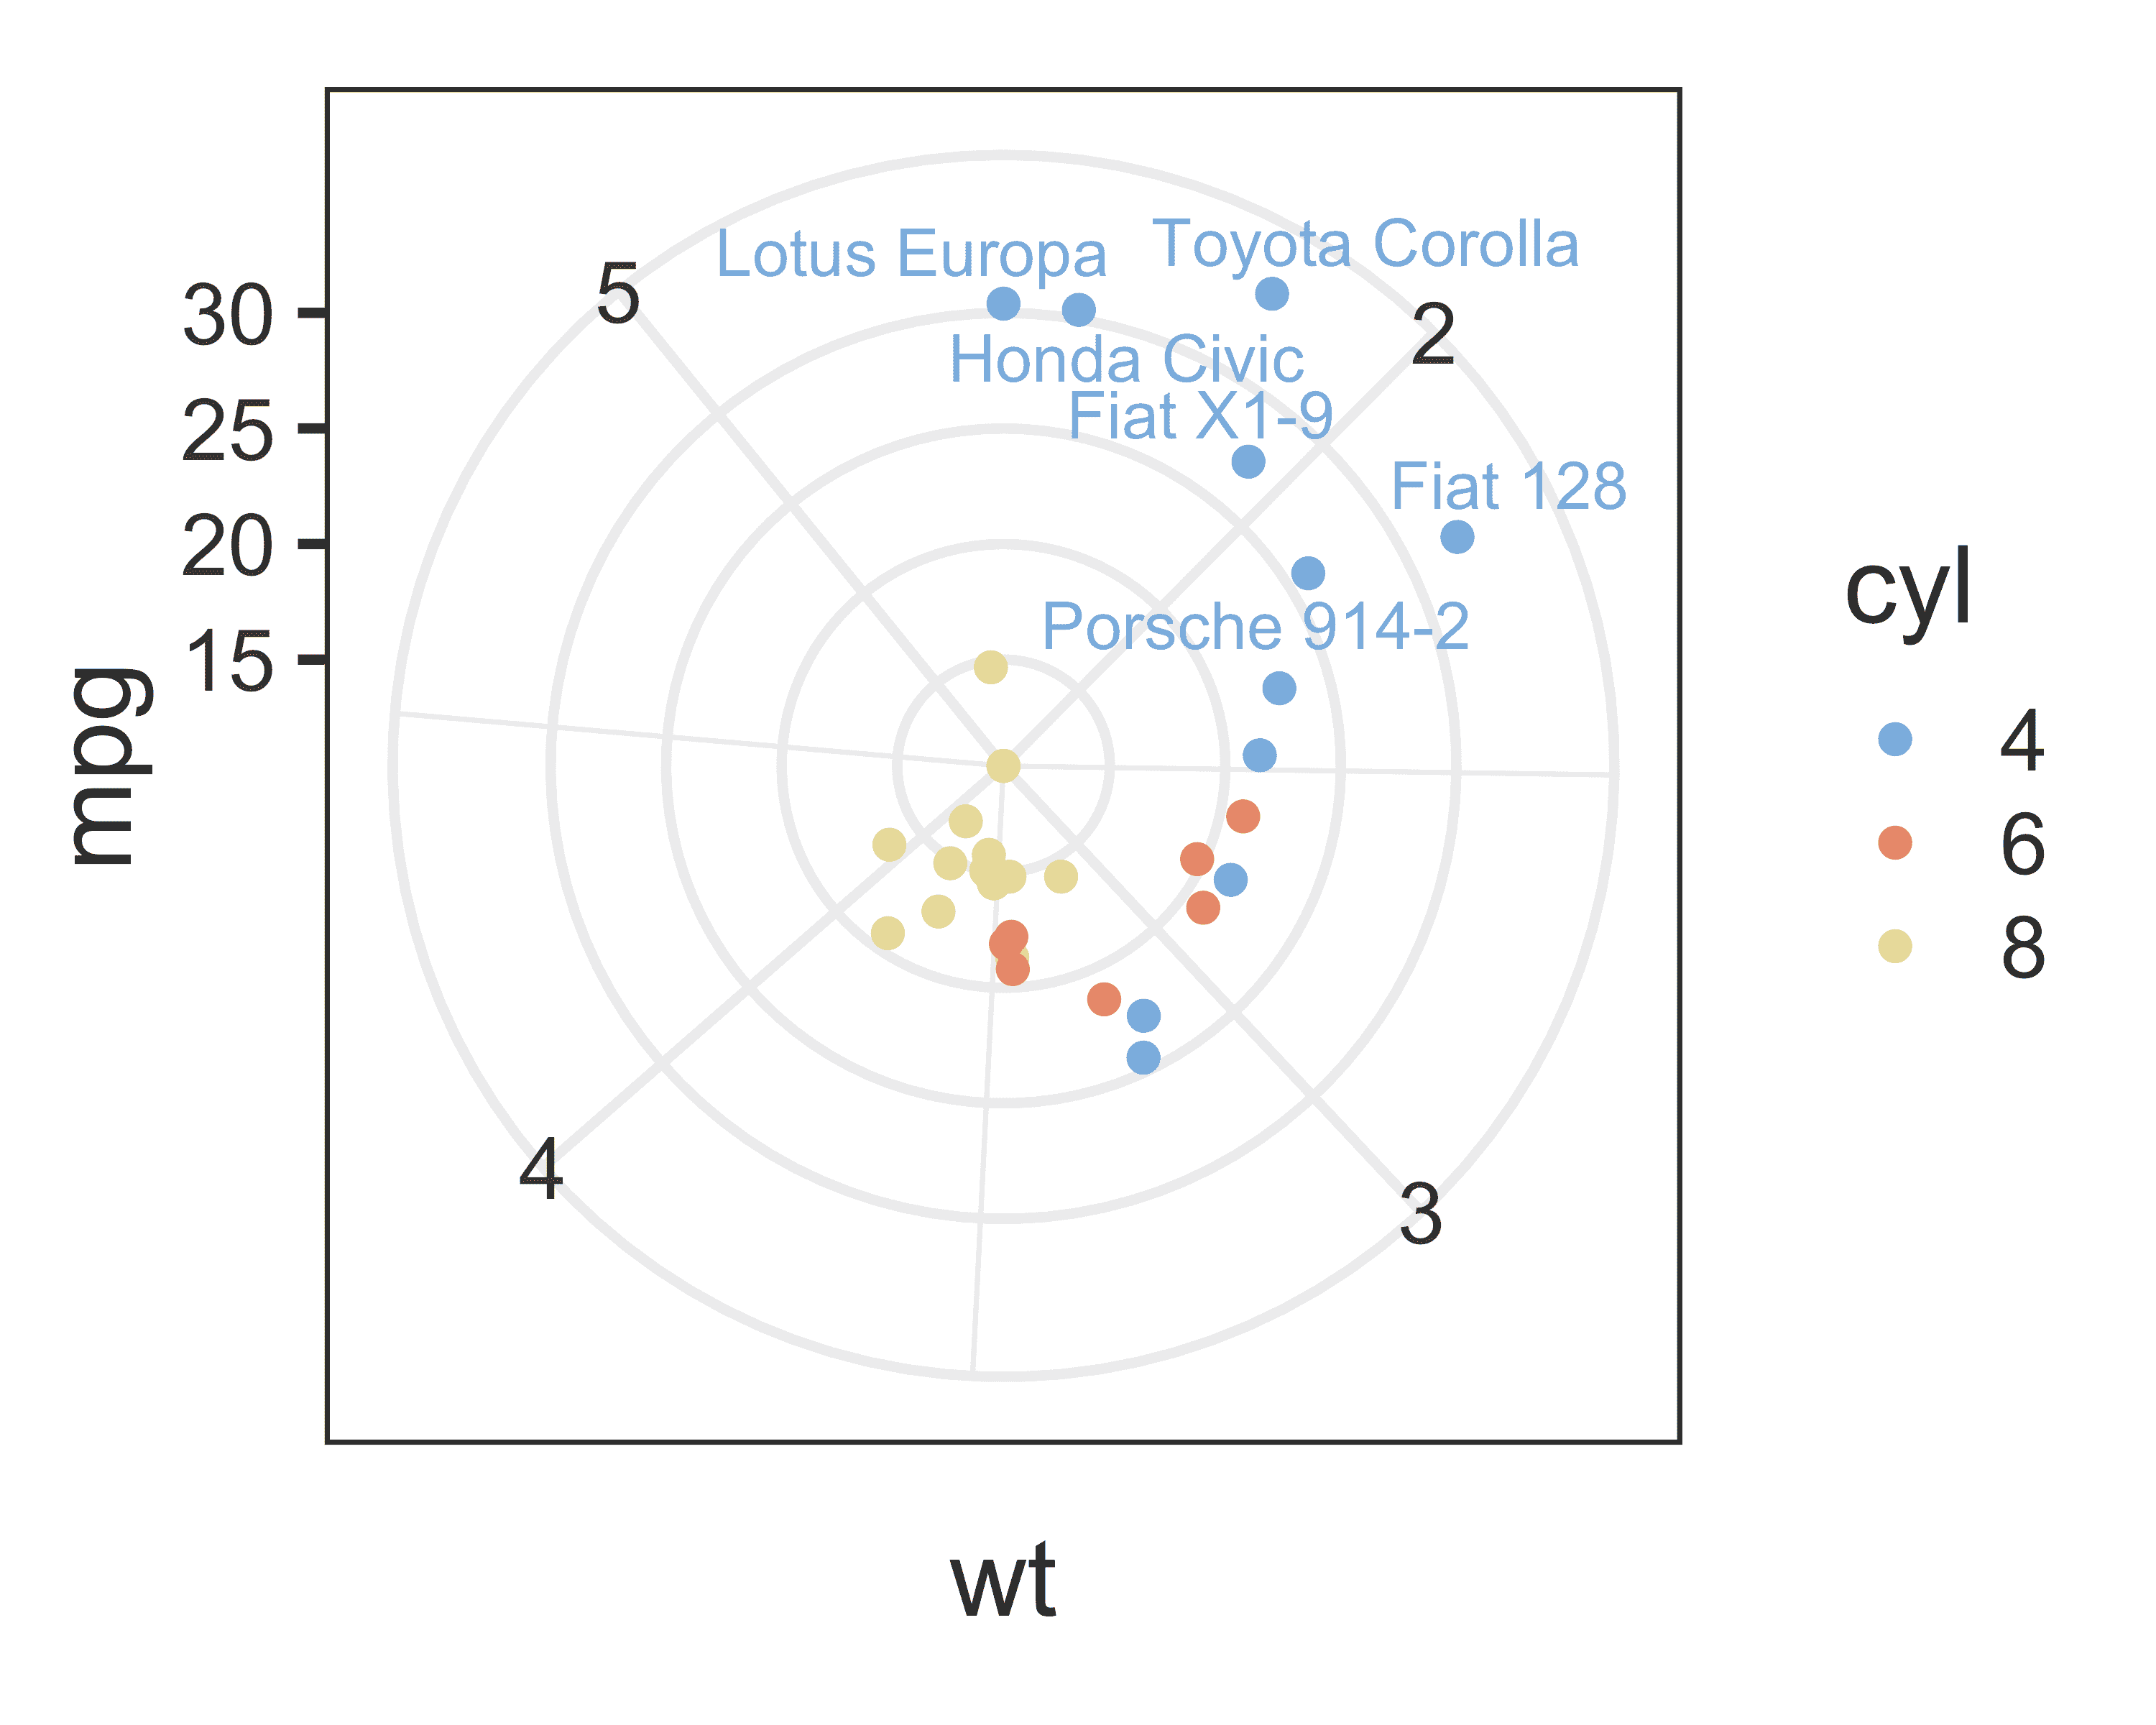
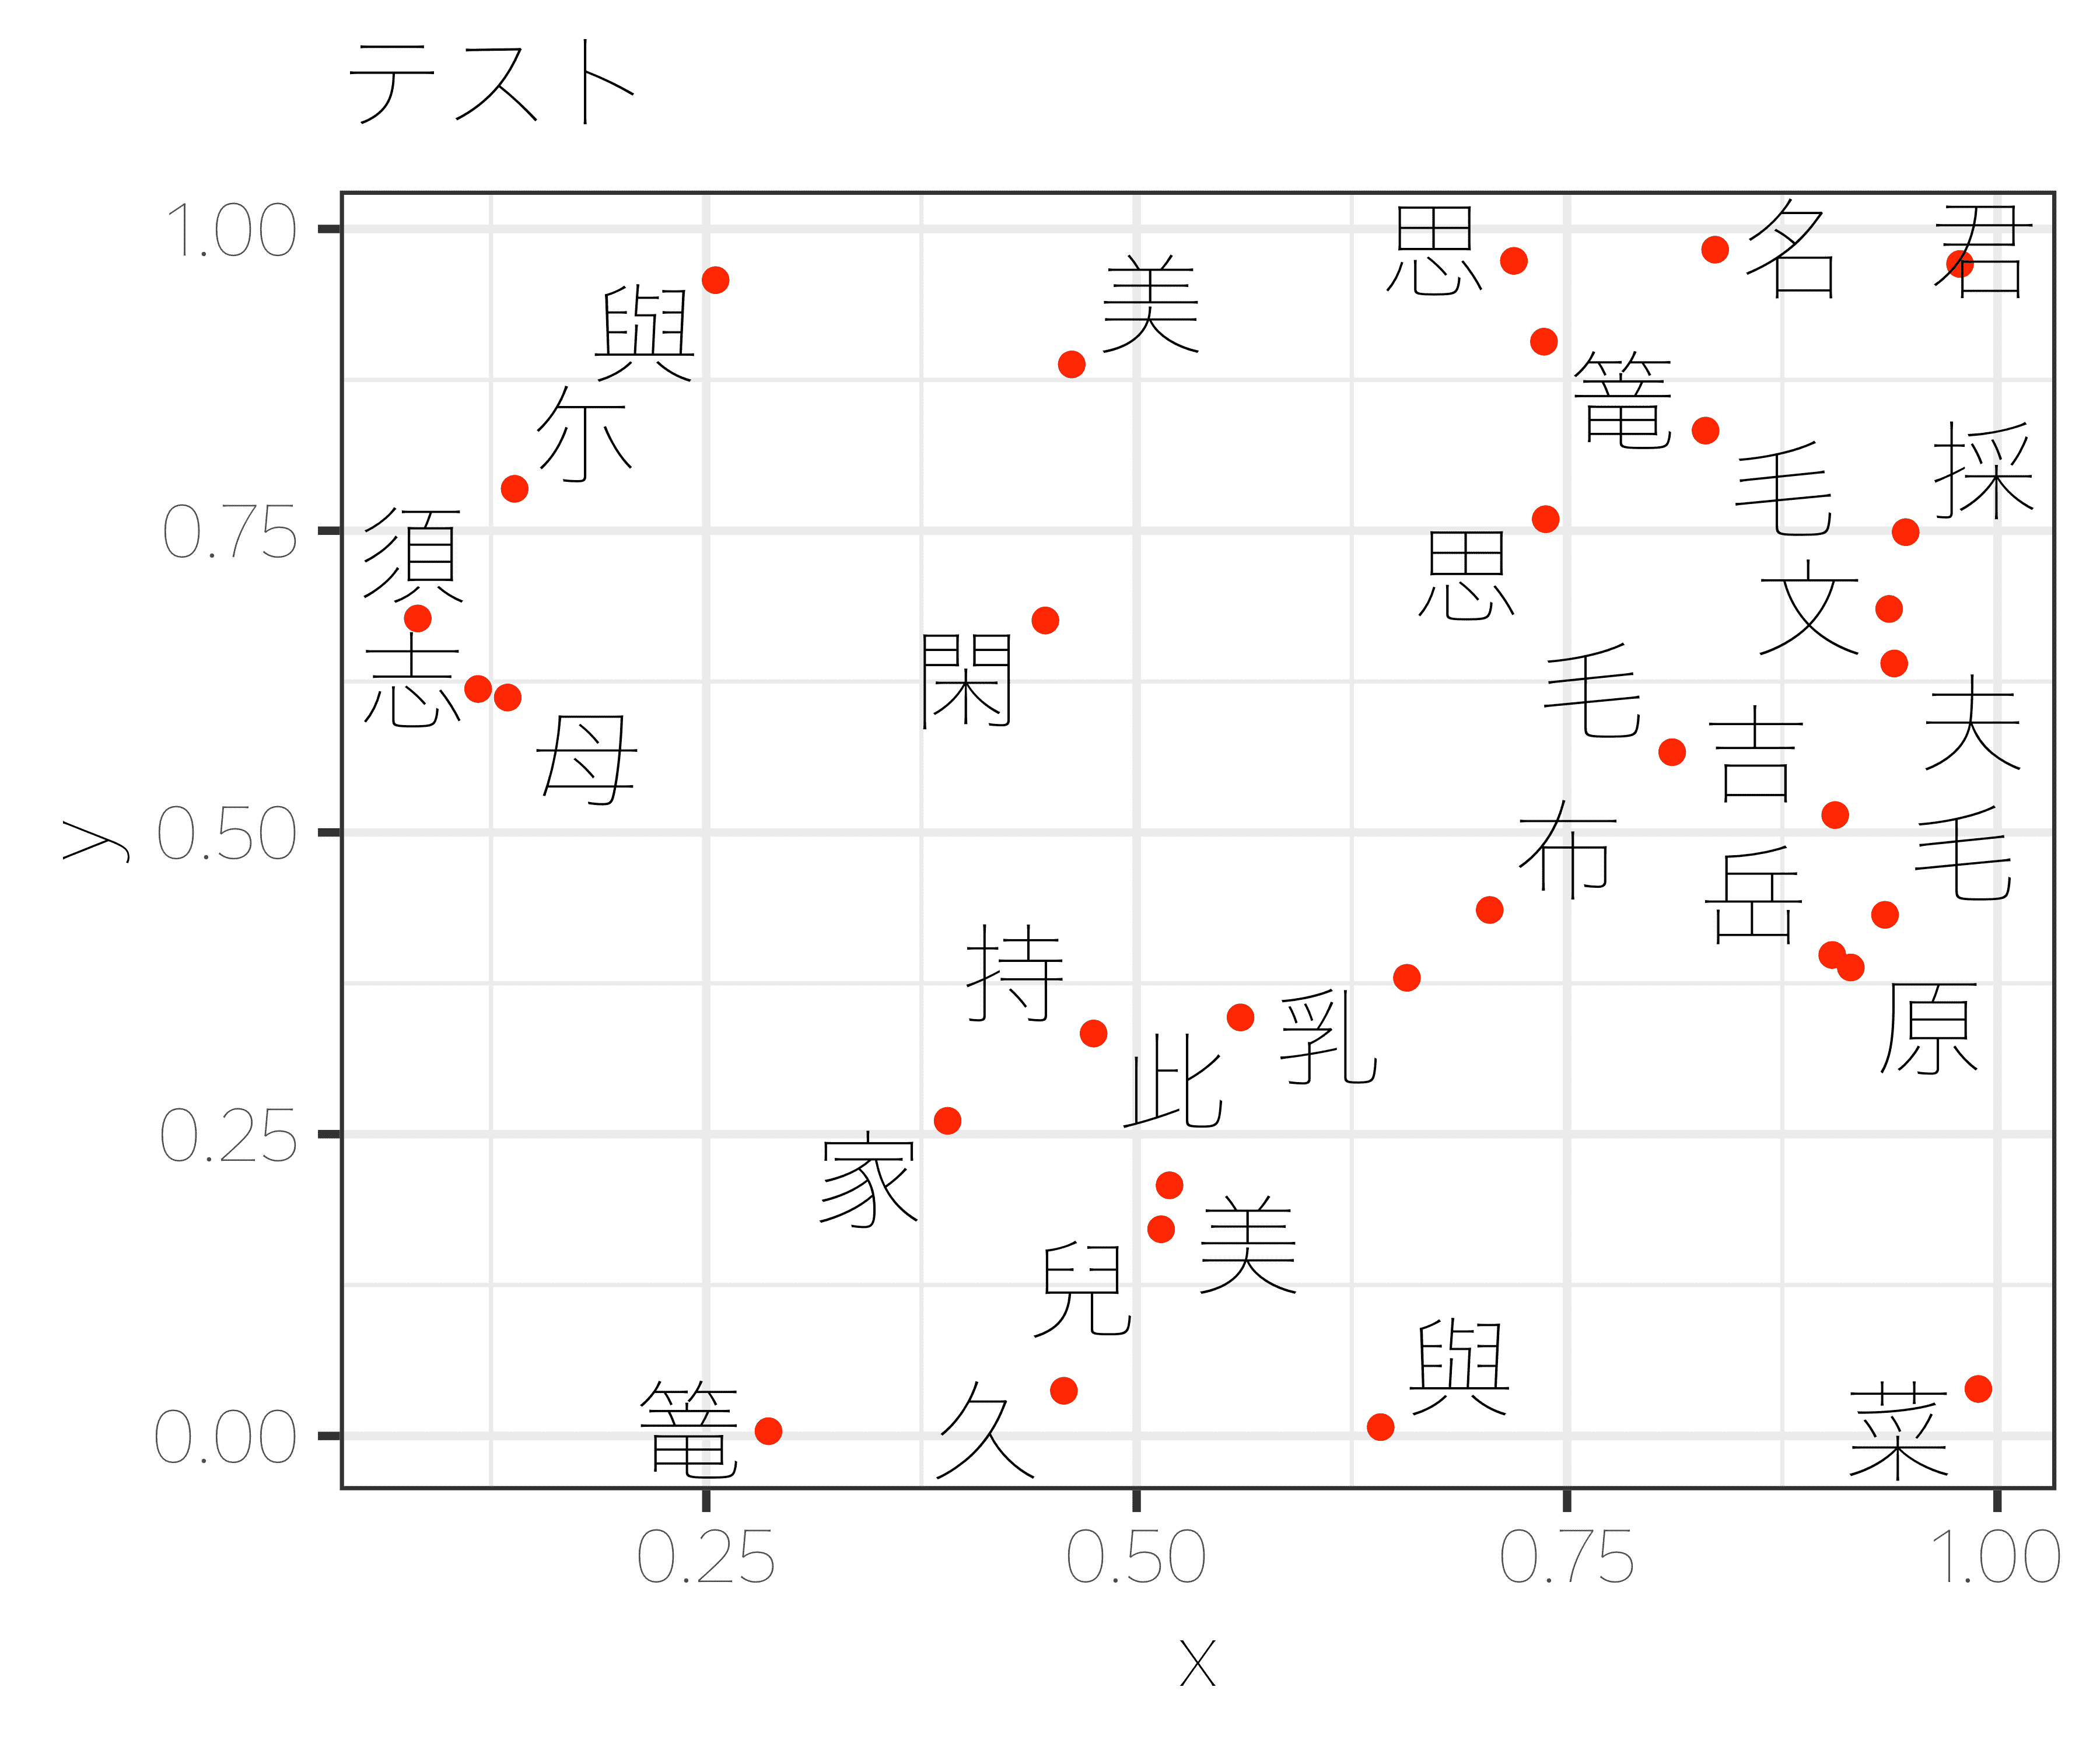
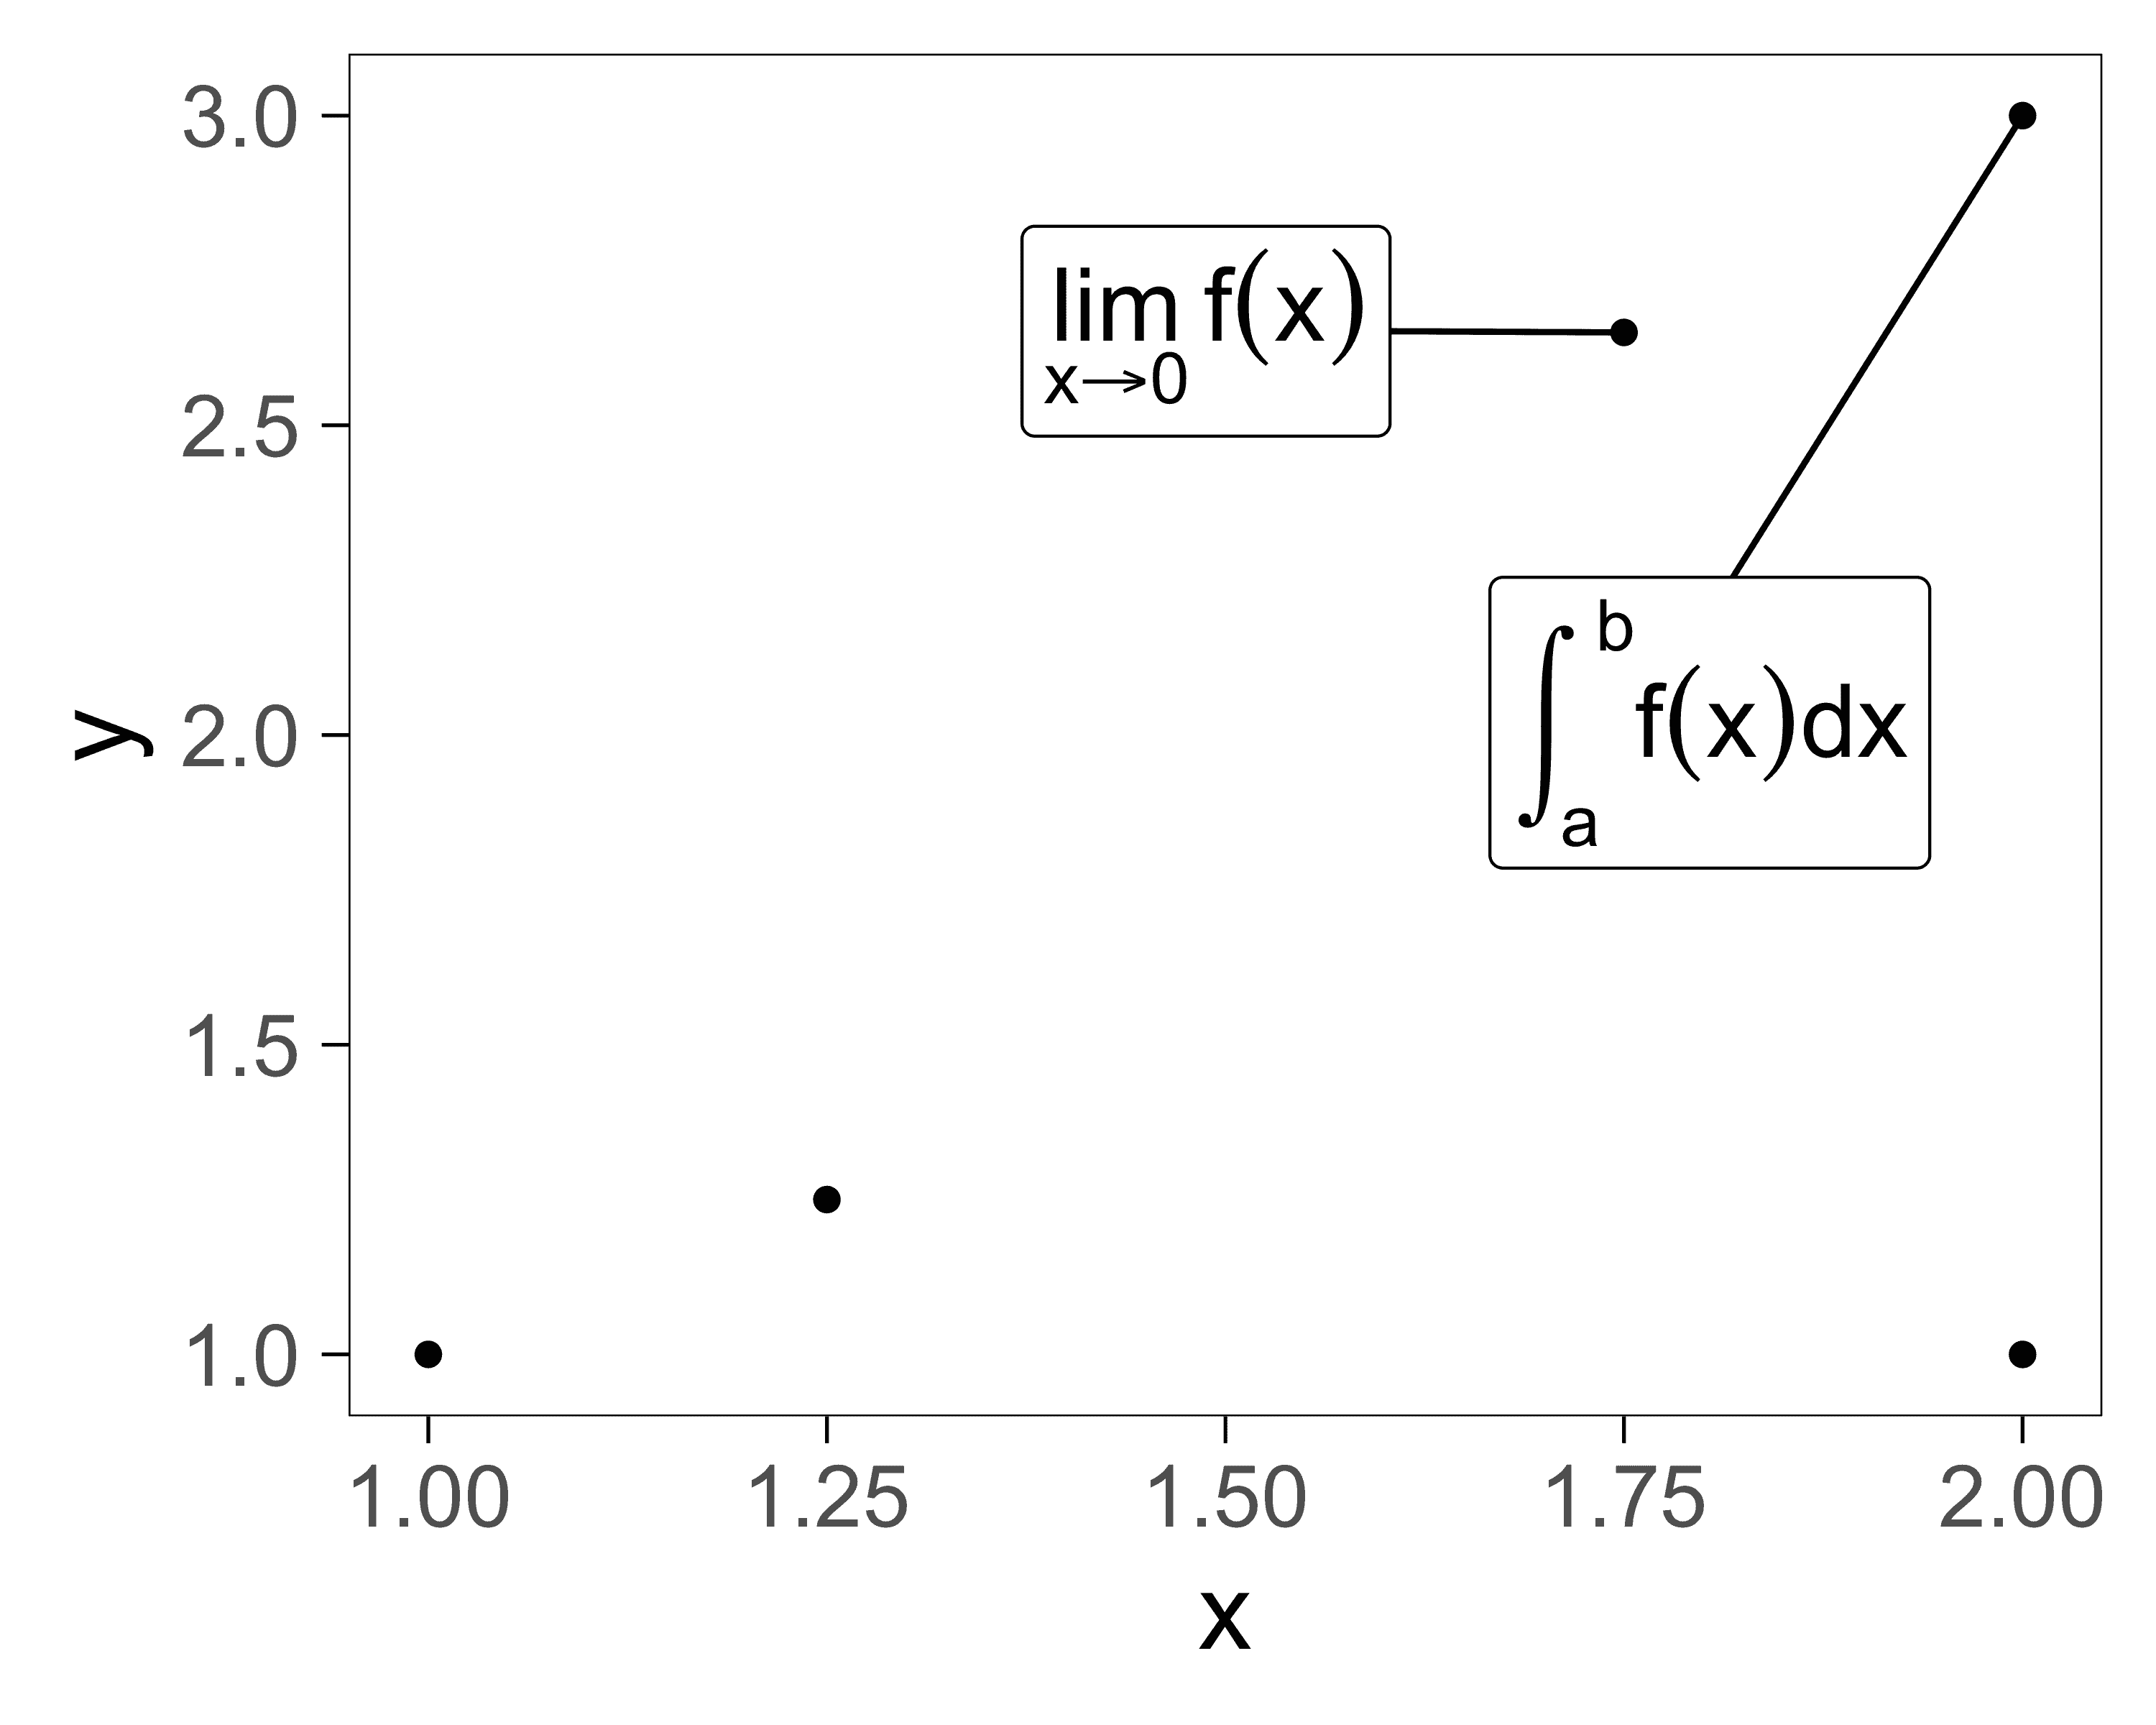
Click one of the images below to go to see the code example:

Hide some of the labels Always show all labels, even when they have too many overlaps Do not repel labels from data points Do not repel labels from plot (panel) edges Expand the scale to make room for labels Always (or never) draw line segments Make curved line segments or arrows Repel labels from data points with different
sizes Limit labels to a specific area Remove โ€œaโ€ from the legend Align labels on the top or bottom edge Align labels on the left or right edge Using ggrepel with stat_summary() Justify multiple lines of text with hjust Label jittered points Nudge labels in different directions with ggpp Label sf objects Shadows (or glow) under text labels Verbose timing information Word cloud Polar coordinates Unicode characters (Japanese) Mathematical expressions

Contributing

Please submit an issue to report bugs or ask questions.

Please contribute bug fixes or new features with a pull request to this repository.

ggrepel's People

Contributors

aliciaschep avatar amirmasoudabdol avatar aphalo avatar cderv avatar darwinawardwinner avatar francisbarton avatar jiho avatar kiendang avatar krassowski avatar lukauskas avatar malcolmbarrett avatar michaelchirico avatar olivroy avatar owenjonesuob avatar rcannood avatar seaaan avatar slowkow avatar yutannihilation avatar zkamvar avatar

Stargazers

 avatar  avatar  avatar  avatar  avatar  avatar  avatar  avatar  avatar  avatar  avatar  avatar  avatar  avatar  avatar  avatar  avatar  avatar  avatar  avatar  avatar  avatar  avatar  avatar  avatar  avatar  avatar  avatar  avatar  avatar  avatar  avatar  avatar  avatar  avatar  avatar  avatar  avatar  avatar  avatar  avatar  avatar  avatar  avatar  avatar  avatar  avatar  avatar  avatar  avatar  avatar  avatar  avatar  avatar  avatar  avatar  avatar  avatar  avatar  avatar  avatar  avatar  avatar  avatar  avatar  avatar  avatar  avatar  avatar  avatar  avatar  avatar  avatar  avatar  avatar  avatar  avatar  avatar  avatar  avatar  avatar  avatar  avatar  avatar  avatar  avatar  avatar  avatar  avatar  avatar  avatar  avatar  avatar  avatar  avatar  avatar  avatar  avatar  avatar  avatar

Watchers

 avatar  avatar  avatar  avatar  avatar  avatar  avatar  avatar  avatar  avatar  avatar  avatar  avatar  avatar  avatar  avatar  avatar  avatar  avatar  avatar  avatar  avatar  avatar  avatar  avatar  avatar  avatar

ggrepel's Issues

labels for geom_jitter

Thanks to Beryl Cummings for catching this one!

Problem

When you move points around with geom_jitter or position_jitter, the labels still point to the original data coordinates.

Solution

ggrepel should know if the points have been jittered, and the labels should point to the new positions.

Example

library(ggrepel)

dat <- mtcars
dat$name <- rownames(mtcars)
dat$name[dat$cyl != 6] <- ""

ggplot(dat, aes(cyl, mpg, color = name != "", label = name)) +
  geom_point(
    position = position_jitter(width = 0.5)
  ) +
  geom_label_repel()

image

label outliers only (feature proposal)

At times I would like to label the outliers of a scatter plot, where outliers are defined as those whose labels are already far away from other labels. Such a geom would share a lot of code, I think, with geom_text_repel, which is already aware of the placement of labels and points. Perhaps this could exist as a separate geom within this package.

Add option for hiding segment when too short

For example, in the following diagram:

image

Most segments are not necessary because the proximity already implies correspondence. Could there be an option (min.segment.length for example) to stop too short segments from being drawn?

Thanks!

Labels on maps projected with coord_map or ggalt::coord_proj

I think geom_text_repel() is awesome for labelling points on maps; however, I've come across an issue with maps in projected coordinates using coord_map or ggalt::coord_proj. Basically the labels and lines are way off. It would be really cool if your labels would work seamlessly with @hrbrmstr's ggalt package!

set.seed(1)
world <- map_data("world")
world <- world[world$region != "Antarctica",]
cities <- structure(list(city = c("Dallas", "Johannesburg", "Abu Dhabi", 
"Dubai", "Jeddah", "Doha", "New York", "Newark", "Boston", "Houston", 
"Los Angeles", "Toronto", "Mumbai", "Chicago", "Sydney", "Atlanta", 
"San Francisco", "Hong Kong", "Guangzhou", "Taipei", "Melbourne"
), lon = c(-96.7969879, 28.0473051, 54.6972774, 55.2707828, 39.2375507, 
51.5310398, -74.0059413, -74.1723667, -71.0588801, -95.3698028, 
-118.2436849, -79.3831843, 72.8776559, -87.6297982, 151.2069902, 
-84.3879824, -122.4194155, 114.109497, 113.264385, 121.5654177, 
144.96328), lat = c(32.7766642, -26.2041028, 24.2991738, 25.2048493, 
21.2854067, 25.2854473, 40.7127837, 40.735657, 42.3600825, 29.7604267, 
34.0522342, 43.653226, 19.0759837, 41.8781136, -33.8674869, 33.7489954, 
37.7749295, 22.396428, 23.12911, 25.0329694, -37.814107)), class = "data.frame", .Names = c("city", 
"lon", "lat"), row.names = c(NA, -21L))

Unprojected works great:

ggplot() + 
  geom_map(data=world, map=world, aes(x=long, y=lat, map_id=region), fill = 'grey70') +
  geom_text_repel(data = cities, aes(lon, lat, label = city), size = 3,
                  box.padding = unit(0.1, 'lines'), force = 0.5)

unprojected

with coord_map():

ggplot() + 
  geom_map(data=world, map=world, aes(x=long, y=lat, map_id=region), fill = 'grey70') +
  coord_map("mollweide") +
  geom_text_repel(data = cities, aes(lon, lat, label = city), size = 3,
                  box.padding = unit(0.1, 'lines'), force = 0.5)

coord_map

with coord_proj():

ggplot() + 
  geom_map(data=world, map=world, aes(x=long, y=lat, map_id=region), fill = 'grey70') +
  coord_proj("+proj=moll") + 
  geom_text_repel(data = cities, aes(lon, lat, label = city), size = 3,
                  box.padding = unit(0.1, 'lines'), force = 0.5)

coord_proj

Direction of label displacement (feature proposal)

All the use examples until now have been for geom_point(). ggrepel would be extremely useful for labeling peaks (or valley) in curves produced with geom_line() and in such a situation it would be useful to have the possibility of restricting the displacement of labels to certain directions (say for peaks, prevent downward displacements, for valleys prevent upwards displacements). Any idea of how difficult implementing this could be? (I haven't yet looked at the source code...)
The peaks and wavelength dependent colors are obtained with stat_peaks() from a package I am developing http://www.r4photobiology.info/. For the example bellow I just passed as argument geom "label_repel".

ggrepel-with-peaks

Is there a way to have one label for several equal ones?

Hello, your package is very useful, thank you!

So, I have a lot of points, but a lot of their labels are identical. In this case it would be great to have only one common label displayed with several outgoing arrows to corresponding points. Is such thing possible right now?

repel only for overlapping labels/text

It would be nice to provide an option where labelsl/text are only repelled if they overlap with each other. Labels/text that do not overlap should be directly on xy location. I had a look at the documentation and came up with no easy way to do this. Apologies if I missed something.

Does the function work for other geom's as well?

Hello,

not an issue... but a question....

I am using ggplot's histogram geom and geom_vline to show the position of the mean value in the histogram of two (or more) groups of data. The associated text labels (text with the mean value) are still overlapping.
Is there a trick to get the "non-overlapping" function also under these circumstances?

Best regards,
Jรผrgen

Text cut off by edge of plot when using nudge_y options

It seems that using the nudge_y option somehow disables ggrepel's protection against text extending past the borders of a plot. See the code examples below.

x <- data.frame(x=1:10, y=1:10, label=sprintf("Longish Label %i", 1:10))

p <- p2 <- ggplot(x) +
    aes(x=x, y=y, label=label) +
    geom_point()

## No nudge: OK; labels are nudged into the frame
p + geom_text_repel()

image

## Nudge x & y: labels cut off
p + geom_text_repel(nudge_x=-0.3, nudge_y=0.3)

image

## Nudge x only: OK
p + geom_text_repel(nudge_x=-0.3)

image

## Nudge y only: labels cut off
p + geom_text_repel(nudge_y=0.3)

image

geom_text_repel() not working with coord_polar()

Hi slowkow, nice package by the way. I think my code was working before (about one month ago) but recently I got some issues.

I find that geom_text_repel() does not work when I use coord_polar().

Here is an example:

set.seed(0)
test <- data.frame(
  R = runif(n = 15, min = 0.5, max = 1), 
  phi = runif(n = 15, min = 0, max = 24),
  Label = sample(x = letters, 15, replace = FALSE)
)

# works
ggplot(test, aes(x = R, y = phi, label = Label)) +
  coord_polar(theta = "y") +
  geom_text() +
  expand_limits(x = 0) +
  scale_y_continuous(limits = c(0, 24), breaks = seq(6, 24, 6))

# doesnt work:
# Error in if (text_box[1] <= point_pos[1] && point_pos[1] <= text_box[3] &&  : 
# missing value where TRUE/FALSE needed
ggplot(test, aes(x = R, y = phi, label = Label)) +
  coord_polar(theta = "y") + geom_text_repel() +
  expand_limits(x = 0) +
  scale_y_continuous(limits = c(0, 24), breaks = seq(6, 24, 6))

The example code should look like this:

plot_zoom_png-26

My sessionInfo() is:

> R version 3.3.1 (2016-06-21)
Platform: x86_64-redhat-linux-gnu (64-bit)
Running under: CentOS Linux 7 (Core)
locale:
 [1] LC_CTYPE=en_US.UTF-8       LC_NUMERIC=C               LC_TIME=en_US.UTF-8        LC_COLLATE=en_US.UTF-8     LC_MONETARY=en_US.UTF-8    LC_MESSAGES=en_US.UTF-8    LC_PAPER=en_US.UTF-8      
 [8] LC_NAME=C                  LC_ADDRESS=C               LC_TELEPHONE=C             LC_MEASUREMENT=en_US.UTF-8 LC_IDENTIFICATION=C       
attached base packages:
[1] grid      stats     graphics  grDevices utils     datasets  methods   base     
other attached packages:
[1] ggrepel_0.6.3  glmnet_2.0-5   foreach_1.4.3  Matrix_1.2-7.1 ggplot2_2.1.0  dplyr_0.5.0    reshape2_1.4.2 hash_2.2.6    
loaded via a namespace (and not attached):
 [1] Rcpp_0.12.7          AnnotationDbi_1.28.2 magrittr_1.5         BiocGenerics_0.12.1  IRanges_2.0.1        munsell_0.4.3        lattice_0.20-34      colorspace_1.2-7     R6_2.2.0            
[10] stringr_1.1.0        GenomeInfoDb_1.2.5   plyr_1.8.4           tools_3.3.1          parallel_3.3.1       Biobase_2.26.0       gtable_0.2.0         DBI_0.5-1            iterators_1.0.8     
[19] lazyeval_0.2.0       assertthat_0.1       tibble_1.2           codetools_0.2-15     S4Vectors_0.4.0      RSQLite_1.0.0        labeling_0.3         stringi_1.1.2        scales_0.4.0        
[28] stats4_3.3.1         XML_3.98-1.4    

Upload to CRAN?

Hey, I've noticed that ggrepel can't be installed via install.packages().
Have you added it to CRAN? (as far as I'm concerned, no)
What do you think about adding ggrepel to CRAN?
If you are okay with the whole idea, I'd love to upload the package to CRAN. (though I've never done it)

And thank you for this package! ๐Ÿ‘ ๐Ÿ‘ ๐Ÿ‘

Very Sporatic Error

I am getting a very odd and sporadic error, that appears to be caused by the interplay between geom_point and geom_label_repel. In particular, it seems to be the inclusion of the color aesthetic in geom_point that causes the problem, but the crash is so elusive that this could be a red herring.

Attempting to replicate, in most cases, the following code does not seem to cause any issues:

library(ggplot2)
library(ggrepel)

cars <- mtcars

cars$name <- row.names(mtcars)
row.names(cars) <- NULL

ggplot(cars) +
  geom_point(aes(x = hp,
                 y = mpg,
                 color = wt,
                 size = disp)) +
  geom_label_repel(aes(x = hp, 
                       y = mpg,
                       label = name))

Nevertheless, I sporadically get the following, which can causes R (3.2.3) to crash:

Error in grid.Call(L_convert, x, as.integer(whatfrom), as.integer(whatto),  : 
  Viewport has zero dimension(s)

I am submitting this issue in the hopes others may have more insight into how to replicate it, and what may be causing it.

Example in README.md fails

Running R 3.1.1 and installed ggrepel from github. The example on the frontpage fails as shown below:

> ggplot(mtcars) +
+     geom_point(aes(wt, mpg), color = 'red') +
+     geom_text_repel(aes(wt, mpg, label = rownames(mtcars)))
Error in match(x, table, nomatch = 0L) : attempt to apply non-function

The output of sessionInfo() is

> sessionInfo()
R version 3.1.1 (2014-07-10)
Platform: x86_64-apple-darwin13.1.0 (64-bit)

locale:
[1] en_US.UTF-8/en_US.UTF-8/en_US.UTF-8/C/en_US.UTF-8/en_US.UTF-8

attached base packages:
[1] grid      graphics  grDevices utils     datasets  parallel  stats     methods   base     

other attached packages:
[1] ncgchts_2.2.24 ROracle_1.1-12 DBI_0.3.1      ggrepel_0.1.0  devtools_1.8.0 dplyr_0.4.0    reshape2_1.4.1
[8] ggplot2_2.0.0 

loaded via a namespace (and not attached):
 [1] assertthat_0.1   bitops_1.0-6     colorspace_1.2-6 curl_0.9.2       digest_0.6.8     evaluate_0.5.5  
 [7] formatR_1.0      git2r_0.10.1     gtable_0.1.2     httr_0.5         iterators_1.0.8  itertools_0.1-3 
[13] knitr_1.8        labeling_0.3     magrittr_1.5     MASS_7.3-34      memoise_0.2.1    munsell_0.4.2   
[19] plyr_1.8.3       proto_0.3-10     Rcpp_0.12.2      RCurl_1.95-4.7   rversions_1.0.2  scales_0.3.0    
[25] stringi_1.0-1    stringr_1.0.0    tools_3.1.1      xml2_0.1.1      

Only label "low-density" points

This is possible out of scope for ggrepel, but it's often nice to be able to label just the unusual points, i.e. those points that are in a low-density region of the plot.

Vignette example causing error

noticed this error in my code and on checking the vignette, the same issue arises

library(ggrepel)
#Loading required package: ggplot2

p <- ggplot(mtcars, aes(wt, mpg, label = rownames(mtcars)))
p + geom_text_repel()
Error in zero_range(from) : x must be length 1 or 2
sessionInfo()

R version 3.3.1 (2016-06-21)
Platform: x86_64-w64-mingw32/x64 (64-bit)
Running under: Windows >= 8 x64 (build 9200)

locale:
[1] LC_COLLATE=English_Canada.1252  LC_CTYPE=English_Canada.1252    LC_MONETARY=English_Canada.1252
[4] LC_NUMERIC=C                    LC_TIME=English_Canada.1252    

attached base packages:
[1] stats     graphics  grDevices utils     datasets  methods   base     

other attached packages:
[1] ggrepel_0.5        ggplot2_2.1.0.9001

loaded via a namespace (and not attached):
 [1] labeling_0.3        colorspace_1.2-7    scales_0.4.0.9003   assertthat_0.1      lazyeval_0.2.0.9000
 [6] plyr_1.8.4          tools_3.3.1         gtable_0.2.0        tibble_1.2          Rcpp_0.12.7        
[11] grid_3.3.1          munsell_0.4.3      

suppress line joining label to point

a fairly straightforward application is when the user wants to render the label without including the underlying point.

in such a case, it would be useful to have the label without the line--would it be feasible to rewrite the repel functions to have the option of just having the label, and no line?

grid package must be loaded?

Hi, neat package. I tried the following:

library(devtools)
install_github("slowkow/ggrepel")
library(ggrepel)
library(ggplot2)

ggplot(mtcars) +
  geom_point(aes(wt, mpg), color = 'red') +
  geom_text_repel(aes(wt, mpg, label = rownames(mtcars))) +
  theme_classic(base_size = 16)

And got this error message:

Error in get(x, envir = this, inherits = inh)(this, ...) : 
  could not find function "unit"

I assume I need to load grid? Maybe something to add to the example. When I run library(grid) first, I don't get this error

update to ggplot 2.2.0

ggplot2 was updated to 2.2.0 and I believe all the extensions have some trouble:

https://cran.r-project.org/web/packages/ggplot2/news.html

Unfortunately there was a major oversight in the construction of ggproto which lead to extensions capturing the super object at package build time, instead of at package run time (#1826). This problem has been fixed, but requires re-installation of all extension packages.

While removing and reinstalling ggrepel does the trick, some users might be confused. A new CRAN version should do the trick.

Can you extract ggrepel coordinates?

Hi @slowkow ,

Great package. I am wondering if there is a way to get back the pre-transformed coordinate locations for ggrepel text points. For example, once plotted, it is possible to obtain the ggplot values of there the points are but it would be very helpful/useful for hacking purposes to expose those values somehow.

This should give an idea of what I am hoping to achieve. I don't know if it is possible to get his data any other way besides plotting and pulling out the post-processed values.

library(ggrepel)
library(gtable)

gg <- ggplot(mtcars, aes(wt, mpg)) +
  geom_point(color = 'red') +
  geom_text_repel(aes(label = rownames(mtcars))) 

#pull out the ggrepel grob bits 
built <- ggplot_gtable(ggplot_build(gg))        
plotdata <- built$grobs[[4]]$children$geom_text_repel.textrepeltree.53$data

# plot data will have the x and y values where ggrepel is plotted but they
# are expressed as a range between 0 and 1.
# can we get the values expressed in terms of the original data?

Thanks,

zach cp

Support for hjust and vjust

Currently, using hjust and vjust ggplot2 parameters will cause the labels not to line up with the segments connecting them to points. It's arguable that using ggrepel should remove the need for these parameters, but in some use cases (labeling lines, for instance, and trying to reduce overlap with the line) it may be desirable to use one or both of these parameters in addition to ggrepel.

Alternately, expand the documentation for ggrepel so that it is clear that these parameters aren't supported.

parsing bug with plotmath

Hi there, I can't seem to get this working:

library(ggplot2)
library(ggrepel)

ggplot(data.frame(x = 1, y = 1, Parameter = "italic(z)"), aes(x, y)) + 
  geom_point() + 
  geom_label_repel(aes(label = Parameter), parse = T)

Returns the error 'Error in x$lab != "" : comparison is not allowed for expressions'

> sessionInfo()
R version 3.3.2 (2016-10-31)
Platform: x86_64-w64-mingw32/x64 (64-bit)
Running under: Windows 7 x64 (build 7601) Service Pack 1

locale:
[1] LC_COLLATE=English_United States.1252  LC_CTYPE=English_United States.1252   
[3] LC_MONETARY=English_United States.1252 LC_NUMERIC=C                          
[5] LC_TIME=English_United States.1252    

attached base packages:
[1] stats     graphics  grDevices utils     datasets  methods   base     

other attached packages:
[1] ggrepel_0.6.5 ggplot2_2.2.0

loaded via a namespace (and not attached):
 [1] labeling_0.3     colorspace_1.2-7 scales_0.4.1     assertthat_0.1   lazyeval_0.2.0  
 [6] plyr_1.8.4       tools_3.3.2      gtable_0.2.0     tibble_1.2       Rcpp_0.12.7     
[11] grid_3.3.2       munsell_0.4.3   

Add option to repel only "each other" or "point".

Right now by default the labels repel each other as well as the data points. But in some situations, it is desirable to only repel (e.g.) each other but not the data points. That is, "stay exactly at the specified locations unless too crowded." I am not sure if this is already possible using current APIs.

Thanks for the great extension!

Any way to speed up the algo?

Thanks for this great package! I think the output is great! Most elegant graph with text that I've ever made.

However, I've noticed one insignificant issue that is the algo is kind of slow. For example, the code in the vignette would cost 10s to run in my MBP while geom_text would finish less than 1s, meaning the algo of adjusting the text's position costs 9 seconds.

Since the plot don't have too many labels, I would say it could be much faster. However, I don't know how to help...

The reason that I open this issue is I want use your package in my shiny apps, but if a plot needs 10s to run, the experience of the app would be jeopardized ...

Thanks again!

Cost 10 seconds

library(ggplot2)
library(ggrepel)
ggplot(mtcars) +
  geom_point(aes(wt, mpg), color = 'red') +
  geom_text_repel(aes(wt, mpg, label = rownames(mtcars))) +
  theme_classic(base_size = 16)

Cost less than 1 second

library(ggplot2)
library(ggrepel)
ggplot(mtcars) +
  geom_point(aes(wt, mpg), color = 'red') +
  geom_text(aes(wt, mpg, label = rownames(mtcars))) +
  theme_classic(base_size = 16)

speed up the algorithm

In #23 @hadley said:

I think the easiest way to avoid the O(n^2) computation is to divide the plot into a grid, and then only check the current and adjacent cells for overlaps. You can either do this roughly by hand (doing e.g. an 8 x 8 grid), or use something more complicated like a quadtree. Alternatively, you could do the full n x n sweep to build up a list of neighbours, but only update it (say) every 100 iterations.

Another thing you could do to make life a little easier would be to parameterise by iteration time (i.e. number of seconds) rather than number of iterations.

I hope to address this issue before #48 and #20.

Don't document internal functions

e.g. everything in repel_boxes.cpp. You can suppress documentation generation (while keeping the comments so you can read them) with @noRd

Error in match(x, table, nomatch = 0L) : attempt to apply non-function

Any ideas about that error?

ggplot(mtcars) +

  • geom_point(aes(wt, mpg), color = 'red') +
    
  • geom_text_repel(aes(wt, mpg, label = rownames(mtcars))) +
    
  • theme_classic(base_size = 16)
    
    Error in match(x, table, nomatch = 0L) : attempt to apply non-function

R version 3.2.3 (2015-12-10)
Platform: i386-w64-mingw32/i386 (32-bit)
Running under: Windows 7 x64 (build 7601) Service Pack 1

locale:
[1] LC_COLLATE=Greek_Greece.1253 LC_CTYPE=Greek_Greece.1253 LC_MONETARY=Greek_Greece.1253 LC_NUMERIC=C
[5] LC_TIME=Greek_Greece.1253

attached base packages:
[1] grid stats graphics grDevices utils datasets methods base

other attached packages:
[1] ggrepel_0.3 easyGgplot2_1.0.0 plyr_1.8.3 scales_0.3.0 ggplot2_1.0.1

loaded via a namespace (and not attached):
[1] Rcpp_0.12.1 digest_0.6.8 MASS_7.3-45 gtable_0.1.2 magrittr_1.5 stringi_0.5-5 reshape2_1.4.1
[8] proto_0.3-10 tools_3.2.3 stringr_1.0.0 munsell_0.4.2 colorspace_1.2-6

add "seed" argument to request specific seed

If I call set.seed() prior to using geom_text_repel, I get the same layout every time as I would expect.

However, if I am using grid.arrange() (from package gridExtras) to render multiple ggplots that include geom_text_repel, then if I change the parameters (such as nudge and force) in one plot, it may result in a different layout for the other plot(s). I assume this is because rendering the first plot may take a different number of iterations depending on the settings, resulting in the RNG starting in a different place when it is time to render the next plot.

For example, if I do this:
grid.arrange(p1, p2, ncol = 2)

Then changing the parameters in p1 changes the layout in p2.

This is a problem because sometimes I want a particular seed value because it produces a "better" (as subjectively determined by the beholder) layout.

This would be avoided if I could specify the seed value to geom_text_repel directly as an argument.

Suggestion: implement "angle" as in geom_text

This can be useful when text is crowded. ggplot2 itself is not consistent with angle as it is ignored by geom_label but obeyed by geom_text. I think that this can be tagged as low priority.

geom_text_repel when using size aesthetic

In cases where there is a size aesthetic mapping, points might become quite large in a scatter plot. When there is no need for repelling, the labels may overlap with their corresponding points.
I used to use hjust/vjust with (geom_text) to correct that. What can I do now?

repel only data points with a value

would it be possible to repel only a subset of data points, i.e. only the ones with a value in the corresponding column?
I just wish to avoid the following situation:
ggplot avec repel.pdf
Instead, it would be nice to get rid of the unwanted connecting lines and just keep the ones connected to data labels. I know you talked a bit about that in #15 by saying that the user should choose which point he wants to label, however I don,t know how to do that either :)

thanks a lot for your help and most of all thank you so much for this awesome package!

labels should not overlap unlabeled data points

Here's an example:

library(ggplot2)
library(dplyr)
library(ggrepel)

best_in_class <- mpg %>% 
  group_by(class) %>% 
  filter(row_number(desc(hwy)) == 1)

ggplot(mpg, aes(displ, hwy)) + 
  geom_point(aes(colour = class)) + 
  ggrepel::geom_label_repel(aes(label = model), data = best_in_class)

image

Diane Cook says:

the labels obscure the points. There is plenty of white space in this plot to shift them and allow a transparent line pointer

Multiple labels of one point

I just came across the following and don"t know if I'm doing something wrong or if it's some sort of bug in the package.

What I want is a label for one point in a plot. What I did is

library(ggplot2)
library(ggrepel)

x <- -10:10
y <- x^2
l <- paste(round(x, 2), round(y, 2), sep = ", ")

df <- data.frame(x = x, y = y, l = l)

h <- 5

plt <- ggplot(df, aes(x,y)) + 
  geom_line(aes(x, y))

p1 <- plt + geom_point(aes(x = x[h], y = y[h])) +
  geom_label(aes(x = x[h], y = y[h], label = as.character(l[h])))

p2 <- plt + geom_point(aes(x = x[h], y = y[h])) +
      geom_label_repel(aes(x = x[h], y = y[h], label = as.character(l[h])))

p1 shows just one label as expected while p2 shows 21 labels, i.e. as many labels as x is long.

geoms should be aware of the plotting area

Issue #3 brought my attention to the fact that the ggrepel geoms are currently unaware of the available plotting area created by previous layers.

Instead, the ggrepel geoms assume that the plotting area is defined by the data provided to them. They should instead get the dimensions of the plotting area elsewhere, i.e. from the plot objects. I don't know how to implement this right now.

Provide Minimum Length Option for Segment Drawing

From the example in the vignette, even labels which have an obvious connection to only one point have a segment drawn linking the label to the point, for example Toyota Corolla. Can there be an option to not draw the segments for these points where the label is close enough not to need it?

Can't compile ggrepel in Win 7

Here is what I got back:

  • installing source package 'ggrepel' ...
    ** libs
    g++ -m32 -I"C:/PROGRA1/R/R-321.3/include" -DNDEBUG -I"C:/Users/gallagher/Documents/R/win-library/3.2/Rcpp/include" -I"d:/RCompile/r-compiling/local/local323/include" -O2 -Wall -mtune=core2 -c RcppExports.cpp -o RcppExports.o
    g++: not found
    make: *** [RcppExports.o] Error 127
    Warning: running command 'make -f "C:/PROGRA1/R/R-321.3/etc/i386/Makeconf" -f "C:/PROGRA1/R/R-321.3/share/make/winshlib.mk" SHLIB_LDFLAGS='$(SHLIB_CXXLDFLAGS)' SHLIB_LD='$(SHLIB_CXXLD)' SHLIB="ggrepel.dll" OBJECTS="RcppExports.o repel_boxes.o"' had status 2
    ERROR: compilation failed for package 'ggrepel'
  • removing 'C:/Users/gallagher/Documents/R/win-library/3.2/ggrepel'
    Quitting from lines 18-21 (repel.Rmd)
    Error: Command failed (1)

Execution halted

Anything strike you as funny? Appears I am missing something but don't believe it's telling me just what. Thanks for the help

Mike Gallagher
[email protected]

Recompute after resizing

@hadley said "did you consider doing the repulsion in the grob so it can recompute as the plot changes size?"

I think this is a great idea, but I don't know how to implement it.

I've been reading about grid and grobs, but I have a long way to go before I figure this out. I would be very grateful for any help with this issue.

Here's a blog post that might help to get started:

Each grob needs to be able to access the positions of other grobs within the update callback functions. My first impression is that this is not easy.

Error in as.vector(y) : attempt to apply non-function

Hi, I've just installed the extensions and I have an error when running geom_label_repel. I've updated my R and Rstudio, but still with the same problem. pls, any ideas how to fix this? Thanks

 library(ggplot2)
 library(ggrepel)
 cars <- mtcars
 
 cars$name <- row.names(mtcars)
 row.names(cars) <- NULL
 
 ggplot(cars) +
     geom_point(aes(x = hp,
                    y = mpg,
                    color = wt,
                    size = disp)) +
     geom_label_repel(aes(x = hp, 
                          y = mpg,
                          label = name))
Error in as.vector(y) : attempt to apply non-function

nudge options should be aesthetics

In the help text you have this example:

p + geom_text_repel(nudge_x = ifelse(mtcars$cyl == 6, 1, 0),
                    nudge_y = ifelse(mtcars$cyl == 6, 8, 0))

It would seem that this could better be expressed as:

p + geom_text_repel(aes(nudge_x = ifelse(cyl == 6, 1, 0),
                        nudge_y = ifelse(cyl == 6, 8, 0))

This also has the important advantage of removing a dependency on the environment, which means you could, for example, return the resulting plot from a function and still have it work.

Handling of empty strings

I think it would be best to handle "" as a special case, not drawing segments and empty boxes in this case. It would also help in cases when one wants not to label some observations but still have the observations themselves, e.g., points on the plot, as objects to repel from.

text_repel
label_repel

Lines over or under label

Not sure this is a bug or just my preference, but I noticed that in a few instances the lines connecting the labels to their points are plotted over other labels, instead of behind. It may be a matter of preference but a consistent approach seems best and it's easier to imagine a line continuing under a label than trying to guess the letter covered by a line. Thanks -- great package solves a real problem for R stat graphics

stop labelling when point density is too high (feature proposal)

first of all, I would like to thank you a lot for this fantastic package!
Labelling has been a trouble for a long time, and it is great to see a nice implementation that actually works well.

Not an issue, but a feature proposal.
It would be nice to add a minimal point density where labelling could be performed. Indeed, beyond a certain density, it is impossible to do a good job and adding labels could be just skipped.

Concrete case: volcano plots, which are false discovery rate as a function of gene expression.
rplot

Of course, the shape of the volcano provides information on the actual analysis, but which genes are where is the real question. In a shiny app, thanks to @wch we can now plot use ggplot2 and interactively zoom in. In the static example above, I displayed the gene symbols only for the more extreme cases and it is still messy. But, if we display those names only when repelling could be nicely performed, we could stil zoom in a region with unknown gene symbols and see them appearing.
Of course, a threshold need to be determined by data density, but how? Divide the plot area by regions and estimate the density inside? Sorry, I cannot really help for the implementation.

Thanks again for a great package!

Use structs/pairs instead of NumericVectors

I suspect you could get a considerable performance improvement by switching from (e.g)

double euclid(NumericVector p1, NumericVector p2) {
  double retval = 0;
  int n = p1.size();
  for (int i = 0; i < n; i++) {
    retval += pow(p2[i] - p1[i], 2);
  }
  return sqrt(retval);
}

to

struct Point {
  double x, y
};

double euclid(const Point& p1, const Point& p2) {
  return sqrt((p1.x - p2.x) ^ 2 + (p1.y - p2.y) ^ 2);
}

Note that I you might also be able to drop the square root, by instead squaring the distance that you're comparing with. And it would definitely be more efficient than later on re-squaring, like in repel_force().

Generally you'll get better performance with C++ data structures than with R ones.

Avoid labels intersecting segments

Would it be possible to avoid segments intersecting other labels as in this example:

image

It seems you are using a force directed layout, which IIRC does not really concern itself with the segments but only the nodes. One solution might be to ramp up the force when intersections are detected?

Detecting intersections for all labels may be just way too computationally expensive, so feel free to close issue if not feasible! (Thanks for fantastic package!)

Repel only upwards and sideways (not down)?

I have some points that needs labeling and they are sometimes close to 0 on yaxis, and I have ylim as c(0, 10), so some labels are getting pushed down below zero and are not visible.

Example, here my lims are c(15, 25):

set.seed(1)
ggplot(mtcars, aes(wt, mpg)) +
  geom_point(color = 'red') +
  geom_text_repel(aes(label = rownames(mtcars))) +
  scale_y_continuous( limits = c(15, 25))

In below output, I need "Maserati Bora" to be above 15.

gg

Recommend Projects

  • React photo React

    A declarative, efficient, and flexible JavaScript library for building user interfaces.

  • Vue.js photo Vue.js

    ๐Ÿ–– Vue.js is a progressive, incrementally-adoptable JavaScript framework for building UI on the web.

  • Typescript photo Typescript

    TypeScript is a superset of JavaScript that compiles to clean JavaScript output.

  • TensorFlow photo TensorFlow

    An Open Source Machine Learning Framework for Everyone

  • Django photo Django

    The Web framework for perfectionists with deadlines.

  • D3 photo D3

    Bring data to life with SVG, Canvas and HTML. ๐Ÿ“Š๐Ÿ“ˆ๐ŸŽ‰

Recommend Topics

  • javascript

    JavaScript (JS) is a lightweight interpreted programming language with first-class functions.

  • web

    Some thing interesting about web. New door for the world.

  • server

    A server is a program made to process requests and deliver data to clients.

  • Machine learning

    Machine learning is a way of modeling and interpreting data that allows a piece of software to respond intelligently.

  • Game

    Some thing interesting about game, make everyone happy.

Recommend Org

  • Facebook photo Facebook

    We are working to build community through open source technology. NB: members must have two-factor auth.

  • Microsoft photo Microsoft

    Open source projects and samples from Microsoft.

  • Google photo Google

    Google โค๏ธ Open Source for everyone.

  • D3 photo D3

    Data-Driven Documents codes.