Coder Social home page Coder Social logo

druidplugin's Introduction

UPDATE

We are working to refresh this codebase. Please see the milestones for current estimated dates and related issues / projects for planned work.

Grafana Version Compatibility:

Druid plugin version 0.0.3 and below are supported for Grafana: 3.x.x

Druid plugin 0.0.4 and above are supported for Grafana: 4.x.x

For latest versions, see https://github.com/grafadruid/druid-grafana

Grafana plugin for Druid real-time OLAP database

Screenshot Screenshot Screenshot

Status

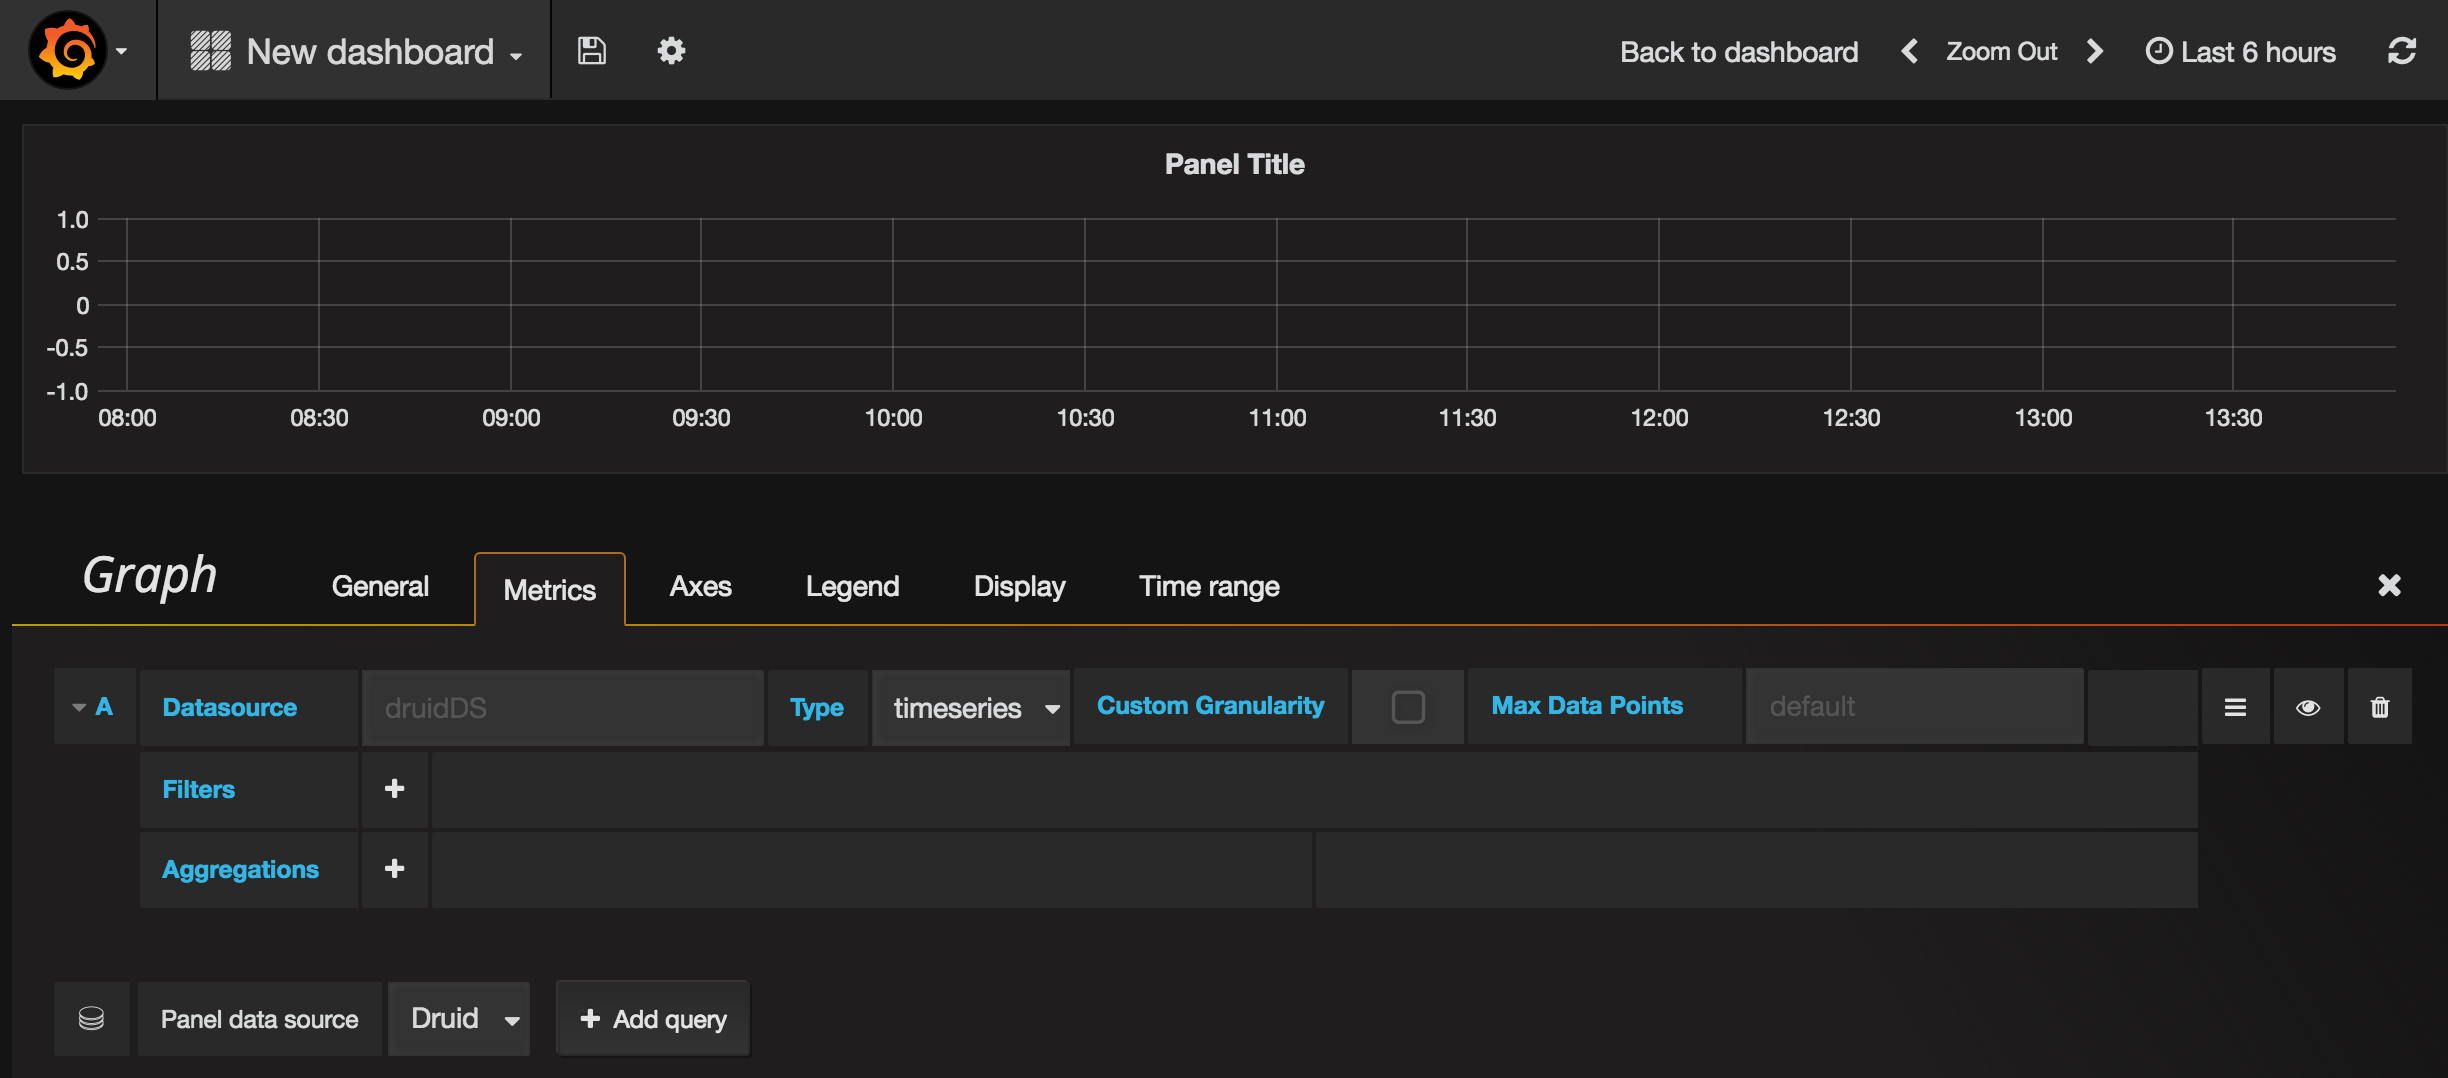
This plugin is built on the top of an existing Druid plugin (https://github.com/grafana/grafana-plugins) which used to work on older Grafana versions. With the UI changes done on Grafana-3.0 the existing plugin stopped working. Lot of changes have been made to have it work on Grafana 3.0. It supports timeseries, group by, topN and Select queries.

Lot of features might still not be implemented. Your contributions are welcome.

Plugin development history

This plugin was originally developed by Quantiply Corporation (Supported for Grafana versions < 2.5): https://github.com/grafana/grafana-plugins/tree/master/datasources/druid

This plugin was further enhanced by Carl Bergquist (grafana/grafana#3328) (to support it on Grafana version 2.5 & 2.6).

I cloned the source from the Pull Request by Carl Bergquist and changed the plugin to have it work on Grafana-3.0.

All the credits for the original code and enahcement to 2.5 goes to Quantiply and Carl Bergquist.

Opensourcing all the changes done to the plugin to support Grafana-3.0.

druidplugin's People

Stargazers

 avatar  avatar  avatar  avatar  avatar  avatar  avatar  avatar  avatar  avatar  avatar  avatar  avatar  avatar  avatar  avatar  avatar  avatar  avatar  avatar  avatar  avatar  avatar  avatar  avatar  avatar  avatar  avatar  avatar  avatar  avatar  avatar  avatar  avatar  avatar  avatar  avatar  avatar  avatar  avatar  avatar  avatar  avatar  avatar  avatar  avatar  avatar  avatar  avatar  avatar  avatar  avatar  avatar  avatar  avatar  avatar  avatar  avatar  avatar  avatar  avatar  avatar  avatar  avatar  avatar  avatar  avatar  avatar  avatar  avatar  avatar  avatar  avatar  avatar  avatar  avatar  avatar  avatar  avatar  avatar  avatar  avatar  avatar  avatar  avatar  avatar  avatar  avatar  avatar  avatar  avatar  avatar  avatar  avatar  avatar  avatar  avatar  avatar  avatar  avatar

Watchers

 avatar  avatar  avatar  avatar  avatar  avatar  avatar  avatar  avatar  avatar  avatar  avatar  avatar  avatar  avatar  avatar  avatar  avatar  avatar  avatar

druidplugin's Issues

Don't work repeating panels with a multivalue variables

I want to filter request by some fields value in every panel. But in query inspector i see multiple value for every filter expression:
filter:Object
dimension:"domain"
pattern:"(avtovzglyad.ru|car.ru)"
type:"regex"
value:"${domains}"

Question - Does this support logical filters?

Thanks for creating this plugin! I have a question regarding filters.
From what I see, we can "add tag" to add extra filters. Does this refer to an "and" type between each filter? Is there any way we can specify other logical filters like "OR" or "NOT".

Is templating query working with druid datasource?

Hi, I'm trying to use druid datasource in dashboard templating. But no matter how I configure the query options, I always got the following error message:

Templating
Template variables could not be initialized: t.metricFindQuery is not a function

Is templating supported by druid plugin? If true, then how can I properly configure the query options? Any documents or suggestions are appreciated.

Cannot draw points when using 'select' query type

Hello!

I'm trying to draw graph-panel using 'select' query.

image

As you can see above, i checked e2e latency as a metric which ranges from 1~1000.
However, no points appear.

Any documents or suggestions are appreciated.

The 'null' value can't be filter

When you have a dimension without value it is null, but if you try to filter it using the UI it try to filter to the STRING "null" instead of null value.

add build scripts

Please add Grunt or Gulp build scripts. I need the reliable build system so I can contribute to the project.

Roadmap OR feature list

Is there a roadmap or list of features planned for this plugin with a timeline?

I am interested in Alerting and Stats extension capabilities

Thanks
Shyam

Druidplugin does not draw points

The druidplugin does not draw points. I can choose the a druid datasource and set select to type and select a dimension but no points appear on the chart. What some things I should check?

running grafana 4.5.2
druidplugin src version is 0.0.4

Issue with group by query type

Hello,
I am trying to run a group-by query in Grafana. I used a pie chart to display data and granularity of 15 minutes. Ideally it should create a pie chart of the given group-by column with distinct elements in it and it should get updated every 5 second (refresh interval is 5 secs) for every 15 minutes interval like what happens in time series query with 15 mins granularity.
But the data is not getting updated somehow. Can you help me to identify what the problem is?
Sundaram

Druid plugin doesn't work on latest Grafana master

I built Grafana from master(0c31c7b10619088784bd28b31a4948e43d05d2bf) and installed Druid plugin as usual(putting it under /data/plugins folder), however when I tried to save Druid setting, following error occurred:
error
I checked Grafana code which says

// plugin module needs to export a constructor function named Datasource

But in module.d.ts, DruidDatasource is explicitly exported as Datasource, so not sure what happened... please help!

Is this project being maintained?

I was wondering if this project is being actively maintained.

I see the occasional direct commit to master (which look like they are fixing the issues of an individual user who has commit access).

I would like to see a more active community around this very useful plugin. There is still a lot of untapped potential.

Autofill is throwing errors

When I try and autofill, I get this error.

screen shot 2017-09-18 at 10 30 54 pm

To fix this, you will need to replace "target.datasource" to "target.druidDS" in https://github.com/grafana-druid-plugin/druidplugin/blob/master/src/datasource.js#L78

error on Timeseries with Grafana 4.1.2

Hi,
I've update Grafana from 3 to 4.1.2 .
After that, I've had issues that I've seen was fixed recently.
My charts also uses Timeseries and here I've the error described below.

Error title:
Cannot read property 'toString' of undefined

Error description:
TypeError: Cannot read property 'toString' of undefined at a.isMsResolutionNeeded (http://10.20.50.249:3000/public/app/boot.6d63bd8b.js:21:3590) at new a (http://10.20.50.249:3000/public/app/boot.6d63bd8b.js:21:934) at a.timeSeriesHandler (http://10.20.50.249:3000/public/app/boot.6d63bd8b.js:18:29092) at http://10.20.50.249:3000/public/app/boot.6d63bd8b.js:18:28273 at Array.map (native) at a.getSeriesList (http://10.20.50.249:3000/public/app/boot.6d63bd8b.js:18:28246) at b.onDataReceived (http://10.20.50.249:3000/public/app/boot.6d63bd8b.js:19:3247) at f.emit (http://10.20.50.249:3000/public/app/boot.6d63bd8b.js:52:2928) at a.emit (http://10.20.50.249:3000/public/app/boot.6d63bd8b.js:52:5256) at b.handleQueryResult (http://10.20.50.249:3000/public/app/boot.6d63bd8b.js:46:4942)

Metrics are not selectable

Having a little issue getting this plugin working. I am running grafana 5.2.4
Metrics are not selectable or typing the metrics in by hand still does not select them.
The dimensions though are selectable and usable. My charts currently are empty and unable to draw lines. What are some things I can check to get this plugin working?

Doc needed for the approxhistogramfold option

I couldn't get the quantiles data i want to with the post aggregation option and "approxhistogramfold" aggregator. the panel returns with no data points. Is there a usage guide that can help me with this ?
Also i see that "fn":+ is added to the post aggregator is that expected ?
screen shot 2017-06-27 at 10 18 06 am

Can add approxHistogramFold to Aggregators

when try to add approxHistogramFold tag to Aggregators at QueryEditor, get follow erxception:
boot.1649cbaa.js:36 TypeError: this.validateSimpleAggregator is not a function
at Object.DruidQueryCtrl.validateApproxHistogramFoldAggregator as approxHistogramFold
at DruidQueryCtrl.validateTarget (query_ctrl.ts:546)
at DruidQueryCtrl.addAggregator (query_ctrl.ts:257)
at fn (eval at compile (boot.1649cbaa.js:38), :4:269)
at b (boot.1649cbaa.js:36)
at e (boot.1649cbaa.js:38)
at n.$eval (boot.1649cbaa.js:36)
at n.$apply (boot.1649cbaa.js:36)
at HTMLAnchorElement. (boot.1649cbaa.js:38)
at HTMLAnchorElement.dispatch (boot.1649cbaa.js:33)

Decrease minimal granularity

hi!

in our company we use druid for realtime monitoring with 1s interval. As i understand, current minimal granularity is 1m. How about to change it? I could do it by myself, but my web development skills is ugly :C

Support SQL of the upcoming Druid 0.10

The upcoming Druid 0.10 supports SQL query. I would like to support the feature.
http://druid.io/docs/0.10.0-rc1/querying/sql.html

The server side SQL is more promising than the client side PlyQL and Plywood. I'm hoping the SQL syntax is expressive enough to support the full capability of the native Druid queries.

If so, we will not have to write filters, aggs, post-aggs, time bucketing, or switching topN for single dimension and groupBy for multi dimensions, etc, etc.

Can provide some samples or documents

I spent some time, but only fixed the timeseries count in the graph
Can provide some samples or documents
For example , how to connect singlestat panel and druid , how to use topn in this plugin …

Grafana 4.0 support

First, thank you for the amazing plugin!

Right now this plugin does not seem to support Grafana 4.0. It gave me the following JS error when trying to add a query:

TypeError: _.pluck is not a function
    at getMetricNames (http://xxx/public/plugins/abhisant-druid-datasource/datasource.js?bust=1482719877684:316:24)
    at DruidDatasource._doQuery (http://xxx/public/plugins/abhisant-druid-datasource/datasource.js?bust=1482719877684:120:25)
    at eval (http://xxx/public/plugins/abhisant-druid-datasource/datasource.js?bust=1482719877684:105:27)
    at Array.map (native)
    at DruidDatasource.query (http://xxx/public/plugins/abhisant-druid-datasource/datasource.js?bust=1482719877684:91:38)
    at eval (http://xxx/public/app/plugins/datasource/mixed/datasource.js?bust=1482719877684:4:494)
    at g (http://xxx/public/app/boot.fdf40765.js:38:29381)
    at http://xxx/public/app/boot.fdf40765.js:38:29553
    at o.$eval (http://xxx/public/app/boot.fdf40765.js:39:5194)
    at o.$digest (http://xxx/public/app/boot.fdf40765.js:39:3680)

Custom templates do not work in Graph -> Matrics

I created a custom template variable named 'items' with values 'url' and 'ip'. And I wanted to use it in dimension of matrics in order to allow the graph to dynamically display different information. But it does not work.
However ,the template variable in title works well.

The panel JSON like below.

{
"aliasColors": {},
"bars": true,
"dashLength": 10,
"dashes": false,
"datasource": "druid_test",
"fill": 1,
"id": 2,
"legend": {
"alignAsTable": true,
"avg": false,
"current": false,
"max": false,
"min": false,
"rightSide": true,
"show": true,
"total": false,
"values": false
},
"lines": false,
"linewidth": 1,
"links": [],
"nullPointMode": "null",
"percentage": false,
"pointradius": 5,
"points": false,
"renderer": "flot",
"repeat": null,
"seriesOverrides": [],
"spaceLength": 10,
"span": 12,
"stack": false,
"steppedLine": false,
"targets": [
{
"aggregators": [
{
"fieldName": "counts",
"name": "counts",
"type": "longSum"
}
],
"currentAggregator": {
"type": "count"
},
"currentFilter": {
"type": "selector"
},
"currentPostAggregator": {
"fn": "+",
"type": "arithmetic"
},
"currentSelect": {
"dimension": "",
"metric": ""
},
"customGranularity": "all",
"dimension": "$items",
"druidDS": "url_ip_test",
"druidMetric": "counts",
"errors": {
"aggregators": "You must supply at least one aggregator"
},
"limit": 10,
"queryType": "topN",
"refId": "A",
"shouldOverrideGranularity": true
}
],
"thresholds": [],
"timeFrom": "$timeRange",
"timeShift": null,
"title": "[[items]] top10",
"tooltip": {
"shared": false,
"sort": 0,
"value_type": "individual"
},
"type": "graph",
"xaxis": {
"buckets": null,
"mode": "series",
"name": null,
"show": false,
"values": [
"total"
]
},
"yaxes": [
{
"format": "short",
"label": null,
"logBase": 1,
"max": null,
"min": null,
"show": true
},
{
"format": "short",
"label": null,
"logBase": 1,
"max": null,
"min": null,
"show": true
}
]
}

automatically downsample the Custom Granularity

The custom granularity is fixed, is there any option to increase the granularity automatically when the query range is large ? such as 7 days.

This is helpful to increase the query speed.

I know we can change the custom granularity by hand, but we want to hide the detail for the users.

Plugin doesn't send any requests to druid

I tried installing the plugin on grafana 5.x and grafana 4.x, same results.

Issue:
When creating a simple query on a simple dataset, e.g. timeseries with hourly aggregate which is a sum of one dimension which is just a count, there are no requests made to the druid server.
When inspecting what happens in the code, it seems that in most of the input combinations (query types, filters, aggregations) this if function doesn't pass because target.aggregators isn't defined at the point of execution.

I tried sending requests manually (not through grafana) and druid sends normal responses.

The only query that triggers a request to druid is the select query. All others trigger weird query requests.

This is one that doesn't trigger a request at all (notice the circle thingy in query inspector):
image

And here's one that triggers a "TopN" query type request when I selected timeseries query with a filter and count aggregator:
image

Project status ? looking for new maintainers ?

Hello,

Despite Superset is there, we tend to believe Grafana is a better fit for system-wide dashboarding needs.
This plugin then looks required, OTOH, we can see there are issues and merge requests awaiting and not much traction.
Did you stopped using Druid ? or stopped using Grafana ? Is there a good reason about it we should know ? :)
Otherwhise, are you open to give maintainership to anyone else so issues and pull requests could be processed ?
Thank you for your efforts :)

cc @abhisant @Gauravshah @pranit22

Post Aggregations Queries have disappeared.

In at least Grafana version 4.4.2+ (tested on 4.6.0 as well) the following issue seems to have resurfaced: #1

I am running the Druid plugin version 0.0.4

This issue is not present in Grafana version 4.2.0

Am I possibly missing a toggle to enable this feature?

Documentation on how to build queries

Hello there!

It's rather not an issue but a question...

I've failed to find out any comprehensive documentation, so I would like to ask here to clarify if functionality hasn't been implemented yet or it's me doing something wrong...

  1. For me it seems that nothing except "select" query type is working, any other like "TopN" or "Timeseries" show nothing, in query inspector I have nothing but a rotating wheel.
  2. With "Select" query type I was able to get some aggregated values (seems to be more or less valid), but this happens only if I set "mode" for X-Axis to "Series" or "Histogram", no luck with "Time".
  3. A bit unclear "Threshold" setting in query builder, if I understand it correct it defaults to 5 which causes 5 instances of the same value for every object recieved from druid, setting it equal to 1 gives more reasonable result, but still want to understand what's under the hood of it.

Please elaborate. Many thanks!

release versions should align with Grafana

We need to release a 3.x, 4.x, and 5.x tag of this library to align with Grafana. One can maintain a 3.x, 4.x, and 5.x branch if required, although we may want to freeze the 3.x branch soon.

Recommend Projects

  • React photo React

    A declarative, efficient, and flexible JavaScript library for building user interfaces.

  • Vue.js photo Vue.js

    🖖 Vue.js is a progressive, incrementally-adoptable JavaScript framework for building UI on the web.

  • Typescript photo Typescript

    TypeScript is a superset of JavaScript that compiles to clean JavaScript output.

  • TensorFlow photo TensorFlow

    An Open Source Machine Learning Framework for Everyone

  • Django photo Django

    The Web framework for perfectionists with deadlines.

  • D3 photo D3

    Bring data to life with SVG, Canvas and HTML. 📊📈🎉

Recommend Topics

  • javascript

    JavaScript (JS) is a lightweight interpreted programming language with first-class functions.

  • web

    Some thing interesting about web. New door for the world.

  • server

    A server is a program made to process requests and deliver data to clients.

  • Machine learning

    Machine learning is a way of modeling and interpreting data that allows a piece of software to respond intelligently.

  • Game

    Some thing interesting about game, make everyone happy.

Recommend Org

  • Facebook photo Facebook

    We are working to build community through open source technology. NB: members must have two-factor auth.

  • Microsoft photo Microsoft

    Open source projects and samples from Microsoft.

  • Google photo Google

    Google ❤️ Open Source for everyone.

  • D3 photo D3

    Data-Driven Documents codes.