Coder Social home page Coder Social logo

timkpaine / ipydagred3 Goto Github PK

View Code? Open in Web Editor NEW
76.0 5.0 7.0 3.49 MB

ipywidgets library for drawing directed acyclic graphs in jupyterlab using dagre-d3

License: Apache License 2.0

CSS 2.05% Python 46.88% JavaScript 42.38% Makefile 7.94% Shell 0.76%
jupyter jupyterlab jupyterlab-extension graphviz graph python d3 dagre dagre-d3 ipywidgets

ipydagred3's Introduction

ipydagred3

ipywidgets library for drawing directed acyclic graphs in jupyterlab using dagre-d3

Build Status codecov PyPI PyPI npm Binder

Installation

You can install using pip:

pip install ipydagred3

Features

  • Dynamically create and modify graphs from python
  • Change color, shape, tooltip, etc
  • Click events (click on node or edge and get event in ipywidget indicating source, good for node inspector tools)

Tooltips and Click events

Examples

Network example from the first gif Network Example

Tooltip Example from the second gif Tooltip Example

ipydagred3's People

Contributors

dependabot[bot] avatar joseberlines avatar mark-gerarts avatar timkpaine avatar

Stargazers

 avatar  avatar  avatar  avatar  avatar  avatar  avatar  avatar  avatar  avatar  avatar  avatar  avatar  avatar  avatar  avatar  avatar  avatar  avatar  avatar  avatar  avatar  avatar  avatar  avatar  avatar  avatar  avatar  avatar  avatar  avatar  avatar  avatar  avatar  avatar  avatar  avatar  avatar  avatar  avatar  avatar  avatar  avatar  avatar  avatar  avatar  avatar  avatar  avatar  avatar  avatar  avatar  avatar  avatar  avatar  avatar  avatar  avatar  avatar  avatar  avatar  avatar  avatar  avatar  avatar  avatar  avatar  avatar  avatar  avatar  avatar  avatar  avatar  avatar  avatar  avatar

Watchers

 avatar  avatar  avatar  avatar  avatar

ipydagred3's Issues

node colores not showing when code is imported into another jupyter notebook

I have a function like this:

def graph_of_claims(claims): ... ... return graphwidget

when this function is run in a jupyter notebook with voila the nodes appear with the corresponding color

but:

when I import that function into another jupyter notebook
from pyutils import graph_of_claims as mygraph

and run voila the graph is shown without colours.

some idea?

Allow for different text when hovering over a node.

Hi.

I am experimenting with ipydagred3 and it is really great. so little code and "voila" integrated in Jupyter.

Would it be possible that when hovering over the nodes in the graph a different text can be displayed that the text contained in the node itself (to offer the user extra information rather)

Thanks.

Choose graph direction

Is your feature request related to a problem? Please describe.
I'd like to produce a graph with left-to-right direction. In dagre, this is achieved using layout option rankdir="LR" (docs). Can you please provide an example usage (if this is already possible)? If not, then this is a feature request.

Describe the solution you'd like
I noticed your javascript has these lines:
https://github.com/timkpaine/ipydagred3/blob/d07e15e0c0de02761469d727b33f87a1e0d686ba/js/src/view.js#L45-L51C8

So I tried initializing the graph like:

import ipydagred3 as dd3
graph = dd3.Graph(attrs={"rankdir": "LR"})

However, this did not have the desired behavior.

Describe alternatives you've considered
Following your data model, I think it should also be possible to set the attribute directly like graph.attrs["rankdir"] = "LR".

Additional context
None.

how to plot from within a function

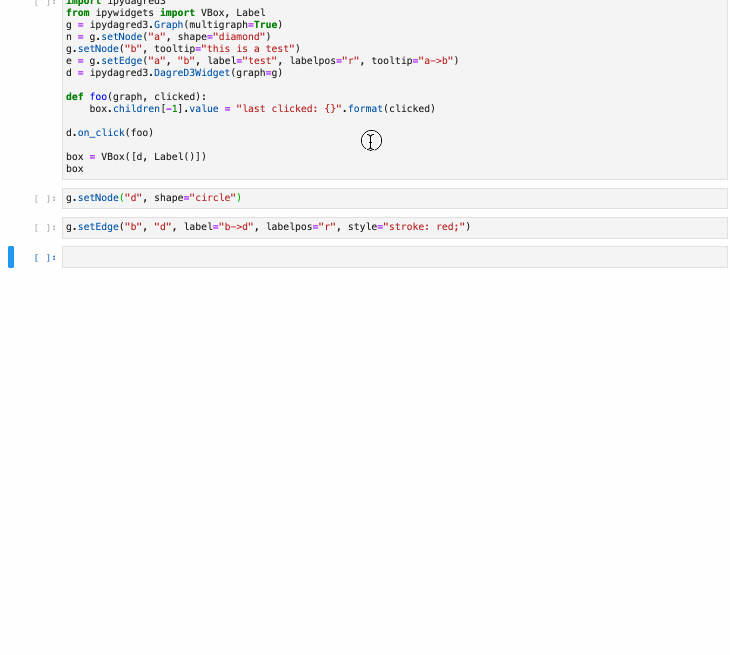
When writing the example code showed in GitHub within a function and calling the function jupyter notebook disconnects from kernel all the time. Does it have to do with ipydagred3?

here the code:

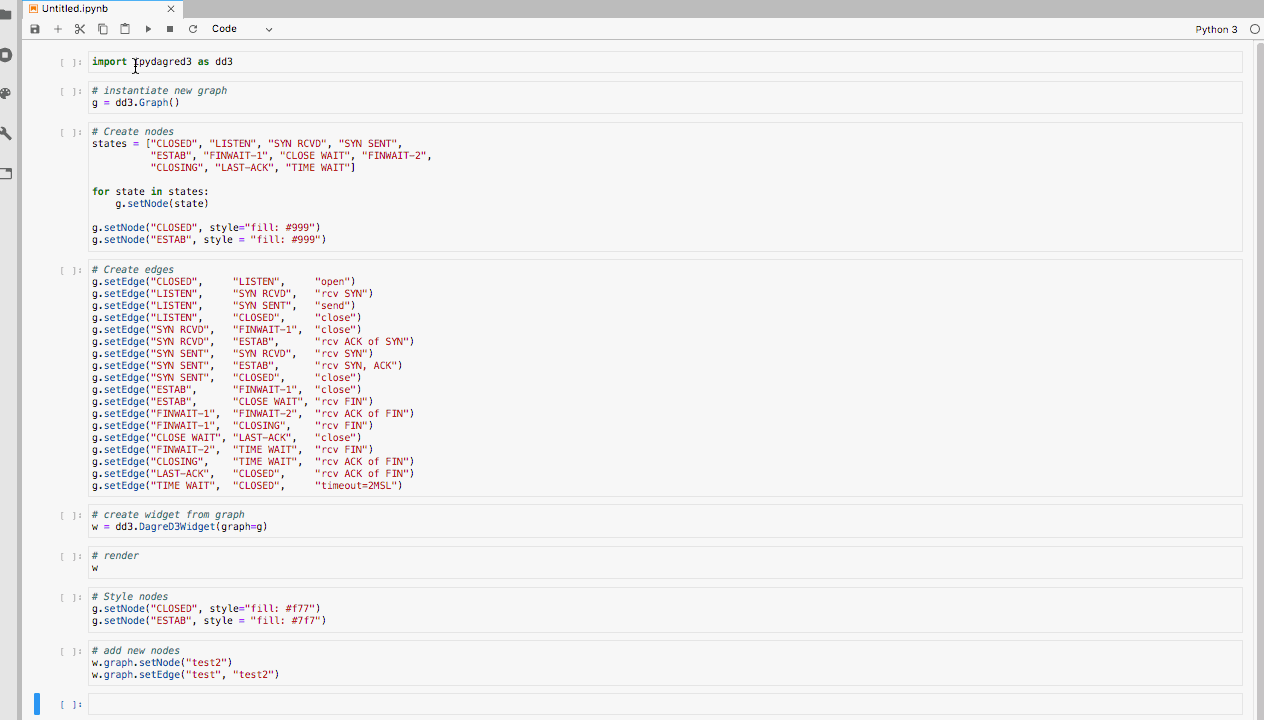
# Instantiate new graph
def doit():

    g = dd3.Graph()

    states = ["CLOSED", "LISTEN", "SYN RCVD", "SYN SENT",
              "ESTAB", "FINWAIT-1", "CLOSE WAIT", "FINWAIT-2",
              "CLOSING", "LAST-ACK", "TIME WAIT"]

    for state in states:
        g.setNode(state)


    g.setEdge("CLOSED",     "LISTEN",     label="open")
    g.setEdge("LISTEN",     "SYN RCVD",   label="rcv SYN")
    g.setEdge("LISTEN",     "SYN SENT",   label="send")
    g.setEdge("LISTEN",     "CLOSED",     label="close")
    g.setEdge("SYN RCVD",   "FINWAIT-1",  label="close")
    g.setEdge("SYN RCVD",   "ESTAB",      label="rcv ACK of SYN")
    g.setEdge("SYN SENT",   "SYN RCVD",   label="rcv SYN")
    g.setEdge("SYN SENT",   "ESTAB",      label="rcv SYN, ACK")
    g.setEdge("SYN SENT",   "CLOSED",     label="close")
    g.setEdge("ESTAB",      "FINWAIT-1",  label="close")
    g.setEdge("ESTAB",      "CLOSE WAIT", label="rcv FIN")
    g.setEdge("FINWAIT-1",  "FINWAIT-2",  label="rcv ACK of FIN")
    g.setEdge("FINWAIT-1",  "CLOSING",    label="rcv FIN")
    g.setEdge("CLOSE WAIT", "LAST-ACK",   label="close")
    g.setEdge("FINWAIT-2",  "TIME WAIT",  label="rcv FIN")
    g.setEdge("CLOSING",    "TIME WAIT",  label="rcv ACK of FIN")
    g.setEdge("LAST-ACK",   "CLOSED",     label="rcv ACK of FIN")
    g.setEdge("TIME WAIT",  "CLOSED",     label="timeout=2MSL");

    widget = dd3.DagreD3Widget(graph=g)

    # Add some custom colors based on state
    g.setNode('CLOSED', style="fill: #f77")
    g.setNode('ESTAB', style="fill: #7f7")
    g.setNode('TIME WAIT', style="fill: #b8c79c")

    # Add new nodes
    g.setNode("test")
    g.setNode("test2")

    # Add new edges
    g.setEdge("test", "test2")
    
   return(widget)

mygraph= doit()
print(my graph)

this code would not output anything in voila.

Option to disable mousewheel zoom

Is your feature request related to a problem? Please describe.
I'd like the ability to create a graph widget where the zoom functionality is disabled. The motivation is that sometimes the user can accidentally trigger the zoom action, which can make the page more difficult to navigate. This option would render the graph more statically, though tooltips and click hooks would remain available.

Describe the solution you'd like
This could be a constructor argument (e.g., dd3.DagreD3Widget(zoom=False)), since this is not passed as a dagre graph attribute.

Describe alternatives you've considered
I'm not sure if there are alternative ways to disable zoom via javascript.

Recommend Projects

  • React photo React

    A declarative, efficient, and flexible JavaScript library for building user interfaces.

  • Vue.js photo Vue.js

    ๐Ÿ–– Vue.js is a progressive, incrementally-adoptable JavaScript framework for building UI on the web.

  • Typescript photo Typescript

    TypeScript is a superset of JavaScript that compiles to clean JavaScript output.

  • TensorFlow photo TensorFlow

    An Open Source Machine Learning Framework for Everyone

  • Django photo Django

    The Web framework for perfectionists with deadlines.

  • D3 photo D3

    Bring data to life with SVG, Canvas and HTML. ๐Ÿ“Š๐Ÿ“ˆ๐ŸŽ‰

Recommend Topics

  • javascript

    JavaScript (JS) is a lightweight interpreted programming language with first-class functions.

  • web

    Some thing interesting about web. New door for the world.

  • server

    A server is a program made to process requests and deliver data to clients.

  • Machine learning

    Machine learning is a way of modeling and interpreting data that allows a piece of software to respond intelligently.

  • Game

    Some thing interesting about game, make everyone happy.

Recommend Org

  • Facebook photo Facebook

    We are working to build community through open source technology. NB: members must have two-factor auth.

  • Microsoft photo Microsoft

    Open source projects and samples from Microsoft.

  • Google photo Google

    Google โค๏ธ Open Source for everyone.

  • D3 photo D3

    Data-Driven Documents codes.