Coder Social home page Coder Social logo

raghakot / keras-vis Goto Github PK

View Code? Open in Web Editor NEW
3.0K 73.0 665.0 150.2 MB

Neural network visualization toolkit for keras

Home Page: https://raghakot.github.io/keras-vis

License: MIT License

Python 100.00%
visualization keras deep-learning theano tensorflow neural-networks machine-learning

keras-vis's Introduction

Keras Visualization Toolkit

Build Status license Slack

keras-vis is a high-level toolkit for visualizing and debugging your trained keras neural net models. Currently supported visualizations include:

  • Activation maximization
  • Saliency maps
  • Class activation maps

All visualizations by default support N-dimensional image inputs. i.e., it generalizes to N-dim image inputs to your model.

The toolkit generalizes all of the above as energy minimization problems with a clean, easy to use, and extendable interface. Compatible with both theano and tensorflow backends with 'channels_first', 'channels_last' data format.

Quick links

Getting Started

In image backprop problems, the goal is to generate an input image that minimizes some loss function. Setting up an image backprop problem is easy.

Define weighted loss function

Various useful loss functions are defined in losses. A custom loss function can be defined by implementing Loss.build_loss.

from vis.losses import ActivationMaximization
from vis.regularizers import TotalVariation, LPNorm

filter_indices = [1, 2, 3]

# Tuple consists of (loss_function, weight)
# Add regularizers as needed.
losses = [
    (ActivationMaximization(keras_layer, filter_indices), 1),
    (LPNorm(model.input), 10),
    (TotalVariation(model.input), 10)
]

Configure optimizer to minimize weighted loss

In order to generate natural looking images, image search space is constrained using regularization penalties. Some common regularizers are defined in regularizers. Like loss functions, custom regularizer can be defined by implementing Loss.build_loss.

from vis.optimizer import Optimizer

optimizer = Optimizer(model.input, losses)
opt_img, grads, _ = optimizer.minimize()

Concrete examples of various supported visualizations can be found in examples folder.

Installation

  1. Install keras with theano or tensorflow backend. Note that this library requires Keras > 2.0

  2. Install keras-vis

From sources

sudo python setup.py install

PyPI package

sudo pip install keras-vis

Visualizations

NOTE: The links are currently broken and the entire documentation is being reworked. Please see examples/ for samples.

Neural nets are black boxes. In the recent years, several approaches for understanding and visualizing Convolutional Networks have been developed in the literature. They give us a way to peer into the black boxes, diagnose mis-classifications, and assess whether the network is over/under fitting.

Guided backprop can also be used to create trippy art, neural/texture style transfer among the list of other growing applications.

Various visualizations, documented in their own pages, are summarized here.


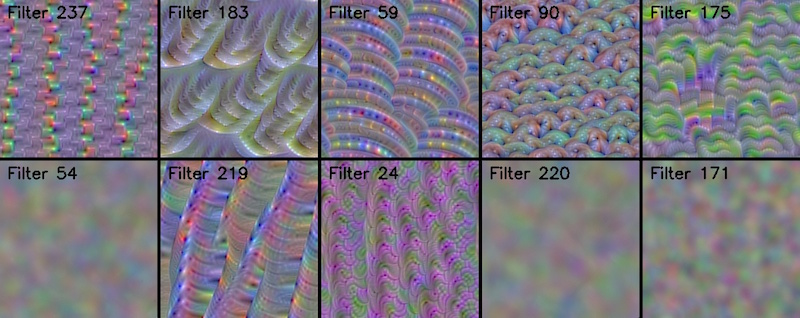
Convolutional filters learn 'template matching' filters that maximize the output when a similar template pattern is found in the input image. Visualize those templates via Activation Maximization.


How can we assess whether a network is over/under fitting or generalizing well?


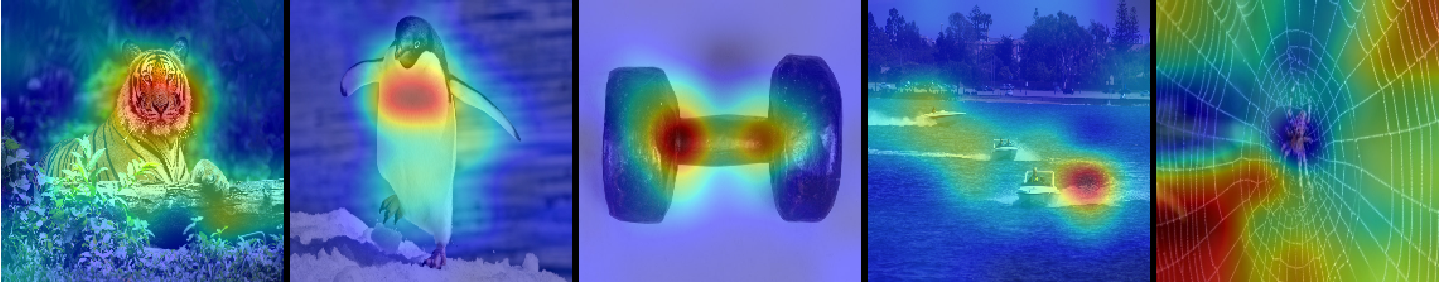
How can we assess whether a network is attending to correct parts of the image in order to generate a decision?


Generating animated gif of optimization progress

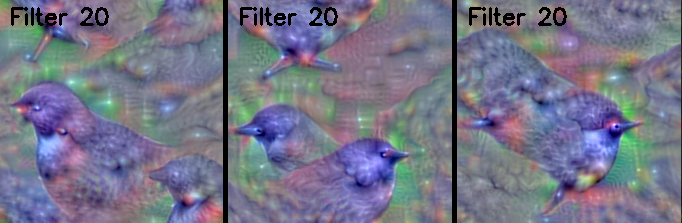
It is possible to generate an animated gif of optimization progress by leveraging callbacks. Following example shows how to visualize the activation maximization for 'ouzel' class (output_index: 20).

from keras.applications import VGG16

from vis.losses import ActivationMaximization
from vis.regularizers import TotalVariation, LPNorm
from vis.input_modifiers import Jitter
from vis.optimizer import Optimizer
from vis.callbacks import GifGenerator

# Build the VGG16 network with ImageNet weights
model = VGG16(weights='imagenet', include_top=True)
print('Model loaded.')

# The name of the layer we want to visualize
# (see model definition in vggnet.py)
layer_name = 'predictions'
layer_dict = dict([(layer.name, layer) for layer in model.layers[1:]])
output_class = [20]

losses = [
    (ActivationMaximization(layer_dict[layer_name], output_class), 2),
    (LPNorm(model.input), 10),
    (TotalVariation(model.input), 10)
]
opt = Optimizer(model.input, losses)
opt.minimize(max_iter=500, verbose=True, input_modifiers=[Jitter()], callbacks=[GifGenerator('opt_progress')])

Notice how the output jitters around? This is because we used Jitter, a kind of ImageModifier that is known to produce crisper activation maximization images. As an exercise, try:

  • Without Jitter
  • Varying various loss weights

opt_progress


Citation

Please cite keras-vis in your publications if it helped your research. Here is an example BibTeX entry:

@misc{raghakotkerasvis,
  title={keras-vis},
  author={Kotikalapudi, Raghavendra and contributors},
  year={2017},
  publisher={GitHub},
  howpublished={\url{https://github.com/raghakot/keras-vis}},
}

keras-vis's People

Stargazers

 avatar  avatar  avatar  avatar  avatar  avatar  avatar  avatar  avatar  avatar  avatar  avatar  avatar  avatar  avatar  avatar  avatar  avatar  avatar  avatar  avatar  avatar  avatar  avatar  avatar  avatar  avatar  avatar  avatar  avatar  avatar  avatar  avatar  avatar  avatar  avatar  avatar  avatar  avatar  avatar  avatar  avatar  avatar  avatar  avatar  avatar  avatar  avatar  avatar  avatar  avatar  avatar  avatar  avatar  avatar  avatar  avatar  avatar  avatar  avatar  avatar  avatar  avatar  avatar  avatar  avatar  avatar  avatar  avatar  avatar  avatar  avatar  avatar  avatar  avatar  avatar  avatar  avatar  avatar  avatar  avatar  avatar  avatar  avatar  avatar  avatar  avatar  avatar  avatar  avatar  avatar  avatar  avatar  avatar  avatar  avatar  avatar  avatar  avatar  avatar

Watchers

 avatar  avatar  avatar  avatar  avatar  avatar  avatar  avatar  avatar  avatar  avatar  avatar  avatar  avatar  avatar  avatar  avatar  avatar  avatar  avatar  avatar  avatar  avatar  avatar  avatar  avatar  avatar  avatar  avatar  avatar  avatar  avatar  avatar  avatar  avatar  avatar  avatar  avatar  avatar  avatar  avatar  avatar  avatar  avatar  avatar  avatar  avatar  avatar  avatar  avatar  avatar  avatar  avatar  avatar  avatar  avatar  avatar  avatar  avatar  avatar  avatar  avatar  avatar  avatar  avatar  avatar  avatar  avatar  avatar  avatar  avatar  avatar  avatar

keras-vis's Issues

Create callbacks for visualizations

Create keras callbacks to generate visualizations while training in keras. It would be pretty neat to have:

  • Tensorboard callback to push visualization images of choice every_x epochs of training.
  • Write them to some output directory.

This could be especially useful when paired with saliency maps or class activation maps

NoneType Error with ResNet

Hi I keep getting a NoneType error when trying to use visualize_cam for a pretrained resnet. Code and error attached

def generate_cam(saved_model, layer_name, image_folder=constants.image_folder, show=True):
"""Generates a heatmap via grad-CAM method.
First, the class prediction is determined, then we generate heatmap to visualize that class.
"""
# Load Model network with trained weights
model = load_model(saved_model)
print('Model loaded.')
# The name of the layer we want to visualize
# (see model definition in vggnet.py)
layer_name = str(layer_name)
layer_idx = [idx for idx, layer in enumerate(model.layers) if layer.name == layer_name][0]
for path in listdir_nohidden(image_folder):
seed_img = utils.load_img(image_folder + '/' + path, target_size=(224, 224))
# Convert to BGR, create input with batch_size: 1, and predict.
bgr_img = utils.bgr2rgb(seed_img)
img_input = np.expand_dims(img_to_array(bgr_img), axis=0)
pred_class = np.argmax(model.predict(img_input))
print(layer_idx)
heatmap = visualize_cam(model, layer_idx-1, [pred_class], seed_img)
if show:
plt.axis('off')
plt.imshow(heatmap)
plt.show()
generate_cam(saved_resnet, 'dense_2')
Model loaded.
/Users/anaconda3/lib/python3.6/site-packages/skimage/transform/_warps.py:84: UserWarning: The default mode, 'constant', will be changed to 'reflect' in skimage 0.15.
warn("The default mode, 'constant', will be changed to 'reflect' in "
180
Working on filters: [0]
Traceback (most recent call last):
File "/Users/anaconda3/lib/python3.6/site-packages/IPython/core/interactiveshell.py", line 2881, in run_code
exec(code_obj, self.user_global_ns, self.user_ns)
File "", line 29, in
generate_cam(saved_resnet, 'dense_2')
File "", line 23, in generate_cam
heatmap = visualize_cam(model, layer_idx-1, [pred_class], seed_img)
File "/Users/anaconda3/lib/python3.6/site-packages/vis/visualization.py", line 256, in visualize_cam
heatmap = np.ones(shape=(rows, cols), dtype=np.float32)
File "/Users/anaconda3/lib/python3.6/site-packages/numpy/core/numeric.py", line 192, in ones
a = empty(shape, dtype, order)
TypeError: 'NoneType' object cannot be interpreted as an integer

Visualize grad-CAM with Inception-V3

Regarding the idea of Class Activation Mapping, I try to reproduce visualize_cam with Inception-V3 but It seems I cannot get a proper heat-map of grad-CAM.

As far as I debug with the example which uses VGG-16, it seems the given code visualize the only Tensor from Convolution2D, _Pooling2D. Note: I have put a workaround by debugging a penultimate layer

# file visualization.py
# under def visualize_cam()

    if penultimate_layer_idx is None:
        for idx, layer in utils.reverse_enumerate(model.layers[:layer_idx-1]):
            if isinstance(layer, (Convolution2D, _Pooling2D)):
                # debug
                print("found penultimate_layer_idx at %s:%s" % (idx, layer))
                penultimate_layer_idx = idx
                break

produced
found penultimate_layer_idx at 18:<keras.layers.pooling.MaxPooling2D object at 0x120db47b8>
After looking at vggnet.py it seems applying grad-CAM on block5_pool or the given line:
x = MaxPooling2D((2, 2), strides=(2, 2), name='block5_pool')(x)

so, I looked at the inception_v3 from Keras InceptionV3 and perform a transfer learning method for binary classification cat-dog by following the instruction on Keras documentation "Fine-tune InceptionV3 on a new set of classes", I found only GlobalAveragePooling2D or avg_pool tensor seems to be visualized before the softmax layer. so, I have worked around on getting penultimate_layer_idx with GlobalAveragePooling2D but it didn't work.

any advice, please?

Update: I have tried to reproduce the grad-CAM result with InceptionV3 on ImageNet and it seems the visualize_cam work on the layer 299 from following logs:
found penultimate_layer_idx at 299:<keras.layers.convolutional.Conv2D object at 0x1266d4748>
and snapshot here Screen Shot 2017-05-01 at 5.43.34 PM.png

Support for 1D Convolutions?

I was trying to run visualize visualize_activation on a model trained on 1D data with 2 channels but ran into assertion error when it saw that it wasn't a 2D image it needed to generate:

---------------------------------------------------------------------------
AssertionError                            Traceback (most recent call last)
<ipython-input-144-899963b8ba25> in <module>()
      5 vis_images = []
      6 for idx in [0, 0, 0]:
----> 7     img = visualize_activation(model, layer_idx, filter_indices=idx, max_iter=500)
      8     vis_images.append(img)
      9 

/usr/local/lib/python2.7/dist-packages/vis/visualization.pyc in visualize_activation(model, layer_idx, filter_indices, seed_img, text, act_max_weight, lp_norm_weight, tv_weight, **optimizer_params)
    108     ]
    109 
--> 110     opt = Optimizer(model.input, losses, norm_grads=False)
    111     img = opt.minimize(**optimizer_params)[0]
    112     if text:

/usr/local/lib/python2.7/dist-packages/vis/optimizer.pyc in __init__(self, img_input, losses, wrt, norm_grads)
     33             # Perf optimization. Don't build loss function with 0 weight.
     34             if weight != 0:
---> 35                 loss_fn = weight * loss.build_loss()
     36                 overall_loss = loss_fn if overall_loss is None else overall_loss + loss_fn
     37                 self.loss_names.append(loss.name)

/usr/local/lib/python2.7/dist-packages/vis/regularizers.pyc in build_loss(self)
     63             ss = tuple(samples_channels_slice + start_slice)
     64             es = tuple(samples_channels_slice + end_slice)
---> 65             diff_square = K.square(self.img[utils.slicer[ss]] - self.img[utils.slicer[es]])
     66             tv = diff_square if tv is None else tv + diff_square
     67 

/usr/local/lib/python2.7/dist-packages/vis/utils/utils.pyc in __getitem__(self, item_slice)
    247         """Assuming a slice for shape `(samples, channels, image_dims...)`
    248         """
--> 249         assert len(item_slice) == 4
    250         if K.image_data_format() == 'channels_first':
    251             return item_slice

AssertionError: 

Would it be difficult to modify this to support 1D input data? Then we can plot using plt.plot instead of plt.imshow?

Support for GlobalPooling layers?

Keras's implementation of Inceptionv3 (in keras.applications) uses a GlobalAveragePooling2D (or alternatively a GlobalMaxPooling2D) layer as its penultimate layer. Global pooling layers in keras extend _GlobalPooling1D, etc., instead of _Pooling1D, etc., so they fail the class membership test
if isinstance(layer, (_Conv, _Pooling1D, _Pooling2D, _Pooling3D)) in vis.visualization.visualize_cam.

Really, though, that's just a subproblem to my real issue. My bigger issue is I can't figure out how to modify the method to create a meaningful heatmap. The problem is that the GlobalPooling layers in keras have are a 2D tensor of shape (batch_size, channels) instead of a 3D tensor like the other Pooling layers used in VGG16, for instance (see e.g. https://keras.io/layers/pooling/). Hence, the
output_dims returned by utils.get_img_shape(penultimate_output)[:2] in visualize_cam is an empty tuple (), so the heatmap is a scalar. This of course creates problems when trying to resize the heatmap to the input shape, which will be an array of (pixel_height, pixel_width), depending on the input shape of the model.

Do you have any guidance for this issue?

AssertionError with Conv example

I'm trying the example as given, but get the following error. Python 2.7, latest keras&tensorflow.


AssertionError Traceback (most recent call last)
in ()
19 vis_images = []
20 for idx in filters:
---> 21 img = visualize_activation(model, layer_idx, filter_indices=idx)
22 img = utils.draw_text(img, str(idx))
23 vis_images.append(img)

/home/manava/anaconda2/lib/python2.7/site-packages/vis/visualization.pyc in visualize_activation(model, layer_idx, filter_indices, seed_img, text, act_max_weight, lp_norm_weight, tv_weight, **optimizer_params)
108 ]
109
--> 110 opt = Optimizer(model.input, losses, norm_grads=False)
111 img = opt.minimize(**optimizer_params)[0]
112 if text:

/home/manava/anaconda2/lib/python2.7/site-packages/vis/optimizer.pyc in init(self, img_input, losses, wrt, norm_grads)
33 # Perf optimization. Don't build loss function with 0 weight.
34 if weight != 0:
---> 35 loss_fn = weight * loss.build_loss()
36 overall_loss = loss_fn if overall_loss is None else overall_loss + loss_fn
37 self.loss_names.append(loss.name)

/home/manava/anaconda2/lib/python2.7/site-packages/vis/losses.pyc in build_loss(self)
85 else:
86 # slicer is used to deal with theano/tensorflow without the ugly conditional statements.
---> 87 loss += -K.mean(layer_output[utils.slicer[:, idx, ...]])
88
89 return loss

/home/manava/anaconda2/lib/python2.7/site-packages/vis/utils/utils.pyc in getitem(self, item_slice)
247 """Assuming a slice for shape (samples, channels, image_dims...)
248 """
--> 249 assert len(item_slice) == 4
250 if K.image_data_format() == 'channels_first':
251 return item_slice

AssertionError:

Saliency maps numpy divide

I'm trying to reproduce the first example titled "Saliency maps" here:
https://raghakot.github.io/keras-vis/visualizations/attention/

But I'm running into the following error:

---------------------------------------------------------------------------
TypeError                                 Traceback (most recent call last)
<ipython-input-4-3296fc2c6dec> in <module>()
     33 
     34     # Here we are asking it to show attention such that prob of `pred_class` is maximized.
---> 35     heatmap = visualize_saliency(model, layer_idx, [pred_class], seed_img)#, text=utils.get_imagenet_label(pred_class))
     36     heatmaps.append(heatmap)
     37 

/Users/fredhohman/anaconda/lib/python3.5/site-packages/vis/visualization.py in visualize_saliency(model, layer_idx, filter_indices, seed_img, text, overlay)
    162     # Smoothen activation map
    163     grads = utils.deprocess_image(grads[0])
--> 164     grads /= np.max(grads)
    165 
    166     # Convert to heatmap and zero out low probabilities for a cleaner output.

TypeError: ufunc 'true_divide' output (typecode 'd') could not be coerced to provided output parameter (typecode 'B') according to the casting rule ''same_kind''

Looks like something with numpy division?

Uint 8 Requirement/Image Preprocessing

These seems to be a killer flaw with this wonderful tool. Running the demo saliency map demo code runs perfect but it assumes the dtype of the image array is uint8. Any other dtype causes an error when ran.

How to get around this? What happens when your problem has images that have been preprocessed (like img_array/255 and img_array.dtype='float32')? The model may give bad predictions on image arrays that are not in the same preprocssed formats used to train the model. Is there any way around this? Hoping for help from anyone...

tensorflow.python.framework.errors.InvalidArgumentError: input_1:0 is both fed and fetched.

Working on filters: [292]
Traceback (most recent call last):
File "/home/wangxin/code/generative_seed/guiding_saliency.py", line 35, in
heatmap = visualize_saliency(model, layer_idx, [pred_class], seed_img, text=utils.get_imagenet_label(pred_class))
File "/home/wangxin/.local/lib/python2.7/site-packages/vis/visualization.py", line 146, in visualize_saliency
grads = opt.minimize(max_iter=1, verbose=False, jitter=0, seed_img=seed_img)[1]
File "/home/wangxin/.local/lib/python2.7/site-packages/vis/optimizer.py", line 152, in minimize
loss, grads, wrt_value = self.overall_loss_grad_wrt_fn([seed_img, 0])
File "/home/wangxin/.local/lib/python2.7/site-packages/keras/backend/tensorflow_backend.py", line 1943, in call
feed_dict=feed_dict)
File "/home/wangxin/.local/lib/python2.7/site-packages/tensorflow/python/client/session.py", line 372, in run
run_metadata_ptr)
File "/home/wangxin/.local/lib/python2.7/site-packages/tensorflow/python/client/session.py", line 636, in _run
feed_dict_string, options, run_metadata)
File "/home/wangxin/.local/lib/python2.7/site-packages/tensorflow/python/client/session.py", line 708, in _do_run
target_list, options, run_metadata)
File "/home/wangxin/.local/lib/python2.7/site-packages/tensorflow/python/client/session.py", line 728, in _do_call
raise type(e)(node_def, op, message)
tensorflow.python.framework.errors.InvalidArgumentError: input_1:0 is both fed and fetched.

I saw this while i'm running the example on https://raghakot.github.io/keras-vis/visualizations/attention/. Could someone help me figure it out?

error on example

Hi, I tried the example in the readme and I get the following error:

In [1]: from vis.utils.vggnet import VGG16
Using TensorFlow backend.

In [2]: from vis.optimizer import Optimizer

In [3]: from vis.losses import ActivationMaximization

In [4]: from vis.regularizers import TotalVariation, LPNorm

In [5]: model = VGG16(weights='imagenet', include_top=True)

In [6]: layer_name = 'predictions'

In [7]: layer_dict = dict([(layer.name, layer) for layer in model.layers[1:]])

In [8]: output_class = [20]

In [9]: losses = [(ActivationMaximization(layer_dict[layer_name], output_class), 2), (LPNorm(model.input), 10), (TotalVariati
   ...: on(model.input), 10)]

In [10]: opt = Optimizer(model.input, losses)
---------------------------------------------------------------------------
NotImplementedError                       Traceback (most recent call last)
<ipython-input-10-78a6f55b3e28> in <module>()
----> 1 opt = Optimizer(model.input, losses)

/home/user/anaconda2/envs/keras-vis/lib/python2.7/site-packages/vis/optimizer.pyc in __init__(self, img_input, losses, wrt)
     31             # Perf optimization. Don't build loss function with 0 weight.
     32             if weight != 0:
---> 33                 loss_fn = weight * loss.build_loss()
     34                 overall_loss += loss_fn
     35                 # Learning phase is added so that 'test' phase can be used to disable dropout.

/home/user/anaconda2/envs/keras-vis/lib/python2.7/site-packages/vis/regularizers.pyc in build_loss(self)
     49         """
     50         assert 4 == K.ndim(self.img)
---> 51         a = K.square(self.img[utils.slicer[:, :, 1:, :-1]] - self.img[utils.slicer[:, :, :-1, :-1]])
     52         b = K.square(self.img[utils.slicer[:, :, :-1, 1:]] - self.img[utils.slicer[:, :, :-1, :-1]])
     53         tv = K.sum(K.pow(a + b, self.beta/2.))

/home/user/anaconda2/envs/keras-vis/lib/python2.7/site-packages/tensorflow/python/ops/array_ops.pyc in _SliceHelper(tensor, slice_spec)
    313       if s.stop is not None and s.stop < 0:
    314         raise NotImplementedError(
--> 315             "Negative stop indices are not currently supported")
    316       # NOTE(mrry): If the stop is not specified, Python substitutes
    317       #   sys.maxsize, which is typically (2 ** 63) - 1. Since Slice currently

NotImplementedError: Negative stop indices are not currently supported

Atrribute credits in Readme

Hi,
I've been following this project code from the beginning and think it's a nice effort.

Some of the ideas/code here were assisted with a few repositories of mine.
Specifically,
https://github.com/jacobgil/keras-grad-cam
https://github.com/jacobgil/keras-filter-visualization
And now with the recent self driving car demo,
https://github.com/jacobgil/keras-steering-angle-visualizations

I think it would be fair if you attribute/give credit for this in the Readme.

Thanks,
Jacob

error font searching... in utils.py

I got a font related error running the first sample code.

My env is , no GPU, Win10, conda with python 3.6

What I did first was downloading and install 'FreeSan.ttf' into system.

However, it didn't help out.

Then, I figured out what the problem was.

For me, this code, "len(font_files)" in vis/util/utils.py causes the problem.

#    font_files = _find_font_file(font)
#     if len(font_files) == 0:
#         logger.warn("Failed to lookup font '{}', falling back to default".format(font))
#         font = ImageFont.load_default()
#     else:
#         font = ImageFont.truetype(font_files[0], font_size)
    font = ImageFont.load_default()

So, This is my way around, just using default font without checking a specific font.

FYI, Below is the traceback.

Model loaded.
Traceback (most recent call last):

File "", line 1, in
runfile('C:/Users/User/Documents/tf/untitled4.py', wdir='C:/Users/User/Documents/tf')

File "C:\Anaconda3\lib\site-packages\spyder\utils\site\sitecustomize.py", line 880, in runfile
execfile(filename, namespace)

File "C:\Anaconda3\lib\site-packages\spyder\utils\site\sitecustomize.py", line 102, in execfile
exec(compile(f.read(), filename, 'exec'), namespace)

File "C:/Users/User/Documents/tf/untitled4.py", line 32, in
opt.minimize(max_iter=500, verbose=True, image_modifiers=[Jitter()], callbacks=[GifGenerator('opt_progress')])

File "C:\Anaconda3\lib\site-packages\vis\optimizer.py", line 134, in minimize
c.callback(i, named_losses, overall_loss, grads, wrt_value)

File "C:\Anaconda3\lib\site-packages\vis\callbacks.py", line 61, in callback
img = utils.draw_text(img, "Step {}".format(i + 1))

File "C:\Anaconda3\lib\site-packages\vis\utils\utils.py", line 232, in draw_text
if len(font_files) == 0:

TypeError: object of type 'filter' has no len()

support for conv3d

  • Check that you are up-to-date with the master branch of keras-vis. You can update with:
    pip install git+git://github.com/raghakot/keras-vis.git --upgrade --no-deps

  • If running on TensorFlow, check that you are up-to-date with the latest version. The installation instructions can be found here.

  • If running on Theano, check that you are up-to-date with the master branch of Theano. You can update with:
    pip install git+git://github.com/Theano/Theano.git --upgrade --no-deps

  • Provide a link to a GitHub Gist of a Python script that can reproduce your issue (or just copy the script here if it is short).

Hello, thanks for a great package, I found out that current version does not support 3d images (conv3d) which is expected, but it would be great if you could add this feature.

Multiple inbound nodes error when visualising dense softmax

Im using the Keras VGG16 net with a custom top layer (4 class softmax)

Loaded model with layers: 
[u'input_2', u'block1_conv1', u'block1_conv2', u'block1_pool', u'block2_conv1', u'block2_conv2', u'block2_pool', u'block3_conv1', u'block3_conv2', u'block3_conv3', u'block3_pool', u'block4_conv1', u'block4_conv2', u'block4_conv3', u'block4_pool', u'block5_conv1', u'block5_conv2', u'block5_conv3', u'block5_pool', u'flatten_2', u'dense_2', u'dropout_2', u'predictions']

However, trying to visualise the filters for the top level (Dense) softmax layer ('predictions') is throwing an error on:

tot_filters = get_num_filters(layer)

File "/usr/local/lib/python2.7/site-packages/keras_vis-0.3-py2.7.egg/vis/visualization.py", line 30, in get_num_filters
   isDense = K.ndim(layer.output) == 2
 File "/Users/dgorissen/Library/Python/2.7/lib/python/site-packages/keras/engine/topology.py", line 933, in output
   ' has multiple inbound nodes, '
AttributeError: Layer predictions has multiple inbound nodes, hence the notion of "layer output" is ill-defined. Use `get_output_at(node_index)` instead.

Hardcoding the value to 4 results in the same error later on:

   img = visualize_activation(model, layer_idx, filter_indices=[idx])
  File "/usr/local/lib/python2.7/site-packages/keras_vis-0.3-py2.7.egg/vis/visualization.py", line 108, in visualize_activation
    opt = Optimizer(model.input, losses)
  File "/usr/local/lib/python2.7/site-packages/keras_vis-0.3-py2.7.egg/vis/optimizer.py", line 35, in __init__
    loss_fn = weight * loss.build_loss()
  File "/usr/local/lib/python2.7/site-packages/keras_vis-0.3-py2.7.egg/vis/losses.py", line 76, in build_loss
    layer_output = self.layer.output
  File "/Users/dgorissen/Library/Python/2.7/lib/python/site-packages/keras/engine/topology.py", line 933, in output
    ' has multiple inbound nodes, '
AttributeError: Layer predictions has multiple inbound nodes, hence the notion of "layer output" is ill-defined. Use `get_output_at(node_index)` instead.

Looking at the docs and googling around it would seem that this should just work. What am I missing?

Edit: My overall model is a Sequential() model stuck on top of the base VGG model. The above output is after flattening the overall model into a single Sequential() model with a flat list of layers. However that seems to break things for after flattening, trying to visualise block5_conv1 gives the same error. Without flattening it works fine.

So I guess my question is, how best to deal with nested models, or get the overall model into a shape I can visualise the last dense layer.

Pip package is out of date

the package on pip appears to still be for 2.7, so relative paths (for example in the visualization.py imports) are broken. Perhaps a seperate package should be uploaded for 3?

Implement neural style transfer

  • Create required losses, regularizers
  • Add new visualization in visualization.py
  • Create a sample usage in examples/
  • Update docs

Error in Class Activation map for hidden layers

I was trying out the class activation map of some cat and dog images for different layers of VGG16 (using keras.applications.vgg16, not vis.utils.vggnet), and the code, shown in (https://raghakot.github.io/keras-vis/visualizations/attention/) does not seem to be working for layers other than 'predictions'. When I use layer_name='block1_conv2', it is throwing an error, ValueError: Unable to detect penultimate 'Convolution2D' or 'Pooling2D' layer for layer_idx: 2. On the other hand, for layer_name='block2_conv2', or layer_name='block3_conv2' there is an AssertionError for len(item_slice) == 4.

Further, when I am using layer_name='predictions', the prediction is performed correctly for the cat and dog image (Tabby, and Siberian Husky), but the heat map is barely on the dog.

keras-vis-cam-2

The problem is seen even for the images shown in the website, at least for the Tiger and the Spider Web.

keras-vis-cam-original

When I use the VGG16 from vis.utils.vggnet, though, the heatmap makes sense!

keras-vis-cam
keras-vis-cam-original

Though, even in this case, when I change the layer to fc1 or fc2, the entirety of the image lights up.

keras-vis-cam-original-2
And the same error as mentioned before shows up when I try see the map for intermediate Convolution layers. How can this be solved?

The code I am using is:

import numpy as np
import matplotlib
matplotlib.use('Agg')
import matplotlib.pyplot as plt
import matplotlib.axis as ax

from keras.preprocessing.image import img_to_array
from keras.applications.imagenet_utils import preprocess_input

from vis.utils import utils
from keras.applications.vgg16 import VGG16, decode_predictions
from vis.visualization import visualize_cam

# Build the VGG16 network with ImageNet weights
model = VGG16(weights='imagenet', include_top=True)
print('Model loaded.')

# The name of the layer we want to visualize
# (see model definition in vggnet.py)
layer_name = 'predictions' # 'block1_conv2', 'block2_conv2', 'block3_conv2'
layer_idx = [idx for idx, layer in enumerate(model.layers) if layer.name == layer_name][0]

# Images corresponding to cat, and dog
image_paths = [
    "cat.jpg",
    "dog.jpg"
]

heatmaps = []
for path in image_paths:
    seed_img = utils.load_img(path, target_size=(224, 224))
    x = np.expand_dims(img_to_array(seed_img), axis=0)
    x = preprocess_input(x)
    pred_class = np.argmax(model.predict(x))
    print('Predicted class is ' +str(decode_predictions(model.predict(x), top=1)[0][0]))
    # Here we are asking it to show attention such that prob of `pred_class` is maximized.
    heatmap = visualize_cam(model, layer_idx, [pred_class], seed_img)
    heatmaps.append(heatmap)

plt.imshow(utils.stitch_images(heatmaps))
plt.axis('off')
plt.title('Class Activation map')
plt.savefig('keras-vis-cam-2.jpeg')

Preprocessing the Input Image

I observed in the examples that the seed images are not preprocessed by subtracting the mean, as it is required in the VGG-Net. I am sure the activation in the end of the of the model will be different if don't subtract the mean from the input image. Am I missing something?

OpenCV Dependency

The comment on line 267 in the visualization.py file suggests to get rid of the OpenCV dependency.

Instead of OpenCV, one could use the imresize function of the SciPy package.

The code would change to:
heatmap = imresize(heatmap, input_dims, interp='bicubic', mode='F')

I have tested this successfully.

Divison by Zero

Code in visualize_cam may perform a division by zero.

Assume we want to visualize the class 'cat' but seed_img is an image of a 'dog'. Hence, it is likely that the heatmap (weighted sum of the feature maps) is all negative (since seed_img does not contain any 'cat' features). In line 272, we threshold the heatmap at 0. This produces an array containing only the value 0. In line 273, we divide by the maximum of this array:
heatmap /= np.max(heatmap)
Hence, we would divide by zero.

Two suggestions to solve this issue:

  1. heatmap /= np.max(heatmap) + epsilon
  2. if np.max(heatmap) > 0: heatmap /= np.max(heatmap)

Attention maps - ValueError: operands could not be broadcast together

Hi,

I am trying to use visualize_cam with a model that has been trained as channels_first, and I have been receiving the following error:

    266     # Create jet heatmap.
    267     heatmap_colored = np.uint8(cm.jet(heatmap)[..., :3] * 255)
--> 268     heatmap_colored = np.uint8(seed_img * alpha + heatmap_colored * (1. - alpha))
    269     return heatmap_colored

ValueError: operands could not be broadcast together with shapes (1,3,224,224) (224,224,3)

My preprocessing is as follows:

from keras import backend as K
import numpy as np
from scipy.misc import imresize, imread
from vis.utils import utils
from vis.visualization import visualize_saliency
from vis.visualization import visualize_cam

import my_model

# get Keras model
model = my_model.get_model()

K.set_image_data_format('channels_first')

heatmaps = []
for path in image_paths:
    x = imread(path)
    x = x.astype('float32')
    x = imresize(x, (224, 224, 3))

    # change BGR -> RGB
    x[:,:,[0,1,2]] = x[:,:,[2,1,0]]

    # transpose to channels first
    x = x.transpose((2, 0, 1))
    x = np.expand_dims(x, axis =0)
    x = x / 255
    pred_class = np.argmax(model.predict(x))
    heatmap = visualize_cam(model, layer_idx, [pred_class], x)
    heatmaps.append(heatmap)

It seems as though the same issue occurs with saliency maps as well.

errors when visualize_saliency using conv1d model

This is my code:
heatmap = visualize_saliency(model, layer_idx, [pred_class], x)
Herer x is my 1-dim data.
I get an error.

Traceback (most recent call last):
  File "3.py", line 49, in <module>
    heatmap = visualize_saliency(model, layer_idx, [pred_class], x)
  File "/Users/zhishanzhang/code/ke2/lib/python2.7/site-packages/keras_vis-0.3-py2.7.egg/vis/visualization.py", line 154, in visualize_saliency
    opt = Optimizer(model.input, losses, norm_grads=False)
  File "/Users/zhishanzhang/code/ke2/lib/python2.7/site-packages/keras_vis-0.3-py2.7.egg/vis/optimizer.py", line 35, in __init__
    loss_fn = weight * loss.build_loss()
  File "/Users/zhishanzhang/code/ke2/lib/python2.7/site-packages/keras_vis-0.3-py2.7.egg/vis/losses.py", line 84, in build_loss
    loss += -K.mean(layer_output[:, idx])
  File "/Users/zhishanzhang/code/ke2/lib/python2.7/site-packages/tensorflow/python/ops/array_ops.py", line 497, in _SliceHelper
    name=name)
  File "/Users/zhishanzhang/code/ke2/lib/python2.7/site-packages/tensorflow/python/ops/array_ops.py", line 655, in strided_slice
    shrink_axis_mask=shrink_axis_mask)
  File "/Users/zhishanzhang/code/ke2/lib/python2.7/site-packages/tensorflow/python/ops/gen_array_ops.py", line 3568, in strided_slice
    shrink_axis_mask=shrink_axis_mask, name=name)
  File "/Users/zhishanzhang/code/ke2/lib/python2.7/site-packages/tensorflow/python/framework/op_def_library.py", line 768, in apply_op
    op_def=op_def)
  File "/Users/zhishanzhang/code/ke2/lib/python2.7/site-packages/tensorflow/python/framework/ops.py", line 2338, in create_op
    set_shapes_for_outputs(ret)
  File "/Users/zhishanzhang/code/ke2/lib/python2.7/site-packages/tensorflow/python/framework/ops.py", line 1719, in set_shapes_for_outputs
    shapes = shape_func(op)
  File "/Users/zhishanzhang/code/ke2/lib/python2.7/site-packages/tensorflow/python/framework/ops.py", line 1669, in call_with_requiring
    return call_cpp_shape_fn(op, require_shape_fn=True)
  File "/Users/zhishanzhang/code/ke2/lib/python2.7/site-packages/tensorflow/python/framework/common_shapes.py", line 610, in call_cpp_shape_fn
    debug_python_shape_fn, require_shape_fn)
  File "/Users/zhishanzhang/code/ke2/lib/python2.7/site-packages/tensorflow/python/framework/common_shapes.py", line 676, in _call_cpp_shape_fn_impl
    raise ValueError(err.message)
ValueError: slice index 1 of dimension 1 out of bounds. for 'strided_slice' (op: 'StridedSlice') with input shapes: [?,1], [2], [2], [2] and with computed input tensors: input[1] = <0 1>, input[2] = <0 2>, input[3] = <1 1>.

Heatmap Initialization

I know, it doesn't really matter, but the heatmap in visualize_cam should be initialized as
heatmap = np.zeros(shape=output_dims, dtype=K.floatx())
instead of
heatmap = np.ones(shape=output_dims, dtype=K.floatx())

i keep getting no module named losses.

I guess this might be a nive mistake but i couldnt find help anywhere,

---------------------------------------------------------------------------
ImportError                               Traceback (most recent call last)
<ipython-input-42-41c13b054a82> in <module>()
      5 from vis.utils import utils
      6 from vis.utils.vggnet import VGG16
----> 7 from vis.visualization import visualize_saliency
      8 
      9 

/home/m/.local/lib/python3.5/site-packages/vis/visualization.py in <module>()
      3 from keras import backend as K
      4 
----> 5 from losses import ActivationMaximization
      6 from optimizer import Optimizer
      7 from regularizers import TotalVariation, LPNorm

ImportError: No module named 'losses'

i tried adding a file named losses and added the code in the readme of the repo, i then got another error saying no module utils named utils.

Investigate support for pytorch

All we need is iteration over layers, ability to take gradients with respect to some input in a graph, and abstractions for common keras backend calls.

It might be possible to make the lib support pytorch once these abstractions are in place.

cannot import visualize_saliency

I'm getting this error when trying to import visualize_saliencey

image

I checked the Keras docs and it looks like K.image_data_format() is still valid attribute on the Keras backend. I'm wondering if this might be a Keras 1 to Keras 2 transition issue?

all sorts of weird results and errors

Hi man, I just found that there are a number of weird results and errors occurring when using kerfs-vis. Let's direct them one by one.

  1. Image requires to be in range [0-255] for cam, not sure though about saliency. Maybe you should handle this internally like when we use the deprocess function from vgg16.

  2. weird results occur when using either method, whether its cam, saliency, dense layer visualization or convolutional layer.

Example:
screen shot 2017-06-13 at 1 18 46 pm

  1. When talking about convolution layer filter visualization your method gives output from filters in color while the model was trained on gray scale images for instance. why? Is that because it scales the images to [0-255]?

  2. Provide some examples on the documents how to produce saliency maps and dense layer visualization for MLP.

  3. If possible provide all the examples on standard dataset such as mnist & cifar. Easiest to test than huge models trained on imagenet.

  4. The draw util on images is broken doesn't work.

  5. Why there is such a discrepancy between saliency and cam
    screen shot 2017-06-13 at 1 58 12 pm
    screen shot 2017-06-13 at 1 58 30 pm

  6. Why does cam return no result in some cases and works in some others. Is that an expected behavior?
    screen shot 2017-06-13 at 2 00 33 pm

  7. How would you interpret those filters from dense and convolutional layers? I have no idea. To me they seem wrong?

screen shot 2017-06-13 at 2 05 57 pm
screen shot 2017-06-13 at 2 15 21 pm

These are what I get with my own method.
stitched_filters_4x4
stitched_filters_6x6

  1. Somewhere in the visualization.py file it throws warning because there is division by zero.
    /Users/user/anaconda2/lib/python2.7/site-packages/keras_vis-0.3-py2.7.egg/vis/visualization.py:247: RuntimeWarning: invalid value encountered in divide
    grads /= np.max(grads)
    /Users/user/anaconda2/lib/python2.7/site-packages/matplotlib/colors.py:496: RuntimeWarning: invalid value encountered in less
    cbook._putmask(xa, xa < 0.0, -1)

  2. In the gist below I provide all the issues especially in the end in the comments. It would be nice if those things in the comments could be replicated as examples to show us how they work. None of those examples in the end worked for me.

import numpy as np
import matplotlib.pyplot as plt
import tensorflow as tf
from keras import backend as K
from keras.datasets import mnist
from keras.utils import np_utils
from keras.models import Model, load_model, Sequential
from keras.layers import Conv2D, Dropout, Flatten, Dense, Input
from keras.layers import BatchNormalization, Activation
from vis.visualization import visualize_cam, visualize_saliency
from vis.visualization import visualize_activation, get_num_filters
from vis.utils import utils


def vis_cam(model, img, layer_name=None, penultimate_layer_idx=None,
            mode='saliency', nb_out_imgs=5):

    if layer_name is None:
        raise Warning("You need to provide a layer name indicating the layer"
                      " index of the cam you want to compute.")
        return -1

    layer_idx = [idx for idx, layer in enumerate(model.layers)
                 if layer.name == layer_name][0]

    if np.max(img) != 255:
        img *= 255

    pred_class = np.argmax(model.predict(img))

    if mode == 'saliency':
        heatmap = visualize_saliency(model, layer_idx, [pred_class], img)
        if heatmap.shape[2] == 1:
            heatmap = heatmap.reshape(heatmap.shape[0], heatmap.shape[1])
        plt.imshow(heatmap)
        plt.show()
    if mode == 'cam':
        heatmap = visualize_cam(model, layer_idx, [pred_class], img,
                                penultimate_layer_idx)
        if heatmap.shape[3] == 1:
            heatmap = heatmap.reshape(heatmap.shape[1], heatmap.shape[2])
        elif heatmap.shape[3] == 3:
            heatmap = heatmap.reshape(heatmap.shape[1:])
        plt.imshow(heatmap)
        plt.show()
    if mode == 'conv':
        filters = np.arange(get_num_filters(model.layers[layer_idx]))
        vis_images = []
        for idx in filters:
            img = visualize_activation(model, layer_idx, filter_indices=idx)
            vis_images.append(img)

        stitched = utils.stitch_images(vis_images, cols=8)
        if stitched.shape[2] == 1:
            stitched = stitched.reshape(-1, stitched.shape[1])
        plt.figure(figsize=(60, 30))
        plt.axis('off')
        plt.imshow(stitched)
        plt.title(layer_name)
        plt.show()
    if mode == 'dense':
        del img
        vis_images = []
        for idx in xrange(nb_out_imgs):
            img = visualize_activation(model, layer_idx,
                                       filter_indices=pred_class,
                                       max_iter=500)
            vis_images.append(img)

        stitched = utils.stitch_images(vis_images)
        if stitched.shape[2] == 1:
            stitched = stitched.reshape(-1, stitched.shape[1])
        plt.figure(figsize=(60, 30))
        plt.axis('off')
        plt.imshow(stitched)
        plt.title(layer_name)
        plt.show()


def cnn(data_shape):
    inpt = Input(shape=data_shape)
    x = Dropout(0.2, input_shape=data_shape)(inpt)
    x = Conv2D(64, (8, 8), strides=(2, 2),
               padding='same', activation='relu')(inpt)
    x = Conv2D((128), (6, 6), strides=(2, 2),
               padding='valid', activation='relu')(x)
    x = Conv2D((128), (5, 5), strides=(1, 1),
               padding='valid', activation='relu')(x)
    x = Dropout(0.5)(x)
    x = Flatten()(x)
    x = Dense(10, activation='softmax')(x)
    model = Model(inpt, x)
    model.compile(optimizer='adam', loss='categorical_crossentropy',
                  metrics=['accuracy'])

    return model


def mlp(data_shape):
    model = Sequential()
    model.add(Dropout(0.5, input_shape=data_shape))
    model.add(BatchNormalization(axis=1))
    model.add(Dense(784))
    model.add(Activation('relu'))
    model.add(BatchNormalization(axis=1))
    model.add(Dense(512))
    model.add(Activation('relu'))
    model.add(Dropout(0.2))
    model.add(BatchNormalization(axis=1))
    model.add(Dense(256))
    model.add(Activation('relu'))
    model.add(Dense(10))
    model.add(Activation('softmax'))

    model.compile(loss='categorical_crossentropy',
                  optimizer='adam',
                  metrics=['accuracy'])

    return model


if __name__ == "__main__":
    sess = tf.Session()
    K.set_session(sess)
    (trX, trY), (teX, teY) = mnist.load_data()
    trX = np.expand_dims(trX, axis=3)
    teX = np.expand_dims(teX, axis=3)
    trX = trX / 255.
    teX = teX / 255.
    trY = np_utils.to_categorical(trY, 10)
    teY = np_utils.to_categorical(teY, 10)
    model = cnn(trX.shape[1:])
    model.summary()
    model.fit(trX, trY, validation_split=0.21, batch_size=128, epochs=10,
              verbose=1)
    model.save('cnn_model.hdf5')
    trX = trX.reshape(-1, 784)
    teX = teX.reshape(-1, 784)
    model = mlp(trX.shape[1:])
    model.summary()
    model.fit(trX, trY, validation_split=0.21, batch_size=128, epochs=10,
              verbose=1)
    model.save('mlp_model.hdf5')
    # plot original image
    img_idx = np.random.randint(0, 47400)
    img = trX[img_idx]
    plt.imshow(img.reshape(28, 28), cmap='gray_r')
    plt.show()
    img = np.expand_dims(img, axis=0)
    print("image shape = {}".format(img.shape))

    # Here I get all sorts of weird results with end filters or
    # activations being green in color. Saliency and cam are not
    # working as they are supposed to

    # 1. plot saliency for mlp model ==> not working
    vis_cam(model, img, 'dense_1', mode='saliency')
    # 2. plot dense layer for mlp ==> not working
    vis_cam(model, img, 'dense_1', mode='dense')
    # 3. plot dense for cnn model
    model = load_model('cnn_model.hdf5')
    vis_cam(model, img, 'dense_1', mode='dense')
    # 4. plot conv filter for cnn model
    vis_cam(model, img, 'conv2d_2', mode='conv')
    # 5. plot cam for cnn model
    vis_cam(model, img, 'dense_1', mode='cam', penultimate_layer_idx=2)
    # 6. plot saliency for cnn model
    vis_cam(model, img, 'dense_1', mode='saliency')

    sess.close()

error and weird results when using visualize_cam

Hi,
I am getting the following error when I use visualize_cam:

Traceback (most recent call last):
  File "visual.py", line 60, in <module>
    heatmap = visualize_cam(model, layer_idx, [pred_class], img)
  File "/Users/user/anaconda2/envs/adv/lib/python2.7/site-packages/vis/visualization.py", line 243, in visualize_cam
    _, grads, penultimate_output_value = opt.minimize(seed_img, max_iter=1, verbose=False)
  File "/Users/user/anaconda2/envs/adv/lib/python2.7/site-packages/vis/optimizer.py", line 127, in minimize
    computed_values = self.compute_fn([seed_img, 0])
  File "/Users/user/anaconda2/envs/adv/lib/python2.7/site-packages/keras/backend/tensorflow_backend.py", line 2229, in __call__
    feed_dict=feed_dict)
  File "/Users/user/anaconda2/envs/adv/lib/python2.7/site-packages/tensorflow/python/client/session.py", line 778, in run
    run_metadata_ptr)
  File "/Users/user/anaconda2/envs/adv/lib/python2.7/site-packages/tensorflow/python/client/session.py", line 933, in _run
    + e.args[0])
TypeError: Cannot interpret feed_dict key as Tensor: Can not convert a int into a Tensor.

Here's the reproducible code example:

import numpy as np
import matplotlib.pyplot as plt
from keras import backend as K
from keras.datasets import mnist
from keras.utils import np_utils
from keras.models import Model
from keras.layers import Conv2D, Dropout, Flatten, Dense, Input
# from vis.utils import utils
from vis.visualization import visualize_cam


K.set_learning_phase(0)


def create_model(data_shape):
    inpt = Input(shape=data_shape)
    x = Dropout(0.2, input_shape=data_shape)(inpt)
    x = Conv2D(64, (8, 8), strides=(2, 2),
               padding='same', activation='relu', input_shape=data_shape)(x)
    x = Conv2D((128), (6, 6), strides=(2, 2),
               padding='valid', activation='relu')(x)
    x = Conv2D((128), (5, 5), strides=(1, 1),
               padding='valid', activation='relu')(x)
    x = Dropout(0.5)(x)
    x = Flatten()(x)
    x = Dense(10, activation='softmax')(x)
    model = Model(inpt, x, name='can_model_mine')
    model.compile(optimizer='adam', loss='categorical_crossentropy',
                  metrics=['accuracy'])

    return model


if __name__ == "__main__":
    (trX, trY), (teX, teY) = mnist.load_data()
    trX = np.expand_dims(trX, axis=3)
    teX = np.expand_dims(teX, axis=3)
    trY = np_utils.to_categorical(trY, 10)
    teY = np_utils.to_categorical(teY, 10)
    model = create_model(trX.shape[1:])
    model.summary()
    model.fit(trX, trY, validation_split=0.21, batch_size=128, epochs=2,
              verbose=1)
    # plot original image
    img_idx = np.random.randint(0, 47400)
    img = trX[img_idx]
    # plt.imshow(img.reshape(28, 28))
    # plt.show()
    img = np.expand_dims(img, axis=0)
    print("image shape = {}".format(img.shape))

    # predicted and true class
    pred_class = np.argmax(model.predict(img))
    actual_class = np.argmax(trY[img_idx])
    print("predicted class = {}, true class = {}".format(pred_class,
                                                         actual_class))
    layer_name = 'dense_1'
    layer_idx = [idx for idx, layer in enumerate(model.layers)
                 if layer.name == layer_name][0]
    heatmap = visualize_cam(model, layer_idx, [pred_class], img)
    print("heatmap = {}".format(heatmap.shape))
    plt.axis('off')
    plt.imshow(heatmap.reshape(28, 28, 3))
    plt.title('Saliency map')
    plt.show()

If I remove K.set_learning_phase(0) I get the following weird results
cam

The thing is that I cannot remove K.set_learning_phase(0) since it is required by some other library that I'm using in my project.

Also some other times I get the following error:

(Pdb) heatmap = visualize_cam(model, 6, [pred_class], np.expand_dims(img, axis=0))
Working on filters: [7]
*** AttributeError: Layer cnn_model_mine has multiple inbound nodes, hence the notion of "layer input" is ill-defined. Use `get_input_at(node_index)` instead.

cost must be a scalar

I got this error:Traceback (most recent call last):
File "......./vis.py", line 28, in
opt = Optimizer(model.input, losses)
File "..../vis/optimizer.py", line 41, in init
grads = K.gradients(overall_loss, self.wrt)[0]
File "/usr/local/lib/python2.7/dist-packages/keras/backend/theano_backend.py", line 1172, in gradients
return T.grad(loss, variables)
File "/usr/local/lib/python2.7/dist-packages/theano/gradient.py", line 436, in grad
raise TypeError("cost must be a scalar.")
TypeError: cost must be a scalar.

transpose error when running example of saliency

I am running keras with theano backend, versions:

pip show keras
Name: Keras
Version: 1.2.0
Summary: Deep Learning for Python
Home-page: https://github.com/fchollet/keras
Author: Francois Chollet
Author-email: [email protected]
License: MIT
Location: /mnt/gelu/anaconda2/envs/theano/lib/python2.7/site-packages
Requires: theano, pyyaml, six

Name: Theano
Version: 0.8.2
Summary: Optimizing compiler for evaluating mathematical expressions on CPUs and GPUs.
Home-page: http://deeplearning.net/software/theano/
Author: LISA laboratory, University of Montreal
Author-email: [email protected]
License: BSD
Location: /mnt/gelu/anaconda2/envs/theano/lib/python2.7/site-packages
Requires: six, numpy, scipy

When trying to reproduce the code in https://raghakot.github.io/keras-vis/visualizations/attention/
I get the following error:
Working on filters: [292]
Traceback (most recent call last):
File "", line 1, in
File "/mnt/gelu/fastai/fish/kerasvis.py", line 7, in
from vis.visualization import visualize_saliency
File "/mnt/gelu/anaconda2/envs/theano/lib/python2.7/site-packages/vis/visualization.py", line 156, in visualize_saliency
grads = utils.deprocess_image(grads[0])
File "/mnt/gelu/anaconda2/envs/theano/lib/python2.7/site-packages/vis/utils/utils.py", line 66, in deprocess_image
img = img.transpose((1, 2, 0))
ValueError: axes don't match array

Guided Back-propagation implementation

This is a useful tool for visualizations. Currently, it is missing from this wonderful library. It complements grad-CAM very well as highlighted in the grad-CAM paper.

Unexpected Keyword Argument 'jitter'

I got an error when trying to generate an attention map using visualize_saliency. On line 153 of visualization.py there is unexpected keyword argument jitter.

Refactor optimizer to use keras optimizer

Currently we are using custom numpy logic for rmsprop. Keras already provides optimizers that we should leverage. It is also much much better to run updates on GPU instead transitioning back and forth to numpy.

This has bigger implications..everything in numpy needs to be converted to use tensors. Ex: modifiers module.

Recommend Projects

  • React photo React

    A declarative, efficient, and flexible JavaScript library for building user interfaces.

  • Vue.js photo Vue.js

    ๐Ÿ–– Vue.js is a progressive, incrementally-adoptable JavaScript framework for building UI on the web.

  • Typescript photo Typescript

    TypeScript is a superset of JavaScript that compiles to clean JavaScript output.

  • TensorFlow photo TensorFlow

    An Open Source Machine Learning Framework for Everyone

  • Django photo Django

    The Web framework for perfectionists with deadlines.

  • D3 photo D3

    Bring data to life with SVG, Canvas and HTML. ๐Ÿ“Š๐Ÿ“ˆ๐ŸŽ‰

Recommend Topics

  • javascript

    JavaScript (JS) is a lightweight interpreted programming language with first-class functions.

  • web

    Some thing interesting about web. New door for the world.

  • server

    A server is a program made to process requests and deliver data to clients.

  • Machine learning

    Machine learning is a way of modeling and interpreting data that allows a piece of software to respond intelligently.

  • Game

    Some thing interesting about game, make everyone happy.

Recommend Org

  • Facebook photo Facebook

    We are working to build community through open source technology. NB: members must have two-factor auth.

  • Microsoft photo Microsoft

    Open source projects and samples from Microsoft.

  • Google photo Google

    Google โค๏ธ Open Source for everyone.

  • D3 photo D3

    Data-Driven Documents codes.