Coder Social home page Coder Social logo

mingrammer / diagrams Goto Github PK

View Code? Open in Web Editor NEW
34.9K 389.0 2.3K 47.77 MB

:art: Diagram as Code for prototyping cloud system architectures

Home Page: https://diagrams.mingrammer.com

License: MIT License

Shell 0.85% Python 94.91% JavaScript 3.66% CSS 0.22% Dockerfile 0.36%
diagram diagram-as-code architecture graphviz

diagrams's Introduction

diagrams logo

Diagrams

license pypi version python version Run tests todos contributors

Buy Me A Coffee

Diagram as Code.

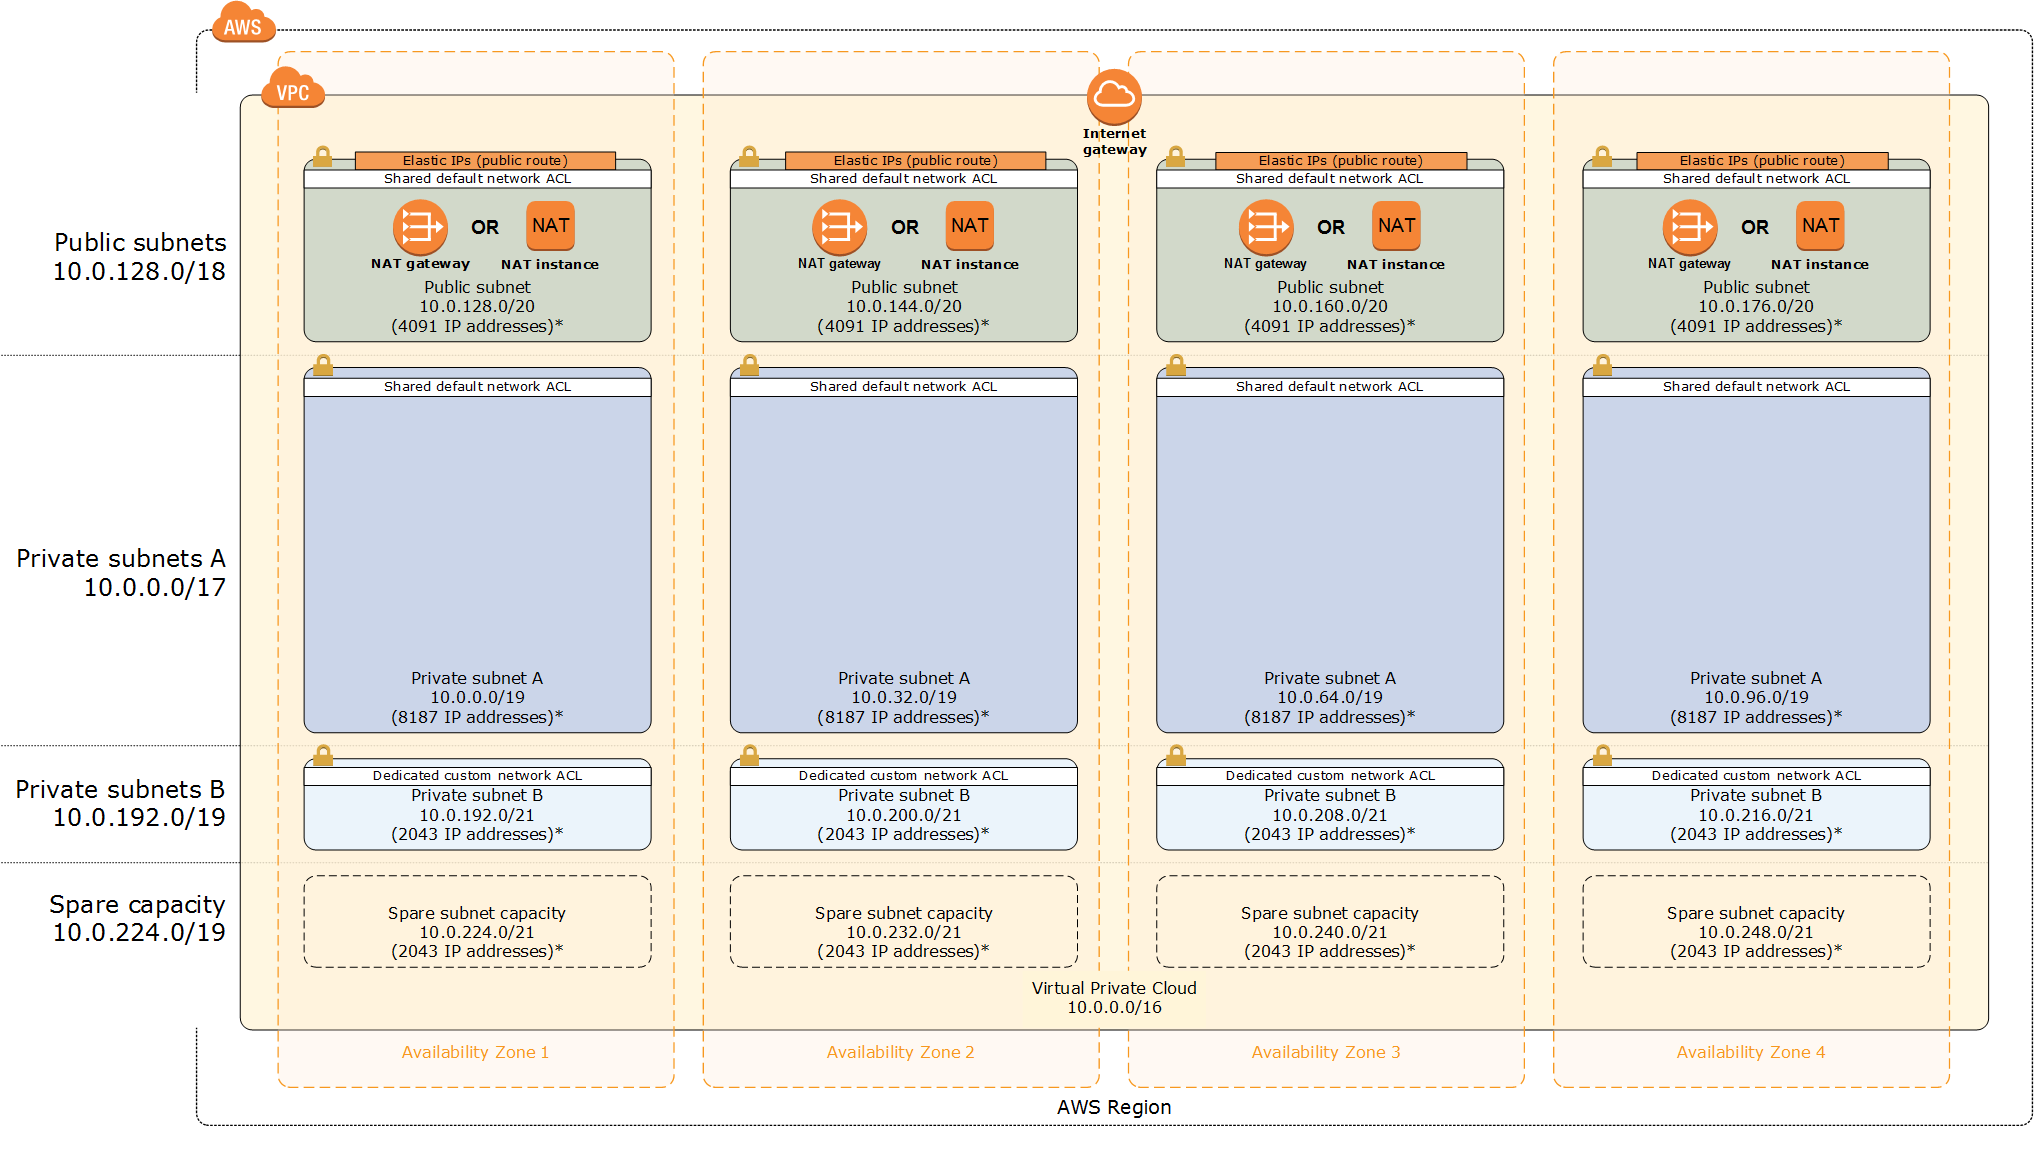
Diagrams lets you draw the cloud system architecture in Python code. It was born for prototyping a new system architecture design without any design tools. You can also describe or visualize the existing system architecture as well. Diagrams currently supports main major providers including: AWS, Azure, GCP, Kubernetes, Alibaba Cloud, Oracle Cloud etc... It also supports On-Premise nodes, SaaS and major Programming frameworks and languages.

Diagram as Code also allows you to track the architecture diagram changes in any version control system.

NOTE: It does not control any actual cloud resources nor does it generate cloud formation or terraform code. It is just for drawing the cloud system architecture diagrams.

Providers

aws provider azure provider gcp provider ibm provider kubernetes provider alibaba cloud provider oracle cloud provider openstack provider firebase provider digital ocean provider elastic provider outscale provider on premise provider generic provider programming provider saas provider c4 provider

Getting Started

It requires Python 3.7 or higher, check your Python version first.

It uses Graphviz to render the diagram, so you need to install Graphviz to use diagrams. After installing graphviz (or already have it), install the diagrams.

macOS users can download the Graphviz via brew install graphviz if you're using Homebrew.

# using pip (pip3)
$ pip install diagrams

# using pipenv
$ pipenv install diagrams

# using poetry
$ poetry add diagrams

You can start with quick start. Check out guides for more details, and you can find all available nodes list in here.

Examples

Event Processing Stateful Architecture Advanced Web Service
event processing stateful architecture advanced web service with on-premise

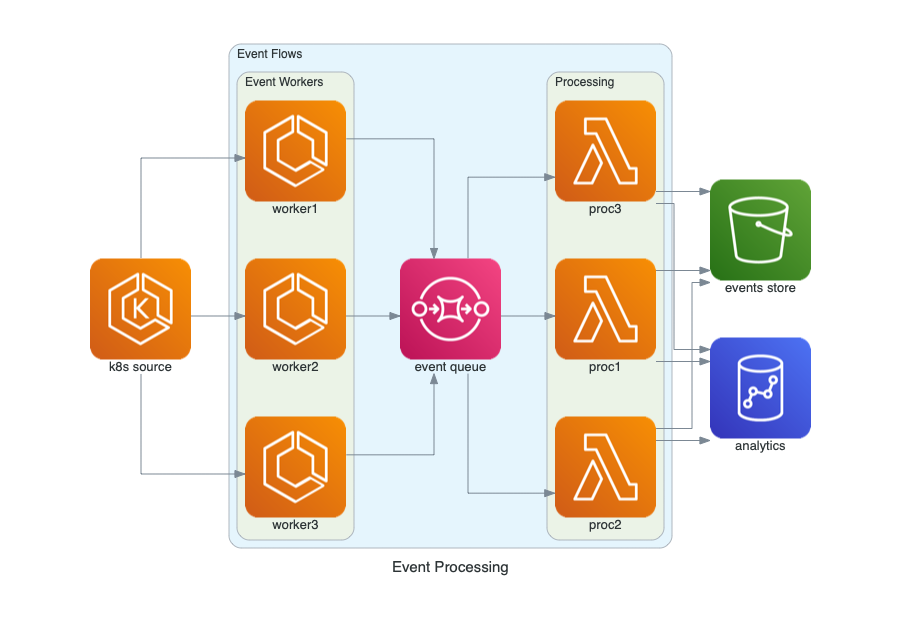
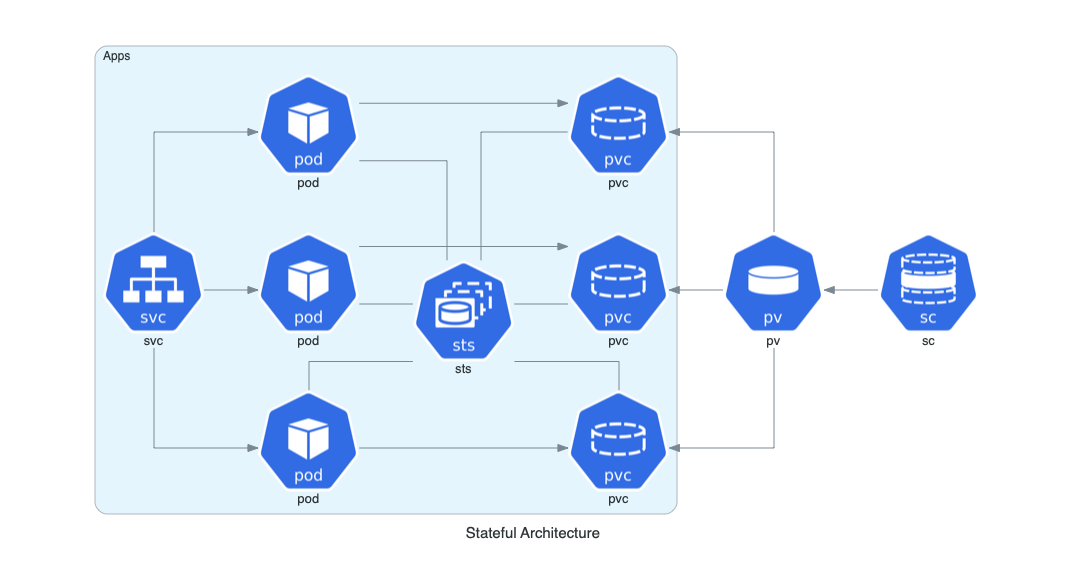
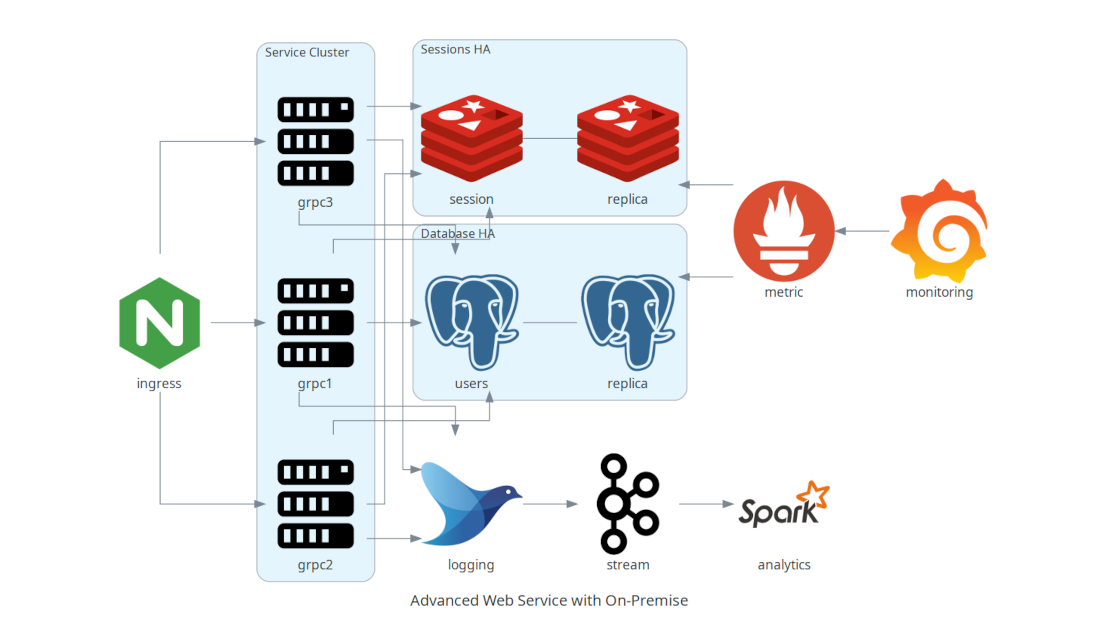
You can find all the examples on the examples page.

Contributing

To contribute to diagram, check out contribution guidelines.

Let me know if you are using diagrams! I'll add you in showcase page. (I'm working on it!) :)

Who uses it?

Apache Airflow is the most popular data workflow Orchestrator. Airflow uses Diagrams to generate architecture diagrams in their documentation.

Cloudiscovery helps you to analyze resources in your cloud (AWS/GCP/Azure/Alibaba/IBM) account. It allows you to create a diagram of analyzed cloud resource map based on this Diagrams library, so you can draw your existing cloud infrastructure with Cloudiscovery.

Airflow Diagrams is an Airflow plugin that aims to easily visualise your Airflow DAGs on service level from providers like AWS, GCP, Azure, etc. via diagrams.

Other languages

  • If you are familiar with Go, you can use go-diagrams as well.

License

MIT

diagrams's People

Contributors

avanier avatar bdsoha avatar cclauss avatar chewrocca avatar deogracia avatar dependabot[bot] avatar ewinnington avatar fabriziofortino avatar gabriel-tessier avatar guyzyl avatar hagaishapira avatar lazzurs avatar leandrodamascena avatar lrjball avatar lucianf avatar mandalae avatar meshuga avatar mingrammer avatar nlamirault avatar outscale-mgo avatar pyaillet avatar rajat404 avatar rcheese avatar ryancheley avatar ryanmillerc avatar slach avatar timgates42 avatar viicos avatar yu-iskw avatar zendern avatar

Stargazers

 avatar  avatar  avatar  avatar  avatar  avatar  avatar  avatar  avatar  avatar  avatar  avatar  avatar  avatar  avatar  avatar  avatar  avatar  avatar  avatar  avatar  avatar  avatar  avatar  avatar  avatar  avatar  avatar  avatar  avatar  avatar  avatar  avatar  avatar  avatar  avatar  avatar  avatar  avatar  avatar  avatar  avatar  avatar  avatar  avatar  avatar  avatar  avatar  avatar  avatar  avatar  avatar  avatar  avatar  avatar  avatar  avatar  avatar  avatar  avatar  avatar  avatar  avatar  avatar  avatar  avatar  avatar  avatar  avatar  avatar  avatar  avatar  avatar  avatar  avatar  avatar  avatar  avatar  avatar  avatar  avatar  avatar  avatar  avatar  avatar  avatar  avatar  avatar  avatar  avatar  avatar  avatar  avatar  avatar  avatar  avatar  avatar  avatar  avatar  avatar

Watchers

 avatar  avatar  avatar  avatar  avatar  avatar  avatar  avatar  avatar  avatar  avatar  avatar  avatar  avatar  avatar  avatar  avatar  avatar  avatar  avatar  avatar  avatar  avatar  avatar  avatar  avatar  avatar  avatar  avatar  avatar  avatar  avatar  avatar  avatar  avatar  avatar  avatar  avatar  avatar  avatar  avatar  avatar  avatar  avatar  avatar  avatar  avatar  avatar  avatar  avatar  avatar  avatar  avatar  avatar  avatar  avatar  avatar  avatar  avatar  avatar  avatar  avatar  avatar  avatar  avatar  avatar  avatar  avatar  avatar  avatar  avatar  avatar  avatar  avatar  avatar  avatar  avatar  avatar  avatar  avatar  avatar  avatar  avatar  avatar  avatar  avatar  avatar  avatar  avatar  avatar  avatar  avatar  avatar  avatar  avatar  avatar  avatar  avatar  avatar  avatar

diagrams's Issues

Unable to install from git repo

$ pip install git+https://github.com/mingrammer/diagrams.git
Collecting diagrams
  Cloning https://github.com/mingrammer/diagrams.git to /tmp/pip-install-zdyzzhwr/diagrams
  Running command git clone -q https://github.com/mingrammer/diagrams.git /tmp/pip-install-zdyzzhwr/diagrams
  Installing build dependencies ... done
  Getting requirements to build wheel ... done
    Preparing wheel metadata ... done
Building wheels for collected packages: unknown, unknown
  Building wheel for unknown (PEP 517) ... done
  Created wheel for unknown: filename=UNKNOWN-0.0.0-py3-none-any.whl size=1793 sha256=93f4e178ba3c2f880603d05c884d9d14d3d322f5608ec62b1d2eb39e62ab4f1e
  Stored in directory: /tmp/pip-ephem-wheel-cache-eg2nh1lt/wheels/c7/24/85/a8af6e1f27e0c24832c17821bdb6065697ff028f31e6a6ac5d
  Building wheel for unknown (PEP 517) ... done
  Created wheel for unknown: filename=UNKNOWN-0.0.0-py3-none-any.whl size=1793 sha256=93f4e178ba3c2f880603d05c884d9d14d3d322f5608ec62b1d2eb39e62ab4f1e
  Stored in directory: /tmp/pip-ephem-wheel-cache-eg2nh1lt/wheels/a3/19/3f/ef83c6a207c0f5f7acbc4a25c53aa54d690ac4dd6b201ccd1e
Successfully built unknown unknown
pInstalling collected packages: unknown
Successfully installed unknown-0.0.0
$ pip freeze
graphviz==0.13.2
Jinja2==2.11.1
MarkupSafe==1.1.1
UNKNOWN==0.0.0
$

It installs as 'UNKNOWN==0.0.0' instead of diagrams.

Is there a way to have arrows to and from Clusters

I want to have arrows from and to Clusters, e.g.

    ELB("lb") >> Cluster("cluster1")
    // OR
    Cluster("cluster1") >> Cluster("cluster2")
    // OR
    with Cluster("cluster1"):
        cluster1 = [EC2("node1"),
                    EC2("node2"),
                    EC2("node3")]

    with Cluster("cluster2"):
        cluster2 = [EC2("node1"),
                    EC2("node2"),
                    EC2("node3")]
    cluster1 >> cluster2

All of them throw an exception right now. Is this use case supported or planned? Is there a workaround?

Control size of nodes (cluster), position of nodes

Hey guys, thanks so much for this library! Congrats on amazing work and beautiful diagrams.

I've been looking through the code and graphviz options to control the size of nodes (for example, pods in a namespace) or size of cluster node and relative position (for example, left/center/right top/middle/bottom align). This is not really an issue, but a question. Is it possible to control these? node_attr works, but it's applied globally.

Newlines in labels result in padding issues

The following code:

from diagrams import Diagram
from diagrams.aws.network import Route53 as DNS


with Diagram("Newline example", show=False):
    other_dns = DNS("One line DNS")
    newline_dns = DNS("Newline\nDNS")

Results in bad formatting for labels:

newline_example

Not sure how I can properly push the label down. Looks fine for single line, but multi-line labels end up pretty bad.


Relevant debugging info:

$ python -V
Python 3.7.6
$ pip freeze | grep diagrams
diagrams==0.5.0
$ brew info graphviz
graphviz: stable 2.42.2 (bottled), HEAD

Allow any Node to behave as a Cluster

In the diagrams library, there is a distinction between Clusters and Nodes. A node is a single entity, while a cluster is to group things. As an improvement, I would like to use any Node defined in the libraries as a Cluster too.

Let me elaborate based on the AWS VPC architecture diagram:

VPC Design

The VPC (diagrams.aws.network.VPC) is the outer entity here, but drawn as a cluster in which other entities can be placed. In the image, you see Subnets, Network ACLs, Elastic IPs nested within each other.

In diagrams code, this could be written as:

from diagrams.aws.network import VPC
from diagrams.aws.compute import EC2

with VPC("production") as prodVPC:
   EC2("bastion")

If each node could be used as a cluster too, it would immediately solve #17. 😉

Peer to Peer Network

Is it possible to draw a peer-to-peer network? In the docs I didn't find a solution

Support for empty cluster nodes

It appears that cluster nodes are not rendered if they are empty. However there are use cases, such as diagramming a VPC with public/private subnets, where it would be beneficial to render them even if there is nothing in them.

Would it be feasible to add either a blank/white dummy node to hold space inside the cluster, or else support clusters to be rendered (with some minimal height and width) even if they are empty?

Embed images into svg output

When choosing svg as the output type, the generated svg file references images to python site-packages installation folder. For example:

<image xlink:href="/Users/adam/.virtualenvs/py3.8/lib/python3.8/site-packages/resources/azure/compute/vm.png".../>

When sharing the generated svg files, the receiver doesn't always have diagrams package installed, or installed at a different location.

Can we make it configurable so that we can embed the images in the generated svg file?

graphviz-dot problem with simple example

VERSION-INFO: diagrams 0.3.0, graphviz 0.13.2 (Python package), graphviz dot 2.43.0, Python 3.8.0, macOS

Example:

# -- FILE: diagram_1.py
from diagrams import Diagram
from diagrams.aws.compute import EC2

with Diagram("Simple Diagram"):
    EC2("web")
$ python diagram_1.py
...
graphviz.backend.CalledProcessError: Command '['dot', '-Tjpg', '-O', 'simple_diagram']' died with <Signals.SIGILL: 4>. [stderr: b'']

Seems to be related to constuct image=".../resources/aws/compute/ec2.png" in "simple_diagram" dot-file. If I remove this construct, I can process the dot-file just fine with dot.

Text on arrow

I am looking for a way to represent ALB listener rules. Is there a way to have text on an arrow, something like this?

Misaligned Node Labels

By the way, excellent project!

I've run the examples but the node labels are bad aligned. Maybe I'm using some incompatible graphviz version

  • graphviz: 2.40.1-2
  • diagrams: 0.2.1

clustered_web_services

Client node support

Thanks for your work.

Could you consider to add nodes for clients, like a smartphone or PC? I'm not sure if that's in the scope of the project but it would be great if you could show connections between front-end (CloudFront etc) nodes and client.

Edge error in 0.7.2 when running example diagram

I ran the example edge code from https://diagrams.mingrammer.com/docs/guides/edge

I receive the following error on Windows:
File "c:/Users/username/Documents/diagrams/edge.py", line 27, in
grpcsvc >> Edge(color="brown") >> master
File "C:\Users\username\AppData\Local\Programs\Python\Python38-32\lib\site-packages\diagrams_init_.py", line 474, in rrshift
return self.append(other, forward=True)
File "C:\Users\username\AppData\Local\Programs\Python\Python38-32\lib\site-packages\diagrams_init_.py", line 489, in append
result.append(Edge(o, forward=forward, reverse=reverse, **self._attrs))
TypeError: init() got an unexpected keyword argument 'xlabel'

Add Firebase icon

I'd like to submit a pull request with adding the icon for Firebase.

firebase

I'm just not sure in which section, since it's not actually a Google Cloud Platform product.

Any suggestions, @mingrammer?

Where to find the documentation?

I read the documentation but there is only examples, where to find the full documentation? I mean all available modules and icons?

Thanks

Make icons more visible in the docs

Motivation

We already have the documentations about the nodes. Those would help us knowing what products we can use. Meanwhile, they can get better by showing the icon images. What if we can see the icon images on the docs?

Suggestion

We probably have the two options to make the icon images visible on the docs.

  1. We create new pages or markdown files for lists of the icons.
  2. We show an icon image when hovering the node.

The second options looks like the following. When hovering a node, the icon image is popped up.
2020-03-24_diagram-suggestion

Impossible to import

ImportError: cannot import name 'Diagram' from partially initialized module 'diagrams'

prp diagrams.py ─╯
Traceback (most recent call last):
File "diagrams.py", line 2, in
from diagrams import diagram
File "/Users/daman/MISSION/M-ALTAVIA/ALTAVIA/iac/all_cluster/archi/diagrams.py", line 2, in
from diagrams import diagram
ImportError: cannot import name 'diagram' from partially initialized module 'diagrams' (most likely due to a circular import) (/archi/diagrams.py)

i used pipenv

Specify dot executable path?

I want to run in an environment (Azure Functions) where I have limited control over the setup other than listing dependencies in requirements.txt. This makes the code fail e.g. because the „dot“ executable is not in the PATH. Is there a way to specify the full path or otherwise get this running?

Enable a custom node.

Hello,

this package is awesome to doc diagrams on git repo, congratulations. I started to use inside Talkdesk and I made a small change to enable custom images for any kind of infra/service.

Do you think this could be a nice addition to the package? If yes, I can open a PR to add it.

Thanks
Daniel

Kubernetes Support

Do you have a plan to support Kubernetes layer?

I think that resources frequently refered on AWS contains Ingress, Deployment, Service, StatefulSet and so on.

Thank you.

.zip release format breaks Anaconda build

Hi there -

Just wanted to pass along that having your release on Pypi as a .zip file instead of a .tar.gz breaks the Anaconda build process. Some part of the conda build process assumes a .tar.gz file downloaded from Pypi. The only way to fix the recipe is to manually change the meta.yaml file that gets generated to specify .zip.

Here's my conda info:

     active environment : None
       user config file : $HOME\.condarc
 populated config files : $HOME\.condarc
          conda version : 4.8.2
    conda-build version : 3.17.8
         python version : 3.7.3.final.0
       virtual packages : __cuda=10.1
       base environment : C:\ProgramData\Anaconda3  (writable)
           channel URLs : https://repo.anaconda.com/pkgs/main/win-64
                          https://repo.anaconda.com/pkgs/main/noarch
                          https://repo.anaconda.com/pkgs/r/win-64
                          https://repo.anaconda.com/pkgs/r/noarch
                          https://repo.anaconda.com/pkgs/msys2/win-64
                          https://repo.anaconda.com/pkgs/msys2/noarch
          package cache : C:\ProgramData\Anaconda3\pkgs
                          $HOME\.conda\pkgs
                          $HOME\AppData\Local\conda\conda\pkgs
       envs directories : C:\ProgramData\Anaconda3\envs
                          $HOME\.conda\envs
                          $HOME\AppData\Local\conda\conda\envs
               platform : win-64
             user-agent : conda/4.8.2 requests/2.21.0 CPython/3.7.3 Windows/10 Windows/10.0.17134
          administrator : True
             netrc file : None
           offline mode : False

To reproduce:

$ conda skeleton pypi graphviz
$ conda build graphviz

FYI - this is true if you run conda skeleton pypi graphviz and conda skeleton pypi graphviz --recursive.

Here is the output:

Preparing transaction: ...working... done
Verifying transaction: ...working... done
Executing transaction: ...working... done
WARNING: symlink_conda() is deprecated.
Collecting package metadata (repodata.json): ...working... done
Solving environment: ...working... done
WARNING: symlink_conda() is deprecated.
Source cache directory is: C:\ProgramData\Anaconda3\conda-bld\src_cache
INFO:conda_build.source:Source cache directory is: C:\ProgramData\Anaconda3\conda-bld\src_cache
INFO conda_build.source:download_to_cache(43): Source cache directory is: C:\ProgramData\Anaconda3\conda-bld\src_cache
Downloading source to cache: graphviz-0.13.2_60acbeee34.tar.gz
INFO:conda_build.source:Downloading source to cache: graphviz-0.13.2_60acbeee34.tar.gz
INFO conda_build.source:download_to_cache(66): Downloading source to cache: graphviz-0.13.2_60acbeee34.tar.gz
Downloading https://pypi.io/packages/source/g/graphviz/graphviz-0.13.2.tar.gz
INFO:conda_build.source:Downloading https://pypi.io/packages/source/g/graphviz/graphviz-0.13.2.tar.gz
INFO conda_build.source:download_to_cache(80): Downloading https://pypi.io/packages/source/g/graphviz/graphviz-0.13.2.tar.gz
Error: HTTP 404 NOT FOUND for url <https://pypi.io/packages/source/g/graphviz/graphviz-0.13.2.tar.gz>
Elapsed: 00:00.408915

An HTTP error occurred when trying to retrieve this URL.
HTTP errors are often intermittent, and a simple retry will get you on your way.
WARNING:conda_build.source:Error: HTTP 404 NOT FOUND for url <https://pypi.io/packages/source/g/graphviz/graphviz-0.13.2.tar.gz>
Elapsed: 00:00.408915

An HTTP error occurred when trying to retrieve this URL.
HTTP errors are often intermittent, and a simple retry will get you on your way.
WARNING conda_build.source:download_to_cache(84): Error: HTTP 404 NOT FOUND for url <https://pypi.io/packages/source/g/graphviz/graphviz-0.13.2.tar.gz>

If you modify the recipe meta.yaml file to manually point to a .zip extension, it just works.

You're within your rights to say that maybe this is a conda or Pypi issue, but I thought I'd document it here.

Add images for common data filetypes

Would be great to include creative commons logos for stuff like:

  • csv
  • excel
  • parquet

These could be used for dataflows to show how data is being moved around a system :)

Add TODOs Badge to README

Hi there! I wanted to propose adding the following badge to the README to indicate how many TODO comments are in this codebase:

TODOs

The badge links to tickgit.com which is a free service that indexes and displays TODO comments in public github repos. It can help surface latent work and be a way for contributors to find areas of code to improve, that might not be otherwise documented.

The markdown is:

[![TODOs](https://badgen.net/https/api.tickgit.com/badgen/github.com/mingrammer/diagrams)](https://www.tickgit.com/browse?repo=github.com/mingrammer/diagrams)

Thanks for considering, feel free to close this issue if it's not appropriate or you prefer not to!

(full disclosure, I am the creator/maintainer of tickgit)

Inline show only (no file)

Great lib! It would be awesome to have more convenience when using diagrams in notebook (e.g. Jupyter). Is there a way of having no file saved and only showing inline (such as matplotlib)?

Feature Request : Diagrams on the web

Convert the output from png to a web format (using viz.js) so that the rendered output can be shared via a link. The generation can also be done on the web page using a simple editor.

I am willing to work on the same .

[Bug][Installation] ModuleNotFoundError: contextvars

OS: MacOS Catalina 10.15 Beta (19A536g)
Python Version: Python 3.6.5
I installed diagrams in a new virtual environment, using pip

While it installed the package successfully, when I tried to run the example mentioned in Quickstart guide, I got ModuleNotFoundError: No module named 'contextvars' error.

I believe the lib contextvcars needs to be specified in the setup file

Multi cloud diagrams

Any quick example for multicloud example , per example shared pubsub topic shared by Azure and GCP dataproc cluster ?

Feature request: Terraform support

The diagrams that are generated are amazingly good looking. Excellent job! If a terraform script could be used as input to automatically generate them then any cloud consultant and audit department would use it in their DevOps pipeline because just like JavaDocs for Java, it would be the no brainier to generate cloud documentation. Would that be possible?

Icons not included into the resulting svg and as a result can not be imported into the SaaS such as draw.io

Icons not included into the resulting svg and as a result can not be imported into the SaaS such as draw.io

Hi, thanks, cool project,
I was following guides and created example and changed outformat="svg"

However svg generated contains following:

<g id="node5" class="node">
<title>3f42a5b2346adbddd04f3b60e84ea285</title>
<image xlink:href="/Users/test/.local/share/virtualenvs/diag-AzfPdfmQ/lib/python3.7/site-packages/resources/aws/compute/elastic-container-service.png" width="101px" height="101px" preserveAspectRatio="xMinYMin meet" x="310" y="-470.5"/>
<text text-anchor="middle" x="360.5" y="-358.1" font-family="Sans-Serif" font-size="13.00" fill="#2d3436">web3</text>
</g>

I.e. it references icons from filesystem, as a result, when I try to upload this svg to SaaS such as draw.io it results in image being rendered without icons, i.e.

image

Is there any way to embed icons in the resulting SVG?

Switch the code engine to any Pulumi supported language?

Your project is awesome and really helpful. The only drawback is that your syntax stands on its own as a standalone library.

Not sure if you know Pulumi. This is a tool which allows to implement and provision cloud resources. Providers can be built for anything which has an API.

I'm wondering how easy it would be hook your graph generation to the Pulumi engine to generate diagrams of what was written in code.

Recommend Projects

  • React photo React

    A declarative, efficient, and flexible JavaScript library for building user interfaces.

  • Vue.js photo Vue.js

    🖖 Vue.js is a progressive, incrementally-adoptable JavaScript framework for building UI on the web.

  • Typescript photo Typescript

    TypeScript is a superset of JavaScript that compiles to clean JavaScript output.

  • TensorFlow photo TensorFlow

    An Open Source Machine Learning Framework for Everyone

  • Django photo Django

    The Web framework for perfectionists with deadlines.

  • D3 photo D3

    Bring data to life with SVG, Canvas and HTML. 📊📈🎉

Recommend Topics

  • javascript

    JavaScript (JS) is a lightweight interpreted programming language with first-class functions.

  • web

    Some thing interesting about web. New door for the world.

  • server

    A server is a program made to process requests and deliver data to clients.

  • Machine learning

    Machine learning is a way of modeling and interpreting data that allows a piece of software to respond intelligently.

  • Game

    Some thing interesting about game, make everyone happy.

Recommend Org

  • Facebook photo Facebook

    We are working to build community through open source technology. NB: members must have two-factor auth.

  • Microsoft photo Microsoft

    Open source projects and samples from Microsoft.

  • Google photo Google

    Google ❤️ Open Source for everyone.

  • D3 photo D3

    Data-Driven Documents codes.