Latex code for drawing neural networks for reports and presentation. Have a look into examples to see how they are made. Additionally, lets consolidate any improvements that you make and fix any bugs to help more people with this code.
Following are some network representations:
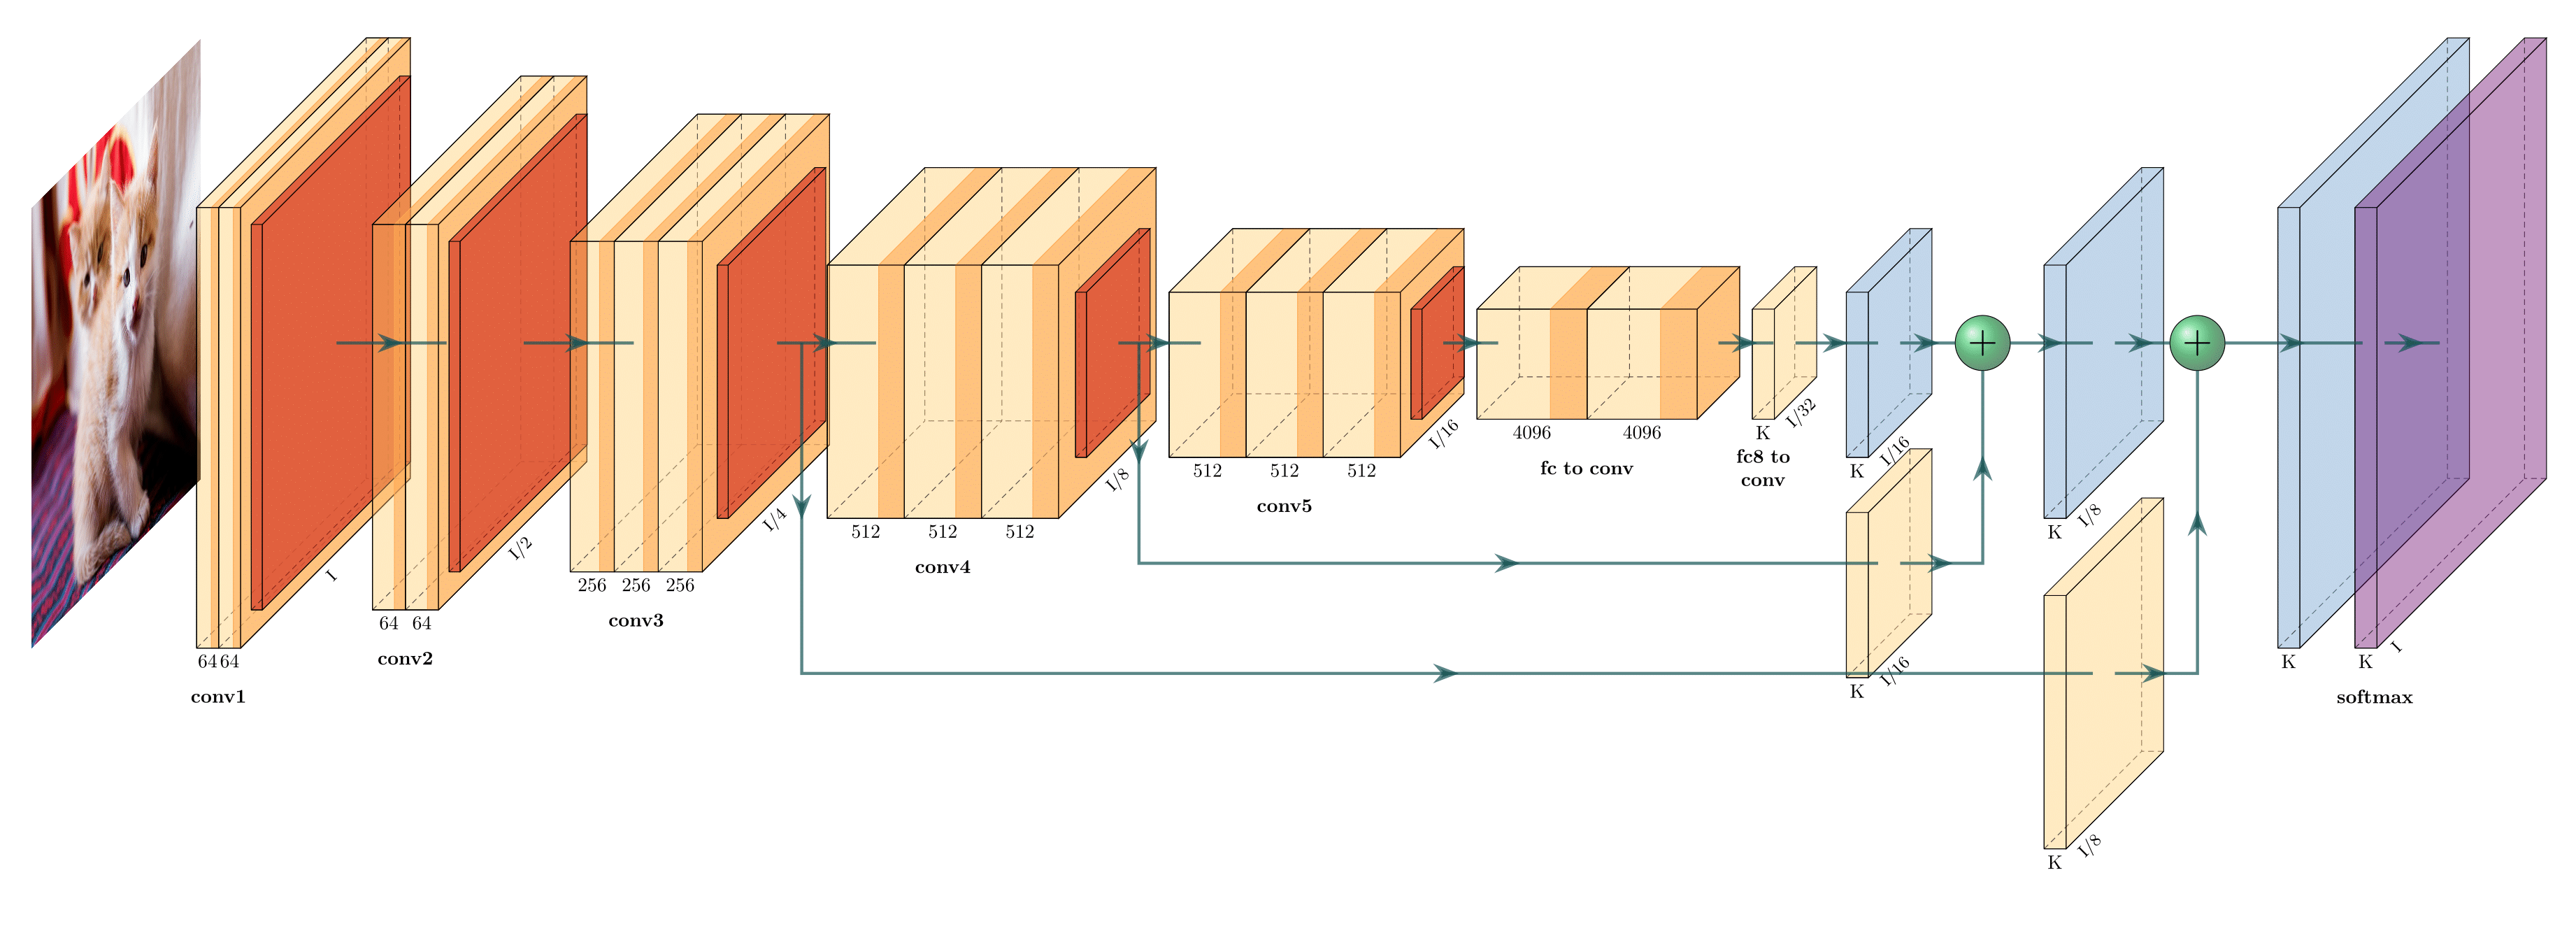
FCN-8 (view on Overleaf)
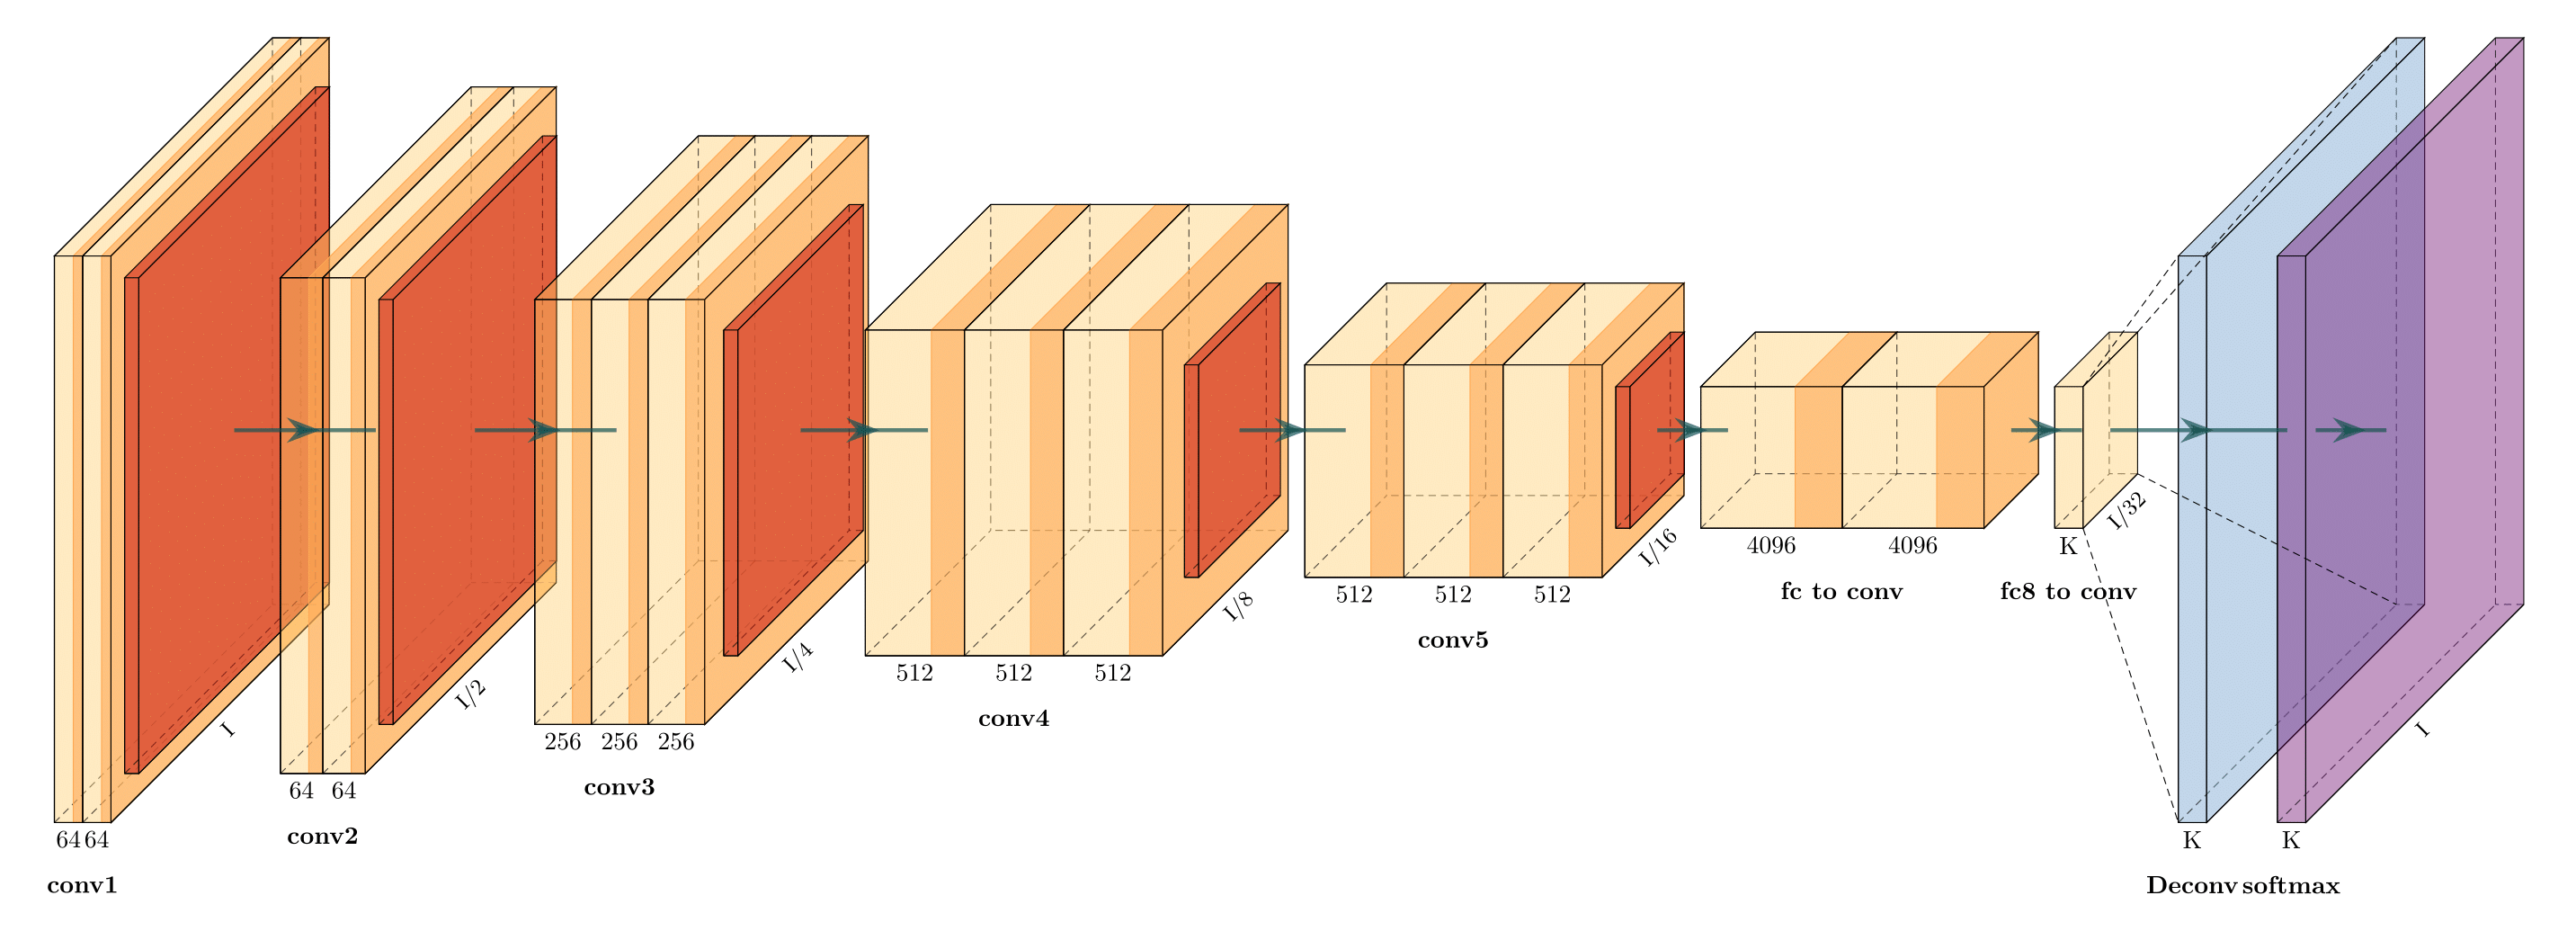
FCN-32 (view on Overleaf)

Holistically-Nested Edge Detection (view on Overleaf)
-
Install the following packages on Ubuntu.
-
Ubuntu 16.04
sudo apt-get install texlive-latex-extra -
Ubuntu 18.04.2 Base on this website, please install the following packages.
sudo apt-get install texlive-latex-base sudo apt-get install texlive-fonts-recommended sudo apt-get install texlive-fonts-extra sudo apt-get install texlive-latex-extra -
Windows
- Download and install MikTeX.
- Download and install bash runner on Windows, recommends Git bash or Cygwin(https://www.cygwin.com/)
-
-
Execute the example as followed.
cd pyexamples/
bash ../tikzmake.sh test_simple
- Python interface
- Add easy legend functionality
- Add more layer shapes like TruncatedPyramid, 2DSheet etc
- Add examples for RNN and likes.
See examples directory for usage.
First, create a new directory and a new Python file:
$ mkdir my_project
$ cd my_project
vim my_arch.py
Add the following code to your new file:
import sys
sys.path.append('../')
from pycore.tikzeng import *

# defined your arch
arch = [
    to_head( '..' ),
    to_cor(),
    to_begin(),
    to_Conv("conv1", 512, 64, offset="(0,0,0)", to="(0,0,0)", height=64, depth=64, width=2 ),
    to_Pool("pool1", offset="(0,0,0)", to="(conv1-east)"),
    to_Conv("conv2", 128, 64, offset="(1,0,0)", to="(pool1-east)", height=32, depth=32, width=2 ),
    to_connection( "pool1", "conv2"),
    to_Pool("pool2", offset="(0,0,0)", to="(conv2-east)", height=28, depth=28, width=1),
    to_SoftMax("soft1", 10 ,"(3,0,0)", "(pool1-east)", caption="SOFT"  ),
    to_connection("pool2", "soft1"),
    to_end()
    ]

def main():
    namefile = str(sys.argv[0]).split('.')[0]
    to_generate(arch, namefile + '.tex' )

if __name__ == '__main__':
    main()
Now, run the program as follows:
bash ../tikzmake.sh my_arch


