Coder Social home page Coder Social logo

gmplot's Introduction

gmplot PyVersions_

A matplotlib-like interface to render all the data you'd like on top of Google Maps.

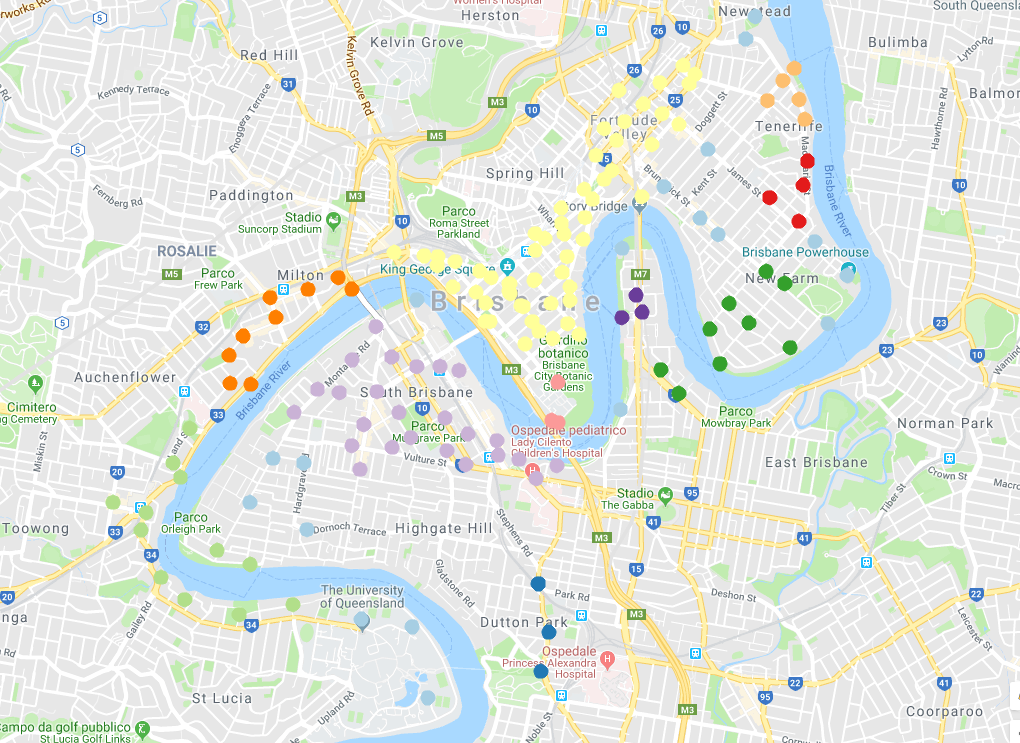
Several plotting methods make creating exploratory map views effortless.

To install: pip install gmplot

Documentation (with examples): API Reference

Crash course

import gmplot

# Create the map plotter:
apikey = '' # (your API key here)
gmap = gmplot.GoogleMapPlotter(37.766956, -122.448481, 14, apikey=apikey)

# Mark a hidden gem:
gmap.marker(37.770776, -122.461689, color='cornflowerblue')

# Highlight some attractions:
attractions_lats, attractions_lngs = zip(*[
    (37.769901, -122.498331),
    (37.768645, -122.475328),
    (37.771478, -122.468677),
    (37.769867, -122.466102),
    (37.767187, -122.467496),
    (37.770104, -122.470436)
])
gmap.scatter(attractions_lats, attractions_lngs, color='#3B0B39', size=40, marker=False)

# Outline the Golden Gate Park:
golden_gate_park = zip(*[
    (37.771269, -122.511015),
    (37.773495, -122.464830),
    (37.774797, -122.454538),
    (37.771988, -122.454018),
    (37.773646, -122.440979),
    (37.772742, -122.440797),
    (37.771096, -122.453889),
    (37.768669, -122.453518),
    (37.766227, -122.460213),
    (37.764028, -122.510347)
])
gmap.polygon(*golden_gate_park, color='cornflowerblue', edge_width=10)

# Draw the map to an HTML file:
gmap.draw('map.html')

image


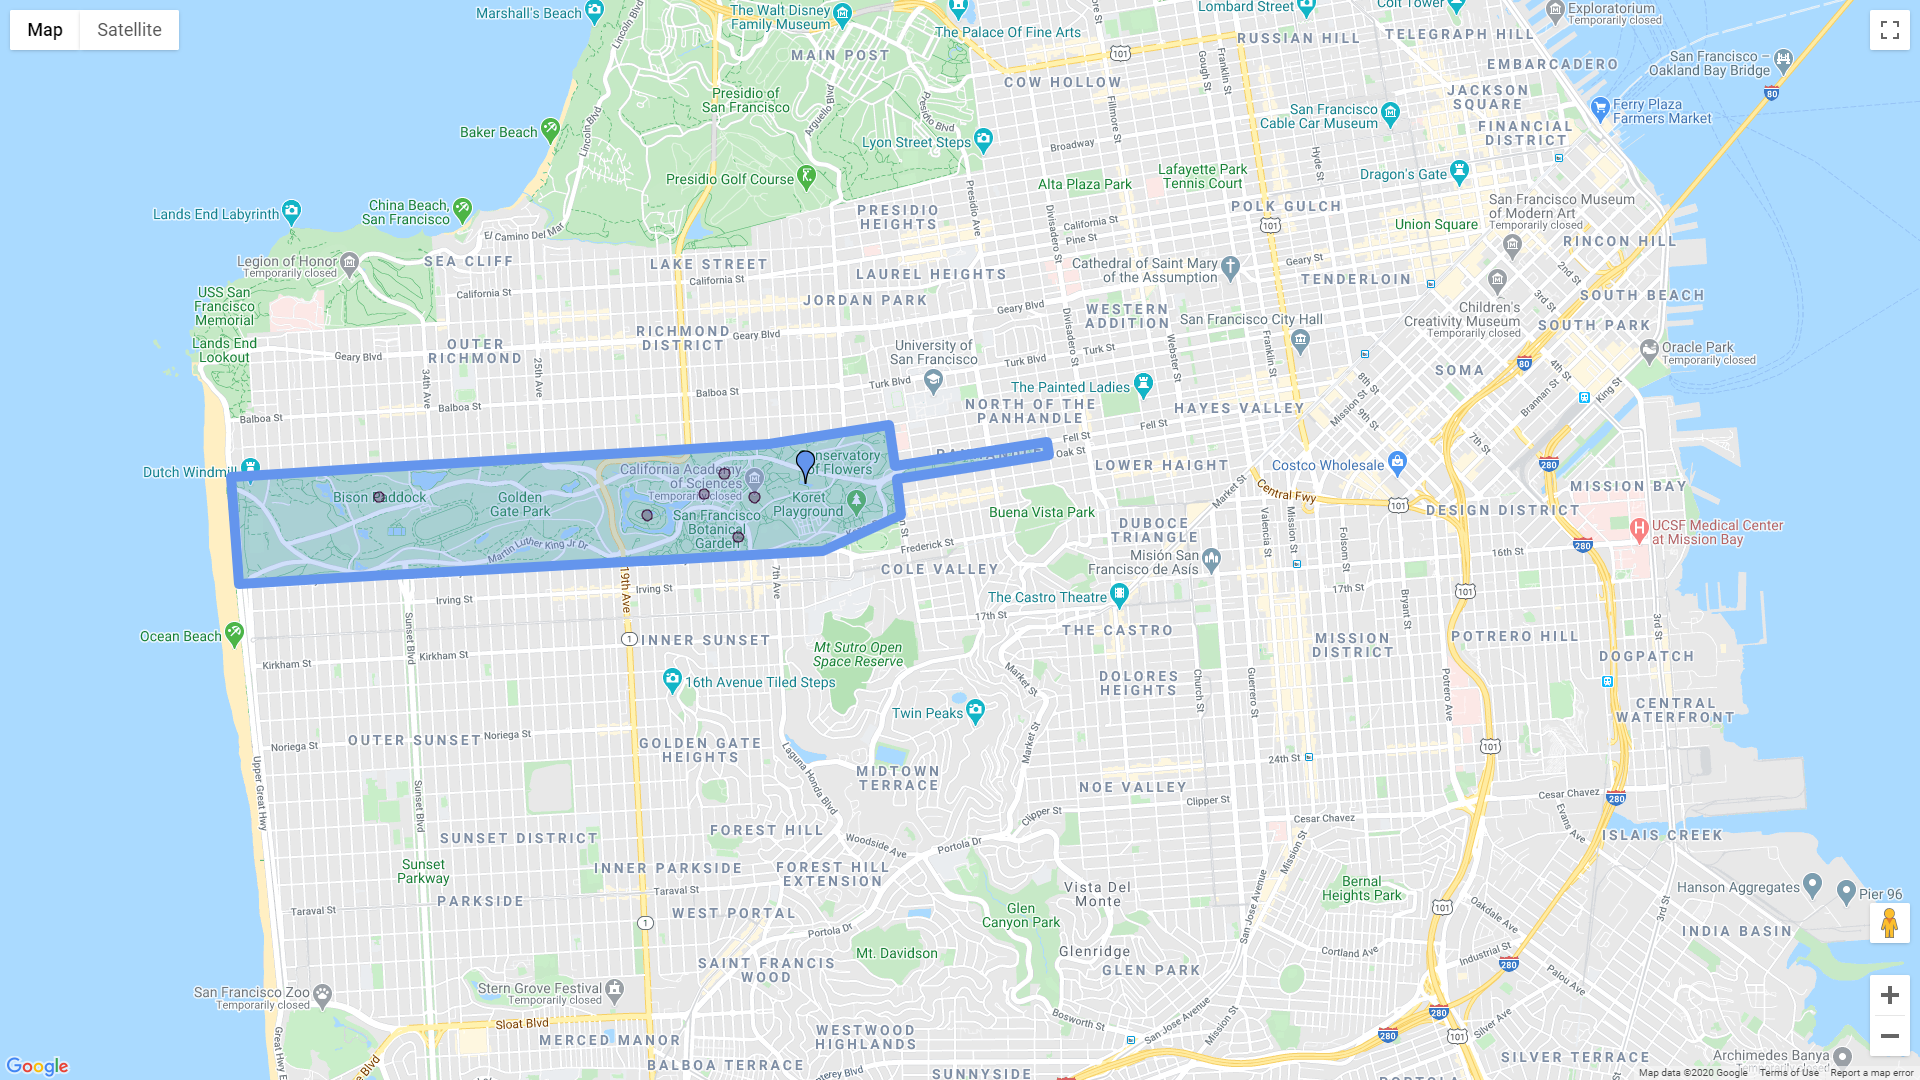
Inspired by Yifei Jiang's ([email protected]) pygmaps module.

gmplot's People

Contributors

0xekez avatar andibarg avatar andrew-schweitzer-analog avatar arthurgoodman avatar caique-lima avatar datarup avatar denisbilli avatar dfenucci avatar ecgill avatar frmsaul avatar frslm avatar fujistoo avatar giolaq avatar monti03 avatar mxrch avatar nziehn avatar omritreidel avatar paololucchino avatar sandrotosi avatar scornelissen85 avatar tirkarthi avatar unepierre avatar vgm64 avatar victornorman avatar wmv avatar

Stargazers

 avatar  avatar  avatar  avatar  avatar  avatar  avatar  avatar  avatar  avatar  avatar  avatar  avatar  avatar  avatar  avatar  avatar  avatar  avatar  avatar  avatar  avatar  avatar  avatar  avatar  avatar  avatar  avatar  avatar  avatar  avatar  avatar  avatar  avatar  avatar  avatar  avatar  avatar  avatar  avatar  avatar  avatar  avatar  avatar  avatar  avatar  avatar  avatar  avatar  avatar  avatar  avatar  avatar  avatar  avatar  avatar  avatar  avatar  avatar  avatar  avatar  avatar  avatar  avatar  avatar  avatar  avatar  avatar  avatar  avatar  avatar  avatar  avatar  avatar  avatar  avatar  avatar  avatar  avatar  avatar  avatar  avatar  avatar  avatar  avatar  avatar  avatar  avatar  avatar  avatar  avatar  avatar  avatar  avatar  avatar  avatar  avatar  avatar  avatar  avatar

Watchers

 avatar  avatar  avatar  avatar  avatar  avatar  avatar  avatar  avatar  avatar  avatar  avatar  avatar  avatar  avatar  avatar  avatar  avatar  avatar  avatar  avatar  avatar  avatar  avatar  avatar  avatar  avatar  avatar  avatar  avatar  avatar  avatar  avatar  avatar  avatar  avatar  avatar  avatar

gmplot's Issues

Close instance

How do I close the gmplot instance, in similarity to what we do with matplot lib i.e. plt.close()?

After I draw once, the next maps are always empty. So, I guess closing would solve this issue.

Title of scatter's markers

Hi,
We can use markers as scatter points.
Can I add title str to those markers like normal marker ?
Or can I display markers without word balloons ?

Setting alpha=0 is ignored

Setting either of the alpha values to 0.0 is ignored due to the way the code is implemented. e.g.:

kwargs.get("alpha", None) or
kwargs.get("face_alpha", None) or
kwargs.get("fa", None) or
0.3

will result in 0.3 if given face_alpha=0.0, because 0.0 is converted to False

Add differnt markers

Hi there,
I like to visualize a route with gmplot. This route has single origin, single destination, and multiple way points. I'd like to add different marker for all origin, destination, and way points. I tried this but it doesn't work. It keep just the last change and make all markers identical to this last change. Any help will be appreciated.

def plot_markers(self, gm_plotter, lats, lngs, titles):
    """
    This method plot marker to GoogleMapPlotter. Where lats[0] and lngs[0] is the origin, lats[-1] and lngs[-1] 
    is the desination, and all the inbetween are waypoints. 
    :param gm_plotter: GoogleMapPlotter object
    :param lats: (list of floats) a list of latitudes
    :param lngs: (list of floats) a list of longitudes.
    :return: (GoogleMapPlotter) google map plotter object that could be for further processing.
    """
    gm_plotter.coloricon = 'http://www.googlemapsmarkers.com/v1/'+titles[0]+'/%s/FFFFFF/0080ff/' 
    gm_plotter.marker(lats[0], lngs[0], title=titles[0])
    gm_plotter.coloricon = 'http://www.googlemapsmarkers.com/v1/' + titles[-1] + '/%s/FFFFFF/0080ff/'
    gm_plotter.marker(lats[-1], lngs[-1], title=titles[-1])
    for lat, lng, title in zip(lats[1:-1], lngs[1:-1], titles[1:-1]):
        gm_plotter.coloricon = 'http://www.googlemapsmarkers.com/v1/' + title + '/%s/FFFFFF/0080ff/'
        gm_plotter.marker(lat, lng, title=title)
    return gm_plotter

NameError: name 'latitudes' is not defined

I installed the newest version of gmplot on my machine. but when I execute the sample code:
import gmplot

gmap = gmplot.GoogleMapPlotter(37.428, -122.145, 16)

gmap.plot(latitudes, longitudes, 'cornflowerblue', edge_width=10)
gmap.scatter(more_lats, more_lngs, '#3B0B39', size=40, marker=False)
gmap.scatter(marker_lats, marker_lngs, 'k', marker=True)
gmap.heatmap(heat_lats, heat_lngs)

gmap.draw("mymap.html")

It gave me the following error message.

NameError Traceback (most recent call last)
in ()
3 gmap = gmplot.GoogleMapPlotter(37.428, -122.145, 16)
4
----> 5 gmap.plot(latitudes, longitudes, 'cornflowerblue', edge_width=10)
6 gmap.scatter(more_lats, more_lngs, '#3B0B39', size=40, marker=False)
7 gmap.scatter(marker_lats, marker_lngs, 'k', marker=True)

NameError: name 'latitudes' is not defined

What is going on with my operation here?

Plotting from geocode consistently errors

Running the example code
gmplot.GoogleMapPlotter.from_geocode("San Francisco")
used to work exactly as described.

Now it consistently errors list index out of range
Swapping for lat/lon version works fine (gmplot.GoogleMapPlotter(37.766956, -122.438481, 13))

Full error


IndexError Traceback (most recent call last)
in ()
----> 1 a_map = gmplot.GoogleMapPlotter.from_geocode("San Francisco")

/Users/scottieb/anaconda/envs/GDAL/lib/python3.6/site-packages/gmplot/gmplot.py in from_geocode(cls, location_string, zoom)
32
33 @classmethod
---> 34 def from_geocode(cls, location_string, zoom=13):
35 lat, lng = cls.geocode(location_string)
36 return cls(lat, lng, zoom)

/Users/scottieb/anaconda/envs/GDAL/lib/python3.6/site-packages/gmplot/gmplot.py in geocode(self, location_string)
40 geocode = requests.get(
41 'http://maps.googleapis.com/maps/api/geocode/json?address="%s"' % location_string)
---> 42 geocode = json.loads(geocode.text)
43 latlng_dict = geocode['results'][0]['geometry']['location']
44 return latlng_dict['lat'], latlng_dict['lng']

IndexError: list index out of range

Add support for map.fitbounds

When it is difficult to calculate the correct zoom level to show an specific area of the map, google maps allow the use of Map.fitBounds. It basically needs only the NE and SW coordinates:
https://developers.google.com/maps/documentation/javascript/reference/3/map#Map.fitBounds

I have added the support for it in my fork, and I would like to do it in the main branch if approved. My only questions is. Should this be added as a separate function? something like def fit_bounds(self, nelat, nelng, swlat, swlng): or as a different way to initialize the map. That means providing NE and SW instead of center_lat, center_lng, zoom.

Better Text description

Hi, I'm actually trying gmplot for a study project. The idea is to plot on google map the evolution of mobile network in my city since 2014. To do so, I need to plot markers with a description but the option "title="smthg"" doesn't accept \n. Is their a way to do \n in markers description ?

loading error

Hi,

thanks for the nice module.

I am trying to reproduce the 'marker' example in your README, and I get this message, when I open the html

screen shot 2018-07-18 at 14 32 51

do we need a google maps api key?

I am on notebook 5.4.1 and safari 11.1.1

Thanks for your support

gmplot.py write_point problem.

        f.write('\t\tvar img = new google.maps.MarkerImage(\'%s\');\n' %
                (self.coloricon % color))

Causes an error when coloricon is a path containing backslashes.

Suggestion:

change init function:
from :
self.coloricon = os.path.join(os.path.dirname(file), 'markers/%s.png')
to:
self.coloricon = os.path.join(os.path.dirname(file), 'markers/%s.png').replace('\', '/')

Calling `from_geocode` occasionally produces "list index out of range" error

I've been using gmplot to draw running routes (via tcx files). Until recently I could loop through a file list and generate the new html plots.

But now the loop will seemingly-spontaneously fail and generate the following error:

 40             'http://maps.googleapis.com/maps/api/geocode/json?address="%s"' % location_string)
 41         geocode = json.loads(geocode.text)

---> 42 latlng_dict = geocode['results'][0]['geometry']['location']
43 return latlng_dict['lat'], latlng_dict['lng']
44

IndexError: list index out of range

I was able to isolate it to the call for
gmap = gmplot.GoogleMapPlotter.from_geocode("San Francisco")

For example, running the following code will result in throwing an error at some point (usually in the 8-14 range):

for i in range(25):
    print(i)
    gmap = gmplot.GoogleMapPlotter.from_geocode("San Francisco")

I can wrap it in a try/except but that merely delays the break.

My naive guess is that I'm breaking some API limit.

Markers lost on sharing the HTML doc

I shared the created plot with my colleagues. the map had Markers of different colors, labels on markers and heat-map. On sharing the file (same system configuration) they could only see the labels and heat-map. All the markers were lost. Kindly suggest a fix.

Marker path doesn't work on Windows

I have just installed a script that works fine on OSX onto a windows box with Python27.

When I run the script and create a HTML file it doesn't render any markers.

Looking at the Chrome console I see:
file:///C:/Python27libsite-packagesgmplotmarksers/FFA500.png
ERR_FILE_NOT_FOUND

It seems that the path separator is incorrect and not used.

Looking at the actual HTML file the path separators are all backslashes

Changing the HTML to use forward slash as separator seems to work,

Licence

What license is this package released under?

Incorrect relative import in most recent commit. Module import breaks.

Hi @vgm64 @OmriRoames, I think the latest commit may have a bug?

In [https://github.com/vgm64/gmplot/blob/master/gmplot/gmplot.py#L9]:
color_dicts should be .color_dicts.

This is the error message I get:


~/code/sonder/micro-neighborhoods/micro-neighborhoods-env/lib/python3.6/site-packages/gmplot/gmplot.py in <module>()
      7 from collections import namedtuple
      8 
----> 9 from color_dicts import mpl_color_map, html_color_codes
     10 from google_maps_templates import SYMBOLS, CIRCLE
     11 

ModuleNotFoundError: No module named 'color_dicts```

Color progression with time

Hi, thanks a lot fo this project, it's very useful. Btw this is more suggestion rather than an issue. So the idea is to create color progression with each coordinate to display the order at which some movement occured. It could be done for example by something like this:

#example of usage
gmap.scatter(latitudes, longitudes, '#3B0B39', size=40, marker=False, progressive=True)

#implementation in gmplot
`
def BuildColor(self, r, g, b):
newClr = "#"
for num in [r,g,b]:
newClr += (hex(num)[2:] if len(hex(num)[2:]) > 1 else "0" + hex(num)[2:])
return newClr

def scatter(self, lats, lngs, color=None, size=None, marker=True, c=None, s=None, progressive=False, **kwargs):
    color = color or c
    size = size or s or 40
    kwargs["color"] = color
    kwargs["size"] = size
    settings = self._process_kwargs(kwargs)
    print settings['color']
    counter = 0
    for lat, lng in zip(lats, lngs):
        if progressive == True:
            r = int(255.0 / float(len(lats)) * counter)
            g = int(255.0 - (255.0 / float(len(lats)) * counter))
            b = 0
            counter+=1
            settings['color'] = self.BuildColor(r,g,b)
            #print r, g, b
            #print settings['color']
        if marker:
            self.marker(lat, lng, settings['color'])
        else:
            self.circle(lat, lng, size, **settings)`

I edited the gmplot myself (I know it's not perfect :P especially that it's just "green -> red" and making the original color setting useless) but it would be cool if something like this was available in further updates.

How can I add google map API key ?

Hi,

I can use this wonderful package.
But I have a question.
When I browse the created html, I can check it but it is a developer mode.
There is a message 'This page can't load Google Maps correctly'.

Anyway I can browse it, but that page is a 'For development purpose only' page.

Can I add API key into the html ?

Error: 'google' is undefined.

Hi,
I use this wonderful package.
I' d like to ask about an error that "google is undefined.". This occurred at line 9 which contained in the generated HTML by this package.
When I get this error, Google map is not presented on browser.

I don't have google map's api key. So, is this error occurred by missing api key ?

However, I can use this package without this error on chrome and firefox with developer mode.
This error occurs on IE and Microsoft Edge.

What can I do to solve this problem ?

Thanks.

Marker=True in gmap.scatter don't work

I think that the problem is how is generated the path. I searched in the generated html and I found that the path was:
C:\Python27\lib\site-packages\gmplot\markers/FF0000.png
I tried to change it manually in:
file:///C:/Python27/Lib/site-packages/gmplot/markers/FF0000.png
And it seems to work. Some comments about that??

How change the map style?

Google Maps API allow us to change the style of the map adding a style json. Can I personalize the map style, adding this json as input parameter to the gmplot.GoogleMapPlotter function?

Example:
From this:
screenshot from 2018-08-08 18-24-31

To this:
screenshot from 2018-08-08 18-06-13

Draw cannot return raw html. Incorrect description.

Description of 'draw' says:

  • Create the html file which include one google map and all points and paths. If no string is provided, return the raw html.

This does not match the the actual code. Not providing a string results in a crash.

Colour coding Marks

Hi, thanks a lot for this project. It has been super useful so far!

I am having a little bit of an issue while colour coding marks in scatter plots. If I choose classical colours as 'red' or '#FF0000' it works fine, however if I select more exotic colours such as '#3B0B39' it doesn't plot anything.

gmap.scatter(lats, lons, '#FF0000', marker=True) -> works, yeyy :)
gmap.scatter(lats, lons, '#3B0B39', marker=True) -> doesn't work :(

Any idea of why I am having this problem?
#I am using python 3.6 on a mac

Strange vertical line appears in my map

Hi,

I hope somebody can help me. When I plot multiple data by using gmat.plot. The center of gmat is Ann Arbor. But the map generated has some strange straight line. No matter how to zoom in or zoom out, I can still not find the boundary of them. If somebody can answer my question, I will more than appreciate. Thank you!

image

image

Add optional WeightedLocation

Google maps API accepted WeightedLocation as an alternative to Location when plotting heatmaps. gmplot is unable to accept weights in the heatmap function. As a result, gmplot cannot be used with numerically weighted locations.

marker is called by fullpath

when i use with Flask, markers doesn't works!

127.0.0.1 - - [12/Aug/2017 23:32:15] "GET /tmp/google_map_plot/venv/lib/python3.5/site-packages/gmplot/markers/6495ED.png HTTP/1.1" 404 -

Pin Dropping

Is it possible to drop pins by using this library? If yes, how is it possible?

Sample Code won't work

After executing exactly what your mini-tutorial/sample code does, I get the error NameError: global name 'centerLat' is not defined but there's no such variable in the code. How is this fixed?

.scatter method does not take lists as input for "s" or "size" parameter

Hello, thank you for this amazing library. Very much like the matplotlib interface. I was wondering if there is a way that the .scatter method accepts a list/tuple as input for the "size" parameter. In matplotlib scatter plots the "s" parameter accepts lists, so that the bubble size can be adjusted for each datapoint. This would also be a great feature for gmplot. Regards, Johannes

Recommend Projects

  • React photo React

    A declarative, efficient, and flexible JavaScript library for building user interfaces.

  • Vue.js photo Vue.js

    ๐Ÿ–– Vue.js is a progressive, incrementally-adoptable JavaScript framework for building UI on the web.

  • Typescript photo Typescript

    TypeScript is a superset of JavaScript that compiles to clean JavaScript output.

  • TensorFlow photo TensorFlow

    An Open Source Machine Learning Framework for Everyone

  • Django photo Django

    The Web framework for perfectionists with deadlines.

  • D3 photo D3

    Bring data to life with SVG, Canvas and HTML. ๐Ÿ“Š๐Ÿ“ˆ๐ŸŽ‰

Recommend Topics

  • javascript

    JavaScript (JS) is a lightweight interpreted programming language with first-class functions.

  • web

    Some thing interesting about web. New door for the world.

  • server

    A server is a program made to process requests and deliver data to clients.

  • Machine learning

    Machine learning is a way of modeling and interpreting data that allows a piece of software to respond intelligently.

  • Game

    Some thing interesting about game, make everyone happy.

Recommend Org

  • Facebook photo Facebook

    We are working to build community through open source technology. NB: members must have two-factor auth.

  • Microsoft photo Microsoft

    Open source projects and samples from Microsoft.

  • Google photo Google

    Google โค๏ธ Open Source for everyone.

  • D3 photo D3

    Data-Driven Documents codes.