Coder Social home page Coder Social logo

gmplot PyVersions_

A matplotlib-like interface to render all the data you'd like on top of Google Maps.

Several plotting methods make creating exploratory map views effortless.

To install: pip install gmplot

Documentation (with examples): API Reference

Crash course

import gmplot

# Create the map plotter:
apikey = '' # (your API key here)
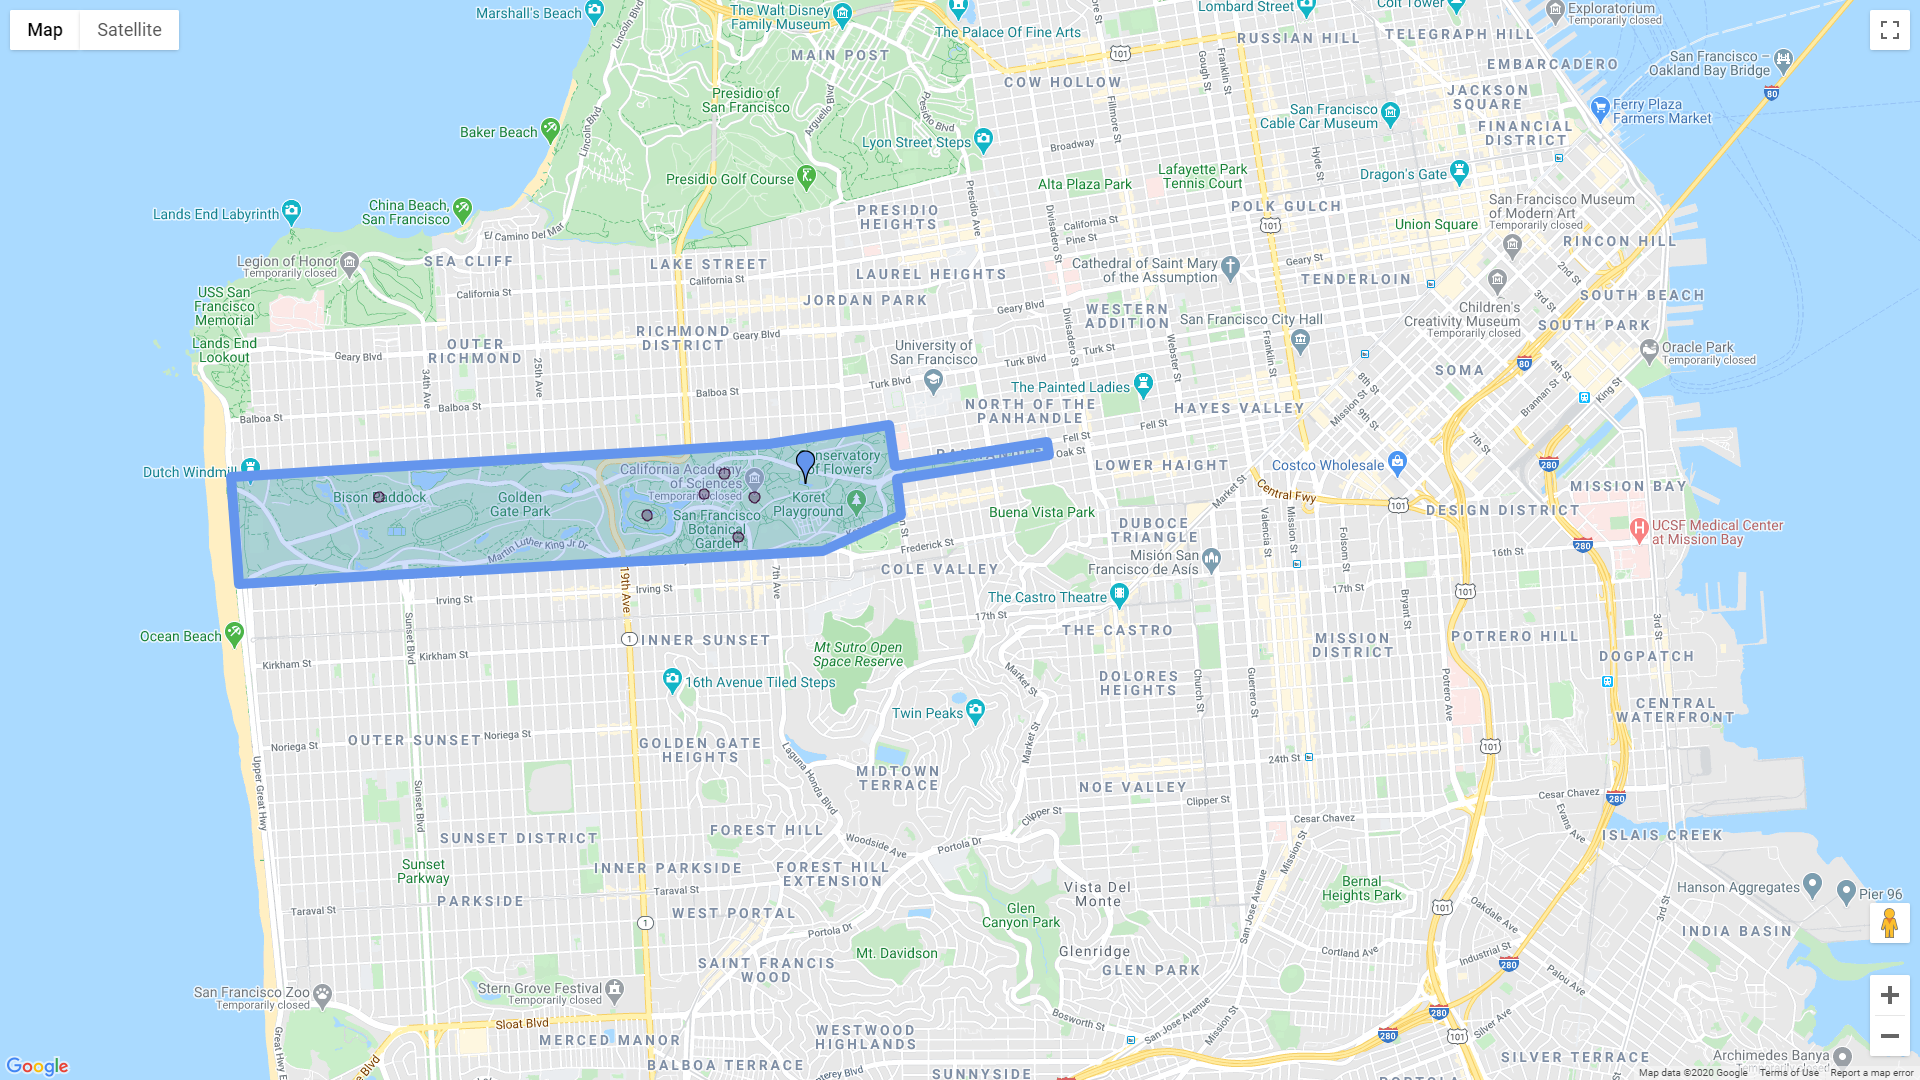
gmap = gmplot.GoogleMapPlotter(37.766956, -122.448481, 14, apikey=apikey)

# Mark a hidden gem:
gmap.marker(37.770776, -122.461689, color='cornflowerblue')

# Highlight some attractions:
attractions_lats, attractions_lngs = zip(*[
    (37.769901, -122.498331),
    (37.768645, -122.475328),
    (37.771478, -122.468677),
    (37.769867, -122.466102),
    (37.767187, -122.467496),
    (37.770104, -122.470436)
])
gmap.scatter(attractions_lats, attractions_lngs, color='#3B0B39', size=40, marker=False)

# Outline the Golden Gate Park:
golden_gate_park = zip(*[
    (37.771269, -122.511015),
    (37.773495, -122.464830),
    (37.774797, -122.454538),
    (37.771988, -122.454018),
    (37.773646, -122.440979),
    (37.772742, -122.440797),
    (37.771096, -122.453889),
    (37.768669, -122.453518),
    (37.766227, -122.460213),
    (37.764028, -122.510347)
])
gmap.polygon(*golden_gate_park, color='cornflowerblue', edge_width=10)

# Draw the map to an HTML file:
gmap.draw('map.html')

image


Inspired by Yifei Jiang's ([email protected]) pygmaps module.

gmplot's Projects

gmplot icon gmplot

Plot data on Google Maps, the easy way.

Recommend Projects

  • React photo React

    A declarative, efficient, and flexible JavaScript library for building user interfaces.

  • Vue.js photo Vue.js

    🖖 Vue.js is a progressive, incrementally-adoptable JavaScript framework for building UI on the web.

  • Typescript photo Typescript

    TypeScript is a superset of JavaScript that compiles to clean JavaScript output.

  • TensorFlow photo TensorFlow

    An Open Source Machine Learning Framework for Everyone

  • Django photo Django

    The Web framework for perfectionists with deadlines.

  • D3 photo D3

    Bring data to life with SVG, Canvas and HTML. 📊📈🎉

Recommend Topics

  • javascript

    JavaScript (JS) is a lightweight interpreted programming language with first-class functions.

  • web

    Some thing interesting about web. New door for the world.

  • server

    A server is a program made to process requests and deliver data to clients.

  • Machine learning

    Machine learning is a way of modeling and interpreting data that allows a piece of software to respond intelligently.

  • Game

    Some thing interesting about game, make everyone happy.

Recommend Org

  • Facebook photo Facebook

    We are working to build community through open source technology. NB: members must have two-factor auth.

  • Microsoft photo Microsoft

    Open source projects and samples from Microsoft.

  • Google photo Google

    Google ❤️ Open Source for everyone.

  • D3 photo D3

    Data-Driven Documents codes.