entronad / graphic Goto Github PK
View Code? Open in Web Editor NEWA grammar of data visualization and Flutter charting library.
License: Other
A grammar of data visualization and Flutter charting library.
License: Other


Hello using TimeScale class with formatter result in this error:
Dart Unhandled Exception: type '(DateTime) => String' is not a subtype of type '(dynamic) => String', stack trace: #0 TickInfoOp.evaluate.
package:graphic/…/axis/axis.dart:211
Example code:
final data = [
{"Date": DateTime(2021, 4, 1), "ET": 6,},
{"Date": DateTime(2021, 5, 3), "ET": 5},
{"Date": DateTime(2021, 5, 5), "ET": 8},
{"Date": DateTime(2021, 5, 7), "ET": 10},
{"Date": DateTime(2021, 5, 20), "ET": 11},
{"Date": DateTime(2021, 5, 29), "ET": 9}
];
Chart(
data: data,
variables: {
'Date': Variable(
accessor: (Map map) =>
(map['Date'] ?? double.nan) as DateTime,
scale: TimeScale(
tickCount: 3,
formatter: (x) {
return '${x.day}';
}
)
),
'ET': Variable(
accessor: (Map map) =>
(map['ET'] ?? double.nan) as num,
),
},
)
three items have "0" index but shows 2
const adjustData = [
{"type": "Email", "index": 0, "value": 120},
{"type": "Email", "index": 1, "value": 132},
{"type": "Affiliate", "index": 0, "value": 220},
{"type": "Affiliate", "index": 1, "value": 182},
{"type": "Video", "index": 5, "value": 330},
{"type": "Video", "index": 6, "value": 410},
{"type": "Direct", "index": 5, "value": 330},
{"type": "Direct", "index": 6, "value": 320},
{"type": "Search", "index": 0, "value": 320},
{"type": "Search", "index": 1, "value": 432},
];

Chart(
                      data: lineData,
                      variables: {
                        'Date': Variable(
                          accessor: (Map map) => map['Date'] as String,
                          scale: OrdinalScale(tickCount: 5),
                        ),
                        'Close': Variable(
                          accessor: (Map map) =>
                          (map['Close'] ?? double.nan) as num,
                        ),
                      },
                      elements: [
                        AreaElement(
                          shape: ShapeAttr(value: BasicAreaShape(smooth: true)),
                          color: ColorAttr(
                              value: Defaults.colors10.first.withAlpha(80)),
                        ),
                        LineElement(
                          shape: ShapeAttr(value: BasicLineShape(smooth: true)),
                          size: SizeAttr(value: 0.5),
                        ),
                      ],
                      axes: [
                        Defaults.horizontalAxis,
                        Defaults.verticalAxis,
                      ],
                      selections: {
                        'touchMove': PointSelection(
                          on: {
                            GestureType.scaleUpdate,
                            GestureType.tapDown,
                            GestureType.longPressMoveUpdate
                          },
                          dim: Dim.x,
                        )
                      },
                      tooltip: TooltipGuide(
                        followPointer: [false, true],
                        align: Alignment.topLeft,
                        offset: const Offset(-20, -20),
                      ),
                      crosshair: CrosshairGuide(followPointer: [false, true]),
                    )
下面是数据源
final lineData = <Map<String, dynamic>>[];// {"Date": "04.01.2016", "Close": 126.12};
configLineData() {
  final now = DateTime.now();
  final random = Random();
  for (int i = 0; i<40000; i++) {
    final time = now.subtract(Duration(minutes: i));
    final timeStr = "${time.year}-${time.month.toString().padLeft(2,'0')}-${time.day.toString().padLeft(2,'0')} ${time.hour.toString().padLeft(2,'0')}:${time.minute.toString().padLeft(2,'0')}:00";
    lineData.add({"Date": timeStr, "Close": random.nextDouble() * 20 + 70});
  }
}默认开始都是从最左边开始,需要滑到最右边,才能看到今天的数据
First of all, thanks a lot for this fantastic library !
I am currently evaluating Graphic to see it it would be a good fit / foundation to power graphing stock charts.

Looking at a very simple graph from tradingview, after looking at the example and experimenting a bit, I am wondering if the following is currently possible:
1. Alignment of the vertical axis
Pretty much all stock charts display the Vertical Axis on the right side instead of the left side. It does not seem to be supported at the moment.
2. Graph elements with different kind on the Y axis
For example, the volume bars in this graph, I am not sure how to proceed and if this is supported at all for now.
3. Stacked elements sharing the same X axis
I have the feeling this is is definitely not implemented at the moment but I could be wrong again.
Thanks a lot in advance for your guidance.

我这边会出现这种情况
Expected a value of type '(dynamic) => dynamic', but got one of type '(Map<dynamic, dynamic>) => String'
json数据没有问题

大概是这样
[{
time: 2021 - 11 - 29 15: 00,
name: 空气温度(℃),
value: 20.1
}, {
time: 2021 - 11 - 29 15: 20,
name: 空气温度(℃),
value: 20.1
}]
不知道是有所有图表通过图形语法在现有版本的基础上都可以绘制出来
Vesion 0.9.1
Chart Code:
Chart(
  data: data,
  variables: {
    "type": Variable(
      accessor: (Map map) => map['type'] as String,
    ),
    "label": Variable(
      accessor: (Map map) => map['label'] as String,
    ),
    "data": Variable(
      accessor: (Map map) => map['data'] as num,
    ),
  },
  elements: [
    IntervalElement(
      position: Varset("label") * Varset('data') / Varset('type'),
      elevation: ElevationAttr(value: 0, updaters: {
        'tap': {true: (_) => 5}
      }),
      color: ColorAttr(
          variable: "type",
          values: chartInfo.getColors(),
          updaters: {
            'tap': {false: (color) => color.withAlpha(100)}
          }),
      modifiers: [DodgeModifier(ratio: 0.2, symmetric: true)],
    )
  ],
  axes: [
    Defaults.horizontalAxis,
    Defaults.verticalAxis,
  ],
  selections: {
    'tap': PointSelection(
      variable: 'label',
    )
  },
  tooltip: TooltipGuide(multiTuples: true),
  crosshair: CrosshairGuide(),
)
data:
[{"type":"title1","label":"label1","data":10.0},{"type":"title1","label":"label2","data":20.0},{"type":"title1","label":"label3","data":30.0},{"type":"title1","label":"label4","data":40.0},{"type":"title2","label":"label1","data":36.0},{"type":"title2","label":"label2","data":14.0},{"type":"title2","label":"label3","data":88.0},{"type":"title2","label":"label4","data":31.0},{"type":"title3","label":"label1","data":83.0},{"type":"title3","label":"label2","data":4.0},{"type":"title3","label":"label3","data":56.0},{"type":"title3","label":"label4","data":46.0}]
result:

expect:

how to config multiple IntervalElement center justify with label?
当所有的数值为0的时候,图表不能正常显示
Hi, @entronad I am getting this error while running the app after installing the graphic package can you please help me with this.
/E:/software/flutter/.pub-cache/hosted/pub.dartlang.org/graphic-0.4.1/lib/src/in
teraction/selection/selection.dart:182:36: Error: The getter 'delta' isn't
defined for the class 'ScaleUpdateDetails'.
 - 'ScaleUpdateDetails' is from 'package:flutter/src/gestures/scale.dart'
 ('/E:/software/flutter/packages/flutter/lib/src/gestures/scale.dart').
Try correcting the name to the name of an existing getter, or defining a getter
or field named 'delta'.
              final delta = detail.delta - gesture.preScaleDetail!.delta;
                                   ^^^^^
/E:/software/flutter/.pub-cache/hosted/pub.dartlang.org/graphic-0.4.1/lib/src/in
teraction/selection/selection.dart:182:68: Error: The getter 'delta' isn't
defined for the class 'ScaleUpdateDetails'.
 - 'ScaleUpdateDetails' is from 'package:flutter/src/gestures/scale.dart'
 ('/E:/software/flutter/packages/flutter/lib/src/gestures/scale.dart').
Try correcting the name to the name of an existing getter, or defining a getter
or field named 'delta'.
              final delta = detail.delta - gesture.preScaleDetail!.delta;
                                                                   ^^^^^
/E:/software/flutter/.pub-cache/hosted/pub.dartlang.org/graphic-0.4.1/lib/src/ch
art/chart.dart:255:11: Error: No named parameter with the name
'onLongPressCancel'.
          onLongPressCancel: () {
          ^^^^^^^^^^^^^^^^^
/E:/software/flutter/packages/flutter/lib/src/widgets/gesture_detector.dart:216:
3: Context: Found this candidate, but the arguments don't match.
  GestureDetector({
  ^^^^^^^^^^^^^^^
/E:/software/flutter/.pub-cache/hosted/pub.dartlang.org/graphic-0.4.1/lib/src/co
mmon/defaults.dart:162:28: Error: The getter 'delta' isn't defined for the class
'ScaleUpdateDetails'.
 - 'ScaleUpdateDetails' is from 'package:flutter/src/gestures/scale.dart'
 ('/E:/software/flutter/packages/flutter/lib/src/gestures/scale.dart').
Try correcting the name to the name of an existing getter, or defining a getter
or field named 'delta'.
        (detail) => detail.delta.dx,
                           ^^^^^
/E:/software/flutter/.pub-cache/hosted/pub.dartlang.org/graphic-0.4.1/lib/src/co
mmon/defaults.dart:169:29: Error: The getter 'delta' isn't defined for the class
'ScaleUpdateDetails'.
 - 'ScaleUpdateDetails' is from 'package:flutter/src/gestures/scale.dart'
 ('/E:/software/flutter/packages/flutter/lib/src/gestures/scale.dart').
Try correcting the name to the name of an existing getter, or defining a getter
or field named 'delta'.
        (detail) => -detail.delta.dy,
════════ Exception caught by gesture library ═══════════════════════════════════
The following _CastError was thrown while dispatching a pointer event:
Null check operator used on a null value
When the exception was thrown, this was the stack
#0 _ChartState.build.
package:graphic/…/chart/chart.dart:633
#1 RenderPointerListener.handleEvent
package:flutter/…/rendering/proxy_box.dart:2888
#2 GestureBinding.dispatchEvent
package:flutter/…/gestures/binding.dart:420
#3 RendererBinding.dispatchEvent
package:flutter/…/rendering/binding.dart:278
#4 GestureBinding._handlePointerEventImmediately
package:flutter/…/gestures/binding.dart:374
#5 GestureBinding.handlePointerEvent
package:flutter/…/gestures/binding.dart:338
#6 GestureBinding._flushPointerEventQueue
package:flutter/…/gestures/binding.dart:296
#7 GestureBinding._handlePointerDataPacket
package:flutter/…/gestures/binding.dart:279
#11 _invoke1 (dart:ui/hooks.dart:185:10)
#12 PlatformDispatcher._dispatchPointerDataPacket (dart
on line 666 should to recreate view
bool shouldRelayout(covariant SingleChildLayoutDelegate oldDelegate) => state.view == null;
I'm using the Race Chart and Pie Chart from the example project.
Adding a circular border radius results in the borders twisting outwards:

A seemingly good workaround is to have a negative size for the IntervalElement (similar to what I had here #56):

Although this introduces some problems.
For example, when any input is zero, the border twists backwards:

This can be corrected by checking the input data and replacing each 0 value to a non-zero value, for example 1. One of the reasons I do not like this solution is because the data must be manipulated.
Also, it still does not look too appealing to me. The "dots" representing empty values now have different lengths. For these two reasons it's not a good solution:

Another problem that might be related: setting the border radius to overly high values results in all lines becoming "sausages":

The above problems also apply to other types of charts


In the case of e-charts, I see two different behaviors. When the value is set to 0, the a gauge-chart draws a small round dot. A pie-charts simply do not draw the slice.

I want to draw sankey chart, any easy way implement it ?
https://echarts.apache.org/examples/zh/editor.html?c=sankey-simple&lang=ts
At making pub get the console show that:
Because every version of flutter_localizations from sdk depends on intl 0.17.0-nullsafety.2 and graphic 0.3.0 depends on intl ^0.16.1, flutter_localizations from sdk is incompatible with graphic 0.3.0.
So, if you try launch the app the error message appears again, and overriding init to intl: ^0.16.1 doesnt work
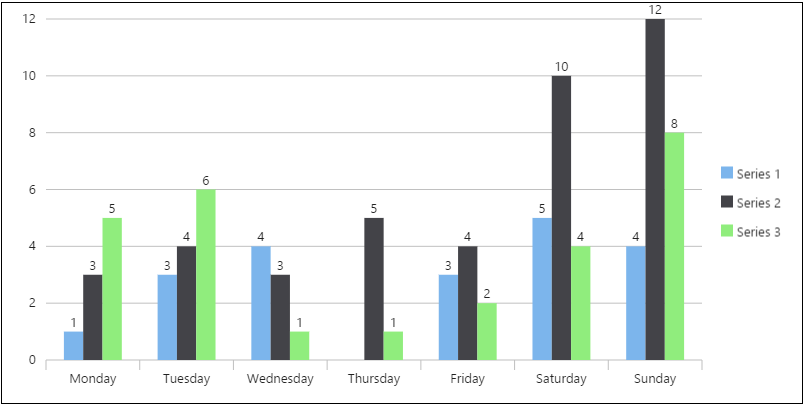
I´m trying to make a bar char with 2 series, i have all setup and working but i wanted to add one annotation to show the color of each serie at the bottomCenter of the chart, so i use a CustomAnnotation but when i save my changes i got the following error:
E/flutter ( 8790): [ERROR:flutter/shell/common/shell.cc(94)] Dart Unhandled Exception: type 'Null' is not a subtype of type 'Label' in type cast, stack trace: #0 TagAnnotOp.evaluate (package:graphic/src/guide/annotation/tag.dart:40:35)
E/flutter ( 8790): #1 Operator.run (package:graphic/src/dataflow/operator.dart:87:29)
E/flutter ( 8790): #2 Dataflow.evaluate (package:graphic/src/dataflow/dataflow.dart:95:27)
E/flutter ( 8790): #3 View.evaluate (package:graphic/src/chart/view.dart:69:17)
E/flutter ( 8790): #4 Dataflow.run (package:graphic/src/dataflow/dataflow.dart:123:16)
E/flutter ( 8790): #5 new View (package:graphic/src/chart/view.dart:25:5)
E/flutter ( 8790): #6 _ChartLayoutDelegate.getPositionForChild (package:graphic/src/chart/chart.dart:680:20)
E/flutter ( 8790): #7 RenderCustomSingleChildLayoutBox.performLayout (package:flutter/src/rendering/shifted_box.dart:1361:41)
E/flutter ( 8790): #8 RenderObject.layout (package:flutter/src/rendering/object.dart:1852:7)
E/flutter ( 8790): #9 RenderConstrainedBox.performLayout (package:flutter/src/rendering/proxy_box.dart:277:14)
E/flutter ( 8790): #10 RenderObject.layout (package:flutter/src/rendering/object.dart:1852:7)
E/flutter ( 8790): #11 _RenderLayoutBuilder.performLayout (package:flutter/src/widgets/layout_builder.dart:319:14)
E/flutter ( 8790): #12 RenderObject.layout (package:flutter/src/rendering/object.dart:1852:7)
E/flutter ( 8790): #13 ChildLayoutHelper.layoutChild (package:flutter/src/rendering/layout_helper.dart:56:11)
E/flutter ( 8790): #14 RenderFlex._computeSizes (package:flutter/src/rendering/flex.dart:896:45)
E/flutter ( 8790): #15 RenderFlex.performLayout (package:flutter/src/rendering/flex.dart:931:32)
E/flutter ( 8790): #16 RenderObject.layout (package:flutter/src/rendering/object.dart:1852:7)
E/flutter ( 8790): #17 RenderPadding.performLayout (package:flutter/src/rendering/shifted_box.dart:233:12)
E/flutter ( 8790): #18 RenderObject.layout (package:flutter/src/rendering/object.dart:1852:7)
E/flutter ( 8790): #19 MultiChildLayoutDelegate.layoutChild (package:flutter/src/rendering/custom_layout.dart:171:12)
E/flutter ( 8790): #20 _ScaffoldLayout.performLayout (package:flutter/src/material/scaffold.dart:1005:7)
E/flutter ( 8790): #21 MultiChildLayoutDelegate._callPerformLayout (package:flutter/src/rendering/custom_layout.dart:240:7)
E/flutter ( 8790): #22 RenderCustomMultiChildLayoutBox.performLayout (package:flutter/src/rendering/custom_layout.dart:403:14)
E/flutter ( 8790): #23 RenderObject.layout (package:flutter/src/rendering/object.dart:1852:7)
E/flutter ( 8790): #24 RenderProxyBoxMixin.performLayout (package:flutter/src/rendering/proxy_box.dart:116:14)
E/flutter ( 8790): #25 RenderObject.layout (package:flutter/src/rendering/object.dart:1852:7)
E/flutter ( 8790): #26 RenderProxyBoxMixin.performLayout (package:flutter/src/rendering/proxy_box.dart:116:14)
E/flutter ( 8790): #27 _RenderCustomClip.performLayout (package:flutter/src/rendering/proxy_box.dart:1376:11)
E/flutter ( 8790): #28 RenderObject.layout (package:flutter/src/rendering/object.dart:1852:7)
E/flutter ( 8790): #29 RenderProxyBoxMixin.performLayout (package:flutter/src/rendering/proxy_box.dart:116:14)
E/flutter ( 8790): #30 RenderObject.layout (package:flutter/src/rendering/object.dart:1852:7)
E/flutter ( 8790): #31 RenderProxyBoxMixin.performLayout (package:flutter/src/rendering/proxy_box.dart:116:14)
E/flutter ( 8790): #32 RenderObject.layout (package:flutter/src/rendering/object.dart:1852:7)
E/flutter ( 8790): #33 RenderProxyBoxMixin.performLayout (package:flutter/src/rendering/proxy_box.dart:116:14)
E/flutter ( 8790): #34 RenderObject.layout (package:flutter/src/rendering/object.dart:1852:7)
Reloaded 2 of 1223 libraries in 1,410ms.
E/flutter ( 8790): #35 RenderProxyBoxMixin.performLayout (package:flutter/src/rendering/proxy_box.dart:116:14)
E/flutter ( 8790): #36 RenderObject.layout (package:flutter/src/rendering/object.dart:1852:7)
E/flutter ( 8790): #37 RenderProxyBoxMixin.performLayout (package:flutter/src/rendering/proxy_box.dart:116:14)
E/flutter ( 8790): #38 RenderObject.layout (package:flutter/src/rendering/object.dart:1852:7)
E/flutter ( 8790): #39 RenderProxyBoxMixin.performLayout (package:flutter/src/rendering/proxy_box.dart:116:14)
E/flutter ( 8790): #40 RenderObject.layout (package:flutter/src/rendering/object.dart:1852:7)
E/flutter ( 8790): #41 RenderProxyBoxMixin.performLayout (package:flutter/src/rendering/proxy_box.dart:116:14)
E/flutter ( 8790): #42 RenderObject.layout (package:flutter/src/rendering/object.dart:1852:7)
E/flutter ( 8790): #43 RenderProxyBoxMixin.performLayout (package:flutter/src/rendering/proxy_box.dart:116:14)
E/flutter ( 8790): #44 RenderObject.layout (package:flutter/src/rendering/object.dart:1852:7)
This is my CustomAnnotation declaration:
CustomAnnotation(
    renderer: (position) => chart_utils.buildSeriesAnnotation(position, labels),
    anchor: (size) => Offset(((size.width - 60) / 2) + 60, size.height)
)
And my renderer:
List<Figure> buildSeriesAnnotation(Offset position, Map<String, Color> series) {
  List<Figure> resut = [];
  final colors = series.values.toList(growable: false);
  final labels = series.entries.map((e) => _buildText(e.key, e.value, true)).toList(growable: false);
  for (var l in labels) {
    l.layout();
  }
  final width = (quiver.max( labels.map((e) => e.width) ) ?? 0) + (15 * labels.length);
  final height = math.max( 20, quiver.max( labels.map((e) => e.height) ) ?? 0 );
  var leftTop = Offset(position.dx - (width / 2), position.dy - height);

  for (int i = 0; i < labels.length; i++) {
    var labelPainter = labels[i];
    var colorRect = Rect.fromLTWH(leftTop.dx, leftTop.dy, 20, 20);
    var labelPaintPoint = leftTop + Offset(25, labelPainter.height / 2);
    var colorPath = Path()..addRRect( RRect.fromRectAndRadius(colorRect, Radius.zero) );
    resut.addAll([
      PathFigure(colorPath, Paint()..color = colors[i]),
      TextFigure(labelPainter, labelPaintPoint)
    ]);
    leftTop += Offset(labelPainter.width + 35, 0);
  }
  return resut;
}Taking this code:
List<int> getCandidates(int length) {
  final List<int> totalCandidatesList = <int>[];
  for (int i = 0; i < length; ++i) {
    totalCandidatesList.add(Random().nextInt(1000));
  }
  return totalCandidatesList;
}

List<Map<String, dynamic>> get distributionData {
  final List<int> tcd = getCandidates(21);

  final List<Map<String, dynamic>> chartData = <Map<String, dynamic>>[];
  for (int i = 0; i < tcd.length; ++i) {
    chartData.add({
      'index': i,
      'label': '$i',
      'value': 1,
    });
  }
  return chartData;
}Chart(
data: distributionData,
variables: {
'label': Variable(
accessor: (Map map) => map['label'] as String,
),
'value': Variable(
accessor: (Map map) => map['value'] as num,
),
'index': Variable(
accessor: (Map map) => map['index'] as num,
),
},
elements: [
IntervalElement(),
],
axes: [
Defaults.horizontalAxis,
Defaults.verticalAxis,
],
selections: {'tap': PointSelection(dim: 1)},
tooltip: TooltipGuide(
backgroundColor: Palette.black,
textStyle: TextStyles.caption.copyWith(color: Palette.white),
variables: ['label', 'value'],
),
crosshair: CrosshairGuide(),
)Since all the values are == 1 (they just have to be the same values), the bars and the values on the Y axis won't show.
Hello , first thank you for this awesome library.
I was checking the example app and as for my use case I need pan and zooming feature in my app. And by digging some documentation and some internal code I found this two getters horizontalRangeSignal and verticalRangeSignal which's documentation says A signal update for scaling and panning for respective coordinates.
So I think which can be used in zooming so I tried putting them in RectCoord() in coord property but nothing happens so am doing anything wrong here.
I am putting this in Timeline chart of example app just like this,
Container(
                margin: const EdgeInsets.only(top: 10),
                width: 350,
                height: 300,
                child: Chart(
                  data: timeSeriesSales,
                  variables: {
                    'time': Variable(
                      accessor: (TimeSeriesSales datum) => datum.time,
                      scale: TimeScale(
                        formatter: (time) => _monthDayFormat.format(time),
                      ),
                    ),
                    'sales': Variable(
                      accessor: (TimeSeriesSales datum) => datum.sales,
                    ),
                  },
                  elements: [
                    LineElement(
                        shape: ShapeAttr(value: BasicLineShape(dash: [5, 2])))
                  ],
                  axes: [
                    Defaults.horizontalAxis,
                    Defaults.verticalAxis,
                  ],
                  selections: {
                    'touchMove': PointSelection(
                      on: {
                        GestureType.scaleStart,
                        GestureType.scaleUpdate
                      },
                      dim: Dim.x,
                    )
                  },
                  coord: RectCoord(
                    onHorizontalRangeSignal: Defaults.horizontalRangeSignal,  // <--------------- here
                    onVerticalRangeSignal: Defaults.verticalRangeSignal,
                  ),
                  tooltip: TooltipGuide(
                    followPointer: [false, true],
                    align: Alignment.topLeft,
                    offset: const Offset(-20, -20),
                  ),
                  crosshair: CrosshairGuide(followPointer: [false, true]),
                ),
              ),
So now the title does it support zooming?

Hi, Thanks for your great project. Could you support null safety in the future?
I am showing multiple charts using column. When user clicks/taps on a chart window. I need to perform some specific task. I tried with gesture detector as chart parent widget. But gesture detector is not detecting any gesture.
Can you please help me solve this?
hi, thanks for this great library. how to get index? because i want to show alert dialog when user click pointElement
I would like to have a multi-line chart where points with data would be marked with dots or whatnot.
On hover over a point it would show label and data of the line and distinguish it (for example make the colour of the line line brighter or set to specific colour or make other lines more transparent).
Having a legend would also be nice though not as priority.
I am experimenting with placing the Y axis on the right and flipping the labels as mentioned in #38
AxisGuide(
    position: 1,
    flip: true,
    label: LabelStyle(
      Defaults.textStyle,
      offset: Offset(0, 0),
    ),
    grid: Defaults.strokeStyle,
  )

It seems the graph boundaries are not computed properly to allow room for the labels in that scenario.
When I update the data used by the chart (I use mobx to update the data), it just disappears. Shouldn't the data be updatable in real-time?
from the library, it says:
  /// A list of values from 0.0 to 1.0 that denote fractions along the gradient.
  ///
  /// If non-null, this list must have the same length as [colors].
  ///
  /// If the first value is not 0.0, then a stop with position 0.0 and a color
  /// equal to the first color in [colors] is implied.
  ///
  /// If the last value is not 1.0, then a stop with position 1.0 and a color
  /// equal to the last color in [colors] is implied.
  ///
  /// The values in the [stops] list must be in ascending order. If a value in
  /// the [stops] list is less than an earlier value in the list, then its value
  /// is assumed to equal the previous value.
  ///
  /// If stops is null, then a set of uniformly distributed stops is implied,
  /// with the first stop at 0.0 and the last stop at 1.0.
so, stops:[0,1] (default) is just like normal gradient, right?
the problem is, when the data has fewer spike, the gradient is wrong


any solution?
I see several errors in my logs when I try to run the graphic plugin. Indeed, they refer to the file selection.dart and defaults.dart. These files use the getter 'delta', but it doesn't exist in scale.dart (snap/flutter/common/flutter/packages/flutter/lib/src/gestures/scale.dart).
I correct this problem by replacing all getter 'delta' with getter 'focalPointDelta' .
my environnment =
sdk: '>=2.12.0 <3.0.0'
flutter: ">=2.0.0-3.0"
Hello, I have a small problem, the first value is 9.90 and the second value is 7.5, the second one has the right scale, but the first one doesn't, it ends up being 00001. The right one would be 10.

please add candle
Loading data asynchronously is useful when there is huge dataset and we simply cant load it all. Right now it seems like Graphic is not providing the signal that would permit the app to detect that we are touching the boundary of the loaded data and that we actually need to fetch more.
When the "range" (not sure about the right terminology) is changing (basically moving along the X axis), it would be useful to emit a signal that the app can use to load more data if needed.
Is it possible to mimic the following configuration from e-charts?
itemStyle: {
  borderColor: '#fff',
  borderWidth: 2
},
This adds a gap between the slices of the pie.
Example:
https://echarts.apache.org/examples/en/editor.html?c=pie-borderRadius

Another use of the same feature:
itemStyle: {
  borderColor: '#000',
  borderWidth: 1
},

A similar effect to the second example can be achieved by layering two IntervalElements on top of each other, the bottom one being slightly bigger and painted to black. But this is a workaround and it kinda looks messy, the borders are not exactly even on all sides. I did something like that in my example here: #56
You can see the "borders" thinning around the end:

please add series color like this
use radius rect
change map['genre'] value or map['sold']
The interface overlaps and cannot be refreshed
Unhandled Exception: type 'ChangeDataSignal' is not a subtype of type 'GestureSignal' in type cast
I have a project were I need to render multiple charts of incoming sensor data. The charts should be updated at least every 30ms and show up to 1000 data points at a time, as a line chart. Is this library suited for this use-case and capable of this performance?
Thanks for any tips.
Can you provide interactive click effects in Smooth Line And Area And more charts? If you can, it may make your plug-in more perfect? (能否在 Smooth Line And Area 及更多的chart提供点击交互的效果,如果您能实现,可能会让您的插件更加完美)
How to add title to the tooltip and colorful dots for recognizing values something like legend in tooltip. And add own title for values in tooltip.
I got error in library: Assertion failed:
values == null || values.length >= 2 is not true
graphic-0.8.0/lib/src/aes/channel.dart:24:16
For a rectangle interval chart, what is the idiomatic way to have different colors for bars?
For example, I have 5 bars and one should have a different color from the others, how to achieve that?
In the class BasicLineShape, I hope there is a setting of "bool dashed" to decide whether to draw a dashed line.
thanks
When the graph permits it and you can pan the graph, you can actually pan way out of it, ideally it should be bounded by its data.

Hi!
I'd like to re-create the rings of this Echarts example in Graphic.

This is what I've got so far:

I figured out how to add the "border color" effect with a secondary IntervalElement, but I can't figure out how to limit the background color to be drawn only behind the lines. I'd like the center to remain white.
Here's my code:
Chart(
  data: basicData,
  variables: {
    'genre': Variable(
      accessor: (Map map) => map['genre'] as String,
    ),
    'sold': Variable(
      accessor: (Map map) => map['sold'] as num,
      scale: LinearScale(min: 0),
    ),
  },
  elements: [
    IntervalElement(
      color: ColorAttr(variable: 'genre', values: [Color(0xff464646), Color(0xff464646), Color(0xff464646)]),
      shape: ShapeAttr(
        value: RectShape(borderRadius: const BorderRadius.all(Radius.circular(10))),
      ),
      size: SizeAttr(value: -16.5),
    ),
    IntervalElement(
      color: ColorAttr(variable: 'genre', values: eChartColors),
      shape: ShapeAttr(
        value: RectShape(borderRadius: const BorderRadius.all(Radius.circular(11.5))),
      ),
      size: SizeAttr(value: -15),
    ),
  ],
  coord: PolarCoord(
    transposed: true,
    startRadius: 0.7,
    endRadius: 1,
    color: Color(0xffE6EBF8),
  ),
  selections: {'tap': PointSelection()},
  tooltip: TooltipGuide(renderer: centralPieLabel),
)

const eChartColors = [
  Color(0xfffac858),
  Color(0xff91cc75),
  Color(0xff5470c6),
];
I have tried changing the Grid/Tick color that runs horizontally on the vertical axis. I have tried setting theme properties and it isn't responding. I'm I doing something wrong? Just to be able to see a change, I have tried things like:
theme: graphic.Theme(
                    verticalAxis: graphic.Axis(
                      tickLine: graphic.AxisTickLine(
                        style: graphic.LineStyle(
                          color: Colors.blue,
                          strokeWidth: 20
                        ),
                      ),
                      grid: graphic.AxisGrid(
                        style: graphic.LineStyle(
                            color: Colors.red,
                            strokeWidth: 20
                        ),

                      ),
                      line: graphic.AxisLine(
                          style: graphic.LineStyle(
                              color: Colors.green,
                              strokeWidth: 20
                          )
                      )
                    ),
                    horizontalAxis: graphic.Axis(
                        tickLine: graphic.AxisTickLine(
                            style: graphic.LineStyle(
                                color: Colors.blue,
                                strokeWidth: 20
                            ),
                        ),
                        grid: graphic.AxisGrid(
                            style: graphic.LineStyle(
                                color: Colors.red,
                                strokeWidth: 20
                            )
                        ),
                        line: graphic.AxisLine(
                            style: graphic.LineStyle(
                                color: Colors.green,
                                strokeWidth: 20
                            )
                        )
                    ),

                  ),
Would appreciate any pointers.
this lib good for big data?
10k items
Charts do not support tooltip when touching points. Predictions for this feature?
Hello guys,
When i add more than 12 elements to a line_area graphic, the grid lines are not being displayed.
Only 8 are being shown, and the other ones are blank.
i'll attach a simple code, so you can replicate the error:
import 'package:flutter/gestures.dart';
import 'package:flutter/material.dart';
import 'package:graphic/graphic.dart';
import 'package:intl/intl.dart';

import '../data.dart';

final _monthDayFormat = DateFormat('MM-dd');

class LineAreaPage extends StatelessWidget {
  LineAreaPage({Key? key}) : super(key: key);

  final GlobalKey<ScaffoldState> _scaffoldKey = GlobalKey<ScaffoldState>();

  @override
  Widget build(BuildContext context) {
    return Scaffold(
      key: _scaffoldKey,
      appBar: AppBar(
        title: const Text('Line and Area Element'),
      ),
      backgroundColor: Colors.white,
      body: SingleChildScrollView(
        child: Center(
          child: Column(
            children: <Widget>[
              Container(
                child: const Text(
                  'Spider Net Chart',
                  style: TextStyle(fontSize: 20),
                ),
                padding: const EdgeInsets.fromLTRB(20, 40, 20, 5),
              ),
              Container(
                child: const Text(
                  '- A loop connects the first and last point.',
                ),
                padding: const EdgeInsets.fromLTRB(10, 5, 10, 0),
                alignment: Alignment.centerLeft,
              ),
              Container(
                margin: const EdgeInsets.only(top: 10),
                width: 350,
                height: 300,
                child: Chart(
                  data: adjustData,
                  variables: {
                    'index': Variable(
                      accessor: (Map map) => map['index'].toString(),
                    ),
                    'type': Variable(
                      accessor: (Map map) => map['type'] as String,
                    ),
                    'value': Variable(
                      accessor: (Map map) => map['value'] as num,
                    ),
                  },
                  elements: [
                    LineElement(
                      position:
                          Varset('index') * Varset('value') / Varset('type'),
                      shape: ShapeAttr(value: BasicLineShape(loop: true)),
                      color: ColorAttr(
                          variable: 'type', values: Defaults.colors10),
                    )
                  ],
                  coord: PolarCoord(),
                  axes: [
                    Defaults.circularAxis,
                    Defaults.radialAxis,
                  ],
                  selections: {
                    'touchMove': PointSelection(
                      on: {
                        GestureType.scaleUpdate,
                        GestureType.tapDown,
                        GestureType.longPressMoveUpdate
                      },
                      dim: 1,
                      variable: 'index',
                    )
                  },
                  tooltip: TooltipGuide(
                    anchor: (_) => Offset.zero,
                    align: Alignment.bottomRight,
                    multiTuples: true,
                    variables: ['type', 'value'],
                  ),
                  crosshair: CrosshairGuide(followPointer: [false, true]),
                ),
              ),
            ],
          ),
        ),
      ),
    );
  }
}
For this example we are using static data:
const adjustData = [
  {"type": "Email", "index": 1, "value": 120},
  {"type": "Email", "index": 2, "value": 220},
  {"type": "Email", "index": 3, "value": 150},
  {"type": "Email", "index": 4, "value": 320},
  {"type": "Email", "index": 5, "value": 320},
  {"type": "Email", "index": 6, "value": 420},
  {"type": "Email", "index": 7, "value": 520},
  {"type": "Email", "index": 8, "value": 620},
  {"type": "Email", "index": 9, "value": 720},
  {"type": "Email", "index": 10, "value": 820},
  {"type": "Email", "index": 11, "value": 120},
  {"type": "Email", "index": 12, "value": 220},
  {"type": "Email", "index": 13, "value": 320},
];

Thank you so much in advance,
Yosue
When I try to show a Chart without specifying dimensions for its parent, the mouse hover and possibly other gesture functions are not working. As soon as I specify the width and height for the the container which encapsulated the Chart, the gestures work. Here is an example code which you can use to recreate the bug.
If you run the exact code in a browser, you can see the crosshairs. But if you remove width: 600 and/or height: 400 from the code below, the hover stops working and I cannot see the crosshairs.
import 'package:flutter/gestures.dart';
import 'package:flutter/material.dart';
import 'package:graphic/graphic.dart';

void main() {
  runApp(const MyApp());
}

class MyApp extends StatelessWidget {
  const MyApp({Key? key}) : super(key: key);

  @override
  Widget build(BuildContext context) {
    return const MaterialApp(
      home: MyHomePage(),
    );
  }
}

class MyHomePage extends StatelessWidget {
  const MyHomePage({Key? key}) : super(key: key);

  @override
  Widget build(BuildContext context) {
    return Scaffold(
      body: Center(
        child: Container(
          // Commenting out the next two lines is causing the problem
          width: 600,
          height: 400,
          child: Chart(
            data: [
              {'year': DateTime(2010), 'price': 10},
              {'year': DateTime(2011), 'price': 8},
              {'year': DateTime(2012), 'price': 12},
              {'year': DateTime(2013), 'price': 16},
              {'year': DateTime(2014), 'price': 9},
              {'year': DateTime(2015), 'price': 17},
              {'year': DateTime(2016), 'price': 13},
            ],
            variables: {
              'year': Variable(
                accessor: (Map map) => map['year'] as DateTime,
              ),
              'price': Variable(
                accessor: (Map map) => map['price'] as int,
              ),
            },
            elements: [LineElement()],
            axes: [
              Defaults.horizontalAxis,
              Defaults.verticalAxis,
            ],
            selections: {
              'tooltipMouse': PointSelection(
                on: {GestureType.hover},
                devices: {PointerDeviceKind.mouse},
              ),
            },
            crosshair: CrosshairGuide(),
          ),
        ),
      ),
    );
  }
}
Any help is much appreciated. Thanks!
Hi, it is great library, but I have problem with performance. I have classic line chart with a lot of data. But chart is too slow, i cant zoom because it is not possible. I'm trying it on the web.
Config:
selections: {
              'tooltipMouse': PointSelection(
                on: {
                  GestureType.hover,
                },
                devices: {PointerDeviceKind.mouse},
                variable: 'Datum',
                dim: Dim.x,
              ),
              'tooltipTouch': PointSelection(
                on: {
                  GestureType.scaleUpdate,
                  GestureType.tapDown,
                  GestureType.longPressMoveUpdate
                },
                devices: {PointerDeviceKind.touch},
                variable: 'Datum',
                dim: Dim.x,
              ),
            },
coord: RectCoord(
              horizontalRangeUpdater: Defaults.horizontalRangeSignal,
            ),
data: _data,
            variables: {
              'Datum': Variable(
                accessor: (Map datum) => datum['Datum'] as String,
                scale: OrdinalScale(),
              ),
              'Hodnota': Variable(
                accessor: (Map datum) => datum['Hodnota'] as num,
                scale: LinearScale(),
              ),
              'Skupina': Variable(
                accessor: (Map datum) => datum['Skupina'] as String,
                scale: OrdinalScale(),
              ),
            },
            elements: [
              LineElement(
                position:
                    Varset('Datum') * Varset('Hodnota') / Varset('Skupina'),
                color: ColorAttr(
                  variable: 'Skupina',
                  values: [
                    const Color.fromARGB(255, 0, 236, 0),
                    const Color.fromARGB(255, 0, 128, 255),
                    const Color.fromARGB(255, 192, 192, 192),
                  ],
                ),
              ),
            ],
            axes: [
              Defaults.horizontalAxis,
              Defaults.verticalAxis,
],A declarative, efficient, and flexible JavaScript library for building user interfaces.
🖖 Vue.js is a progressive, incrementally-adoptable JavaScript framework for building UI on the web.
TypeScript is a superset of JavaScript that compiles to clean JavaScript output.
An Open Source Machine Learning Framework for Everyone
The Web framework for perfectionists with deadlines.
A PHP framework for web artisans
Bring data to life with SVG, Canvas and HTML. 📊📈🎉
JavaScript (JS) is a lightweight interpreted programming language with first-class functions.
Some thing interesting about web. New door for the world.
A server is a program made to process requests and deliver data to clients.
Machine learning is a way of modeling and interpreting data that allows a piece of software to respond intelligently.
Some thing interesting about visualization, use data art
Some thing interesting about game, make everyone happy.
We are working to build community through open source technology. NB: members must have two-factor auth.
Open source projects and samples from Microsoft.
Google ❤️ Open Source for everyone.
Alibaba Open Source for everyone
Data-Driven Documents codes.
China tencent open source team.