Comments (8)
 entronad
commented on May 14, 2024
1
entronad
commented on May 14, 2024
1
After thinking thoroughly, dimensions now has a enum type Dim instead of int [1, 2], which is always confused with [0, 1], in the new v0.7.0
from graphic.
entronad
commented on May 14, 2024
Grid lines depend on ticks. How to calculate where there are ticks is called "nice number calculattion".
The current automatic nice number calculation seems not intelligent enough, we are working on it.
The temporary solution is to indicate the tick count mannually (I guess you want the first grid to align to the starting radius, so added align: 0):
'index': Variable(
  accessor: (Map map) => map['index'].toString(),
  scale: OrdinalScale(tickCount: 13, align: 0),
),
from graphic.
 Kashorako
commented on May 14, 2024
Kashorako
commented on May 14, 2024
Grid lines depend on ticks. How to calculate where there are ticks is called "nice number calculattion". The current automatic nice number calculation seems not intelligent enough, we are working on it.
The temporary solution is to indicate the tick count mannually (I guess you want the first grid to align to the starting radius, so added
align: 0):'index': Variable( accessor: (Map map) => map['index'].toString(), scale: OrdinalScale(tickCount: 13, align: 0), ),
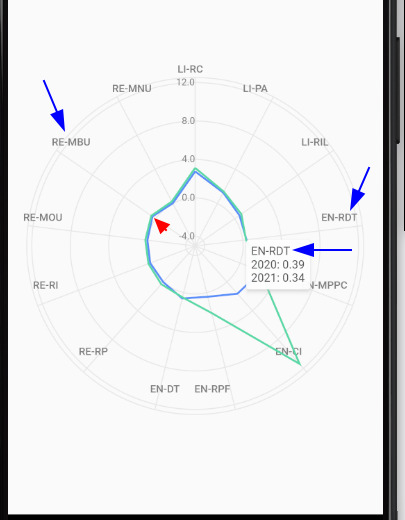
Hello my friend, thank you for your answer, effectively the points appeared after changing the ticks as you suggested, but now we have problems related to the touch.
For example in the next image if i touch the red arrow, the tooltip for the blue arrow is being displayed, this problem happens in most of the points.
You can also see the reproduction of the error in the next video:
WhatsApp.Video.2021-12-21.at.3.05.28.PM.mp4
Thank you for your help!
from graphic.
entronad
commented on May 14, 2024
Please provide your specifications, especially the variables, selections and tooltip.
Your selection involves different groups and multiple variables, a little bit complex, so it may need some special indications.
from graphic.
Kashorako
commented on May 14, 2024
Hello @entronad , as you requested, we are sending the chart and variables:
child: Chart(
                                data: mapRatios,
                                variables: {
                                  'initials': Variable(
                                    accessor: (Map map) =>
                                        map['initials'].toString(),
                                    scale:
                                        OrdinalScale(tickCount: 13, align: 0),
                                  ),
                                  'name': Variable(
                                    accessor: (Map map) =>
                                        map['name'].toString(),
                                  ),
                                  'year': Variable(
                                    accessor: (Map map) =>
                                        map['year'].toString(),
                                  ),
                                  'value': Variable(
                                    accessor: (Map map) => map['value'] as num,
                                    scale: LinearScale(min: (valmin - 5)),
                                  ),
                                },
                                elements: [
                                  LineElement(
                                    position: Varset('initials') *
                                        Varset('value') /
                                        Varset('year'),
                                    shape: ShapeAttr(
                                      value: BasicLineShape(
                                        loop: true,
                                      ),
                                    ),
                                    color: ColorAttr(
                                      variable: 'year',
                                      values: Defaults.colors10,
                                    ),
                                  ),
                                ],
                                coord: PolarCoord(),
                                axes: [
                                  AxisGuide(
                                    flip: true,
                                    position: 1,
                                    line: StrokeStyle(
                                      color: const Color(0xffe8e8e8),
                                    ),
                                    label: LabelStyle(
                                      const TextStyle(
                                        fontSize: 11,
                                        color: Color(0xff808080),
                                        fontWeight: FontWeight.w500,
                                      ),
                                      offset: const Offset(-5, -15),
                                    ),
                                    variable: 'initials',
                                    grid: StrokeStyle(
                                      color: const Color(0xffe8e8e8),
                                    ),
                                  ),
                                  // Defaults.circularAxis,
                                  Defaults.radialAxis,
                                ],
                                selections: {
                                  'touchMove': PointSelection(
                                    on: {
                                      GestureType.scaleUpdate,
                                      GestureType.tapDown,
                                      GestureType.longPressMoveUpdate
                                    },
                                    dim: 0,
                                    variable: 'initials',
                                  )
                                },
                                tooltip: TooltipGuide(
                                  align: Alignment.bottomRight,
                                  multiTuples: true,
                                  variables: ['year', 'value'],
                                ),
                              ),
Thank you so much
from graphic.
entronad
commented on May 14, 2024
The problem is dim: 0 should be dim: 1. The dim in the plane is 1 and 2, not 0 and 1.
I am also doubt which one to describe the dim is better, [1, 2] or [0, 1]?
from graphic.
Kashorako
commented on May 14, 2024
@entronad Thank you so much for your quick answers, it's now working
Bleesings, happy new year!
from graphic.
entronad
commented on May 14, 2024
The tick nice number algorithm is optimized in 0.8.0, now tickCount can be saved in this case.
from graphic.
Related Issues (20)
- line Chart如何设置线条的头尾部为圆角呢? HOT 1
- Weird behaviour on stacked bar graph HOT 1
- Graphic ideas
- 如何实现拖拽改变图表? HOT 1
- How to get original data in custom shape?
- LinearScale: How LinearScale should be corrected for values up to 2.5 with tickCount=5
- Add showLabel bool in TooltipGuide
- how to do interval bar chart like this
- Y-Axis is incorrect when using multiple AreaMarks HOT 2
- Stacked Area Graphs: Random Layers and limited Tooltip Information
- Scroll
- LICENSE is not detected by pub.dev
- Is it possible to have an Annotation clickable?
- Sunburst Chart.
- 是否可以实现左右2个y轴显示不同类型的数据,例如左边是时长 /h,右边是距离 /m。
- Help to formulate Sankey Diagram
- 请问能否实现类似图数据库的有向图的图形和交互? HOT 1
- 处理10万个数据时候有点慢,有优化空间吗
- 添加动画后,点击图表或者在图表上移动,都会触发动画。 HOT 2
- renderBasicitem not found
Recommend Projects
-
 React
React
A declarative, efficient, and flexible JavaScript library for building user interfaces.
-
Vue.js
🖖 Vue.js is a progressive, incrementally-adoptable JavaScript framework for building UI on the web.
-
 Typescript
TypeScript is a superset of JavaScript that compiles to clean JavaScript output.
-
TensorFlow
An Open Source Machine Learning Framework for Everyone
-
Django
The Web framework for perfectionists with deadlines.
-
 Laravel
A PHP framework for web artisans
-
D3
Bring data to life with SVG, Canvas and HTML. 📊📈🎉
-
Recommend Topics
-
javascript
JavaScript (JS) is a lightweight interpreted programming language with first-class functions.
-
web
Some thing interesting about web. New door for the world.
-
server
A server is a program made to process requests and deliver data to clients.
-
Machine learning
Machine learning is a way of modeling and interpreting data that allows a piece of software to respond intelligently.
-
Visualization
Some thing interesting about visualization, use data art
-
Game
Some thing interesting about game, make everyone happy.
Recommend Org
-
Facebook
We are working to build community through open source technology. NB: members must have two-factor auth.
-
Microsoft
Open source projects and samples from Microsoft.
-
Google
Google ❤️ Open Source for everyone.
-
Alibaba
Alibaba Open Source for everyone
-
D3
Data-Driven Documents codes.
-
Tencent
China tencent open source team.
from graphic.