iHam (“interactive HOG Analysis Method’) is an interactive javascript tool based on the TnT library to visualise the evolutionary history of a specific gene family (HOGs). The viewer is composed of two panels: a species tree which lets the user select a node to focus on a particular taxonomic range of interest, and a matrix that organizes extant genes according to their membership in species (rows) and hierarchical orthologous groups (columns).
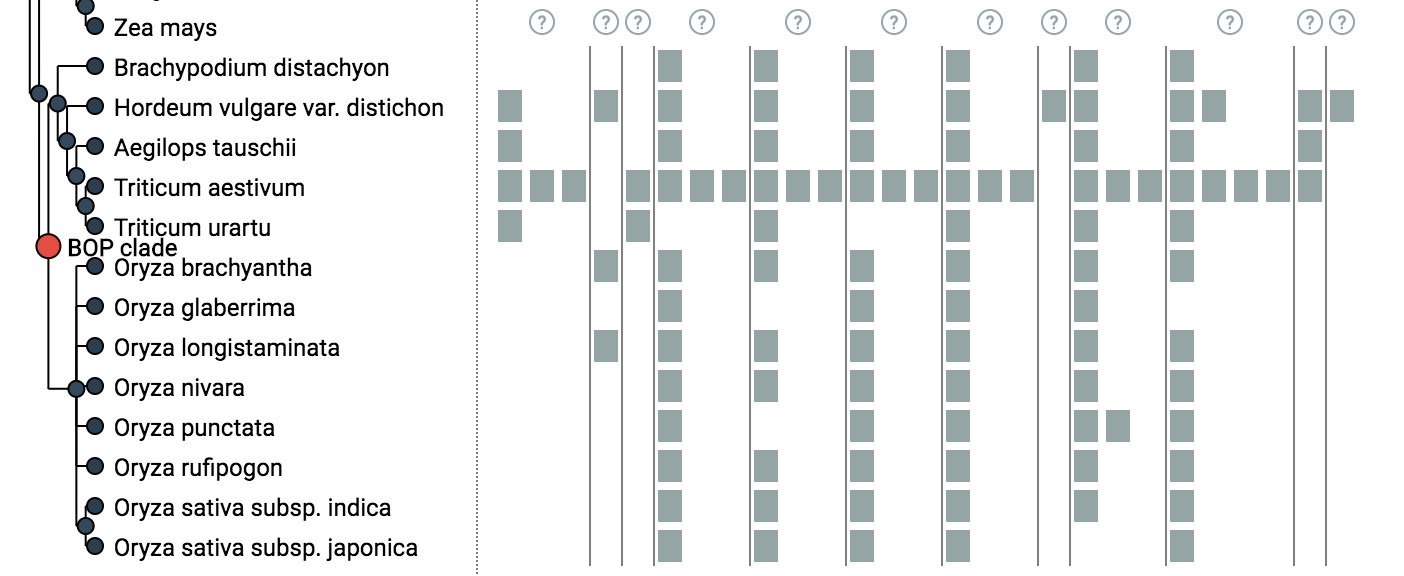
The tree-guided matrix representation of HOGs facilitates: (i) to delineate orthologous groups at given taxonomic ranges, (ii) to identify duplication and loss events in the species tree, (iii) gauge the cumulative effect of duplication and losses on gene repertoires, and to (iv) identify potential mistakes (e.g. if losses are concentrated on terminal branches — indicative of incomplete genomes, or if the species coverage within a HOG is implausible) in genome assembly, annotation, or orthology inference. Users can customize the view in different ways. They can color genes according to protein length or GC-content. Low-confidence HOGs can be masked. Irrelevant clades of species can be collapsed. iHam is a reusable web widget that can be easily embedded into a website, for instance it is used to display HOGs in OMA (http://omabrowser.org; Altenhoff et al. 2018). It merely requires as input HOGs in the standard OrthoXML format (Schmitt et al. 2011), the underlying species tree in newick format and gene family information in JSON format (see below for examples).
A brief video tutorial is available at this URL: https://www.youtube.com/watch?v=6eAoamP7NLo.
If you use iHam in your work, please consider citing:
Clément-Marie Train, Miguel Pignatelli, Adrian Altenhoff, Christophe Dessimoz; iHam and pyHam: visualizing and processing hierarchical orthologous groups, Bioinformatics, bty994, https://doi.org/10.1093/bioinformatics/bty994
The iHam library can be directly loaded using the following link to the latest release:
<!-- Load the javascript -->
<script src="https://dessimozlab.github.io/iHam/iHam.js"></script>

<!-- Load the stylesheet -->
<link rel="stylesheet" href="https://dessimozlab.github.io/iHam/iHam.css"/>
As an alternative to dynamic embedding, iHam can be installed using yarn or npm:
$ npm install --save iham
$ yarn add iham
And build using
$ npm run build && npm run build-css
var iham = iHam()
    .newick(newick)
    .orthoxml(orthoxml)
    .fam_data(fam_data);

var container = document.getElementById("container");
iham(document.getElementById(container);
See below for a description of each method. The above snippet, assumes that the widget will be rendered in a div element with id container.
Support by iHam of various HOG inference ressources.
| Resource | Species tree format | OrthoXML | Support |
|---|---|---|---|
| OMA browser | PhyloXML and Newick | All HOGs, or one HOG at a time | YES |
| OMA standalone | PhyloXML and Newick | All HOGs | YES |
| Ensembl | Newick | one HOG at a time | YES |
| HieranoidDB | Newick | one HOG at a time | YES |
See this example in this repository demonstrating how to use some of the widget options and API calls, like colouring the genes based on sequence length or hiding low coverage HOGs.
iHam exposes several methods to set up the widget.
The tree corresponding to this HOG where species names should matched the one in the orthoxml file in newick or phyloxml format.
For example:
((((((((("Plasmodium falciparum (isolate 3D7)")"Plasmodium falciparum")"Plasmodium (Laverania)")"Plasmodium")"Haemosporida")"Aconoidasida")"Apicomplexa")"Alveolata",(((((((((("Schizosaccharomyces pombe (strain 972 / ATCC 24843)")"Schizosaccharomyces pombe")"Schizosaccharomyces")"Schizosaccharomycetaceae")"Schizosaccharomycetales")"Schizosaccharomycetes")"Taphrinomycotina",((((((("Ashbya gossypii (strain ATCC 10895 / CBS 109.51 / FGSC 9923 / NRRL Y-1056)")"Ashbya gossypii")"Eremothecium",(("Saccharomyces cerevisiae (strain ATCC 204508 / S288c)")"Saccharomyces cerevisiae")"Saccharomyces")"Saccharomycetaceae")"Saccharomycetales")"Saccharomycetes")"Saccharomycotina")"saccharomyceta")"Ascomycota")"Dikarya")"Fungi")"Opisthokonta")"Eukaryota")"LUCA";
The HOG data in orthoxml format. Examples of these files can be downloaded directly from the OMA Browser website. See for example the orthoxml file corresponding to the NOX1 gene
The description of the genes present in the HOG family. Examples of these files can be downloaded directly from the OMA Browser website. See for example the family file corresponding to the NOX1 gene
const iham = iHam()
    .newick(newick)
    .orthoxml(orthoxml)
    .fam_data(fam_data)
This option is just used to highlight a gene in the visualisation. It accepts an object that must have an id property. This id has to correspond with the ids in the orthoxml file.
const iham = iHam()
    .query_gene({id: 41434})
This method accepts a callback that will be executed every time a gene is displayed in the visualisation. This callback should return a color that will be used to display each of these genes. Internally, this callback is called with the information provided in the orthoxml file:
const iham = iHam()
    .gene_colors(function (d) {
        return (d.id === 3965 ? "#27ae60" : "#95a5a6");
     });
This method can be used to set a coverage threshold for the genes in the visualisation. This threshold refers to the percentage of species (in the provided tree) the HOG is present in.
const iham = iHam()
    .coverage_threshold(50); // Only HOGs having genes in at least 50% of the species will be shown
Sets the width of the tree side of the widget (in pixels)
const iham = iHam()
    .tree_width(400)
Sets the width of the board side of the widget (in pixels)
const iham = iHam()
    .board_width(800)
The widget emits a number of events that allow the host application to response to different situations, for example, to know when the visualisation is updading or when hogs are removed because of the coverage threshold set. It is possible to subscribe to these events using the on method:
This event is dispatched every time a new node is selected in the tree. The information about the node is passed to the required callback:
const iham = iHam()
  .on('node_selected', function (node) {
    d3.select('#current-node')
      .text(node.node_name());
  })
The updating event is dispatched when the tree and the board have been asked to update. The updated event is dispatched when the update has finished. They can be used, for example, to show a spinner while the update is happening.
.on("updating", function() {
  d3.select("#updating")
    .style("display", 'block');
})
.on("updated", function () {
  d3.select("#updating")
    .style("display", "none");
})
This method is fired when there are hogs removed based on threshold coverage. The required callback is called passing an array with the removed hogs.
var iham = iHam()
  .on("hogs_removed", function (hogs) {
    console.log(hogs);
    if (what.length) {
      d3.select(".alert_remove")
        .style("display", "block")
    } else {
      d3.select(".alert_remove")
        .style("display", "none");
    }
  });


