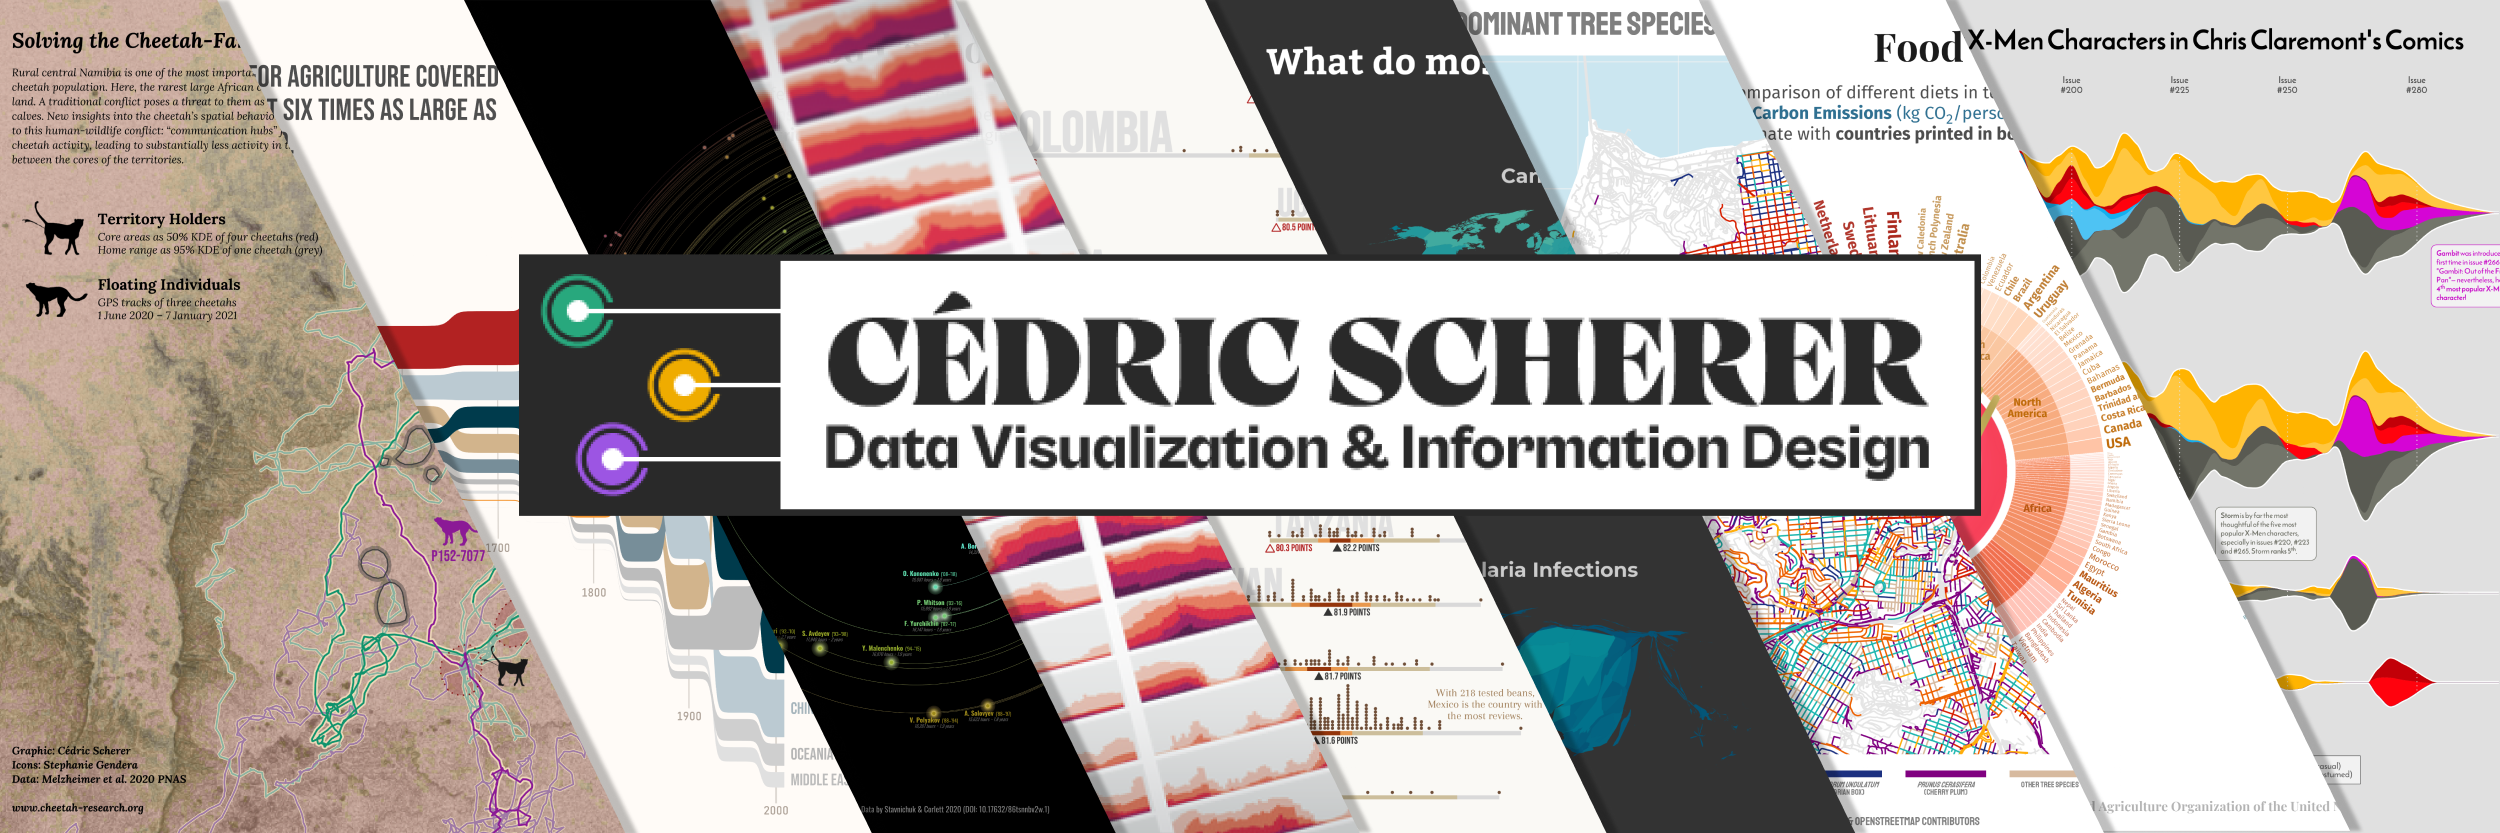

My contributions to the #TidyTuesday challenge, a weekly data visualization challenge. All plots are 💯 created in R with ggplot2.


Hi Cedric! I've been reproducing your code and I've faced with this error in the first summarize, with the sentence nationality = unique(nationality). The message is: "Error: Column nationality must be length 1 (a summary value), not 2".
I an using your code to learn how you produced such beautiful output. I am running into an issue. I hope you'll find time to teach me how to overcome this.
When you build your theme, you use plot.margin = margin(30, 60, 30, 60) That errors on me. I think you need to use plot.margin = unit(c(30, 60, 30, 60), "mm") but I do not know what units (like I have "mm") to use to replicate your output. Do you have any ideas?
Really great work! Thank you for sharing.
As I tried later codes, I find some problems listed beforehand are addressed (such as those we discussed in #4). However, new ones are coming occationally. For instance, for the example in 2019-20, I get (using same code listed in rmarkdown):

The fonts are not in the tiles, which is annoying. Any way to solve this problem?
Thanks.
Hello there, thank you for the awesome work to reach so many wonderful figures via ggplot2. I have an issue when reproducing the 2018-03 figure, producing the following figure:
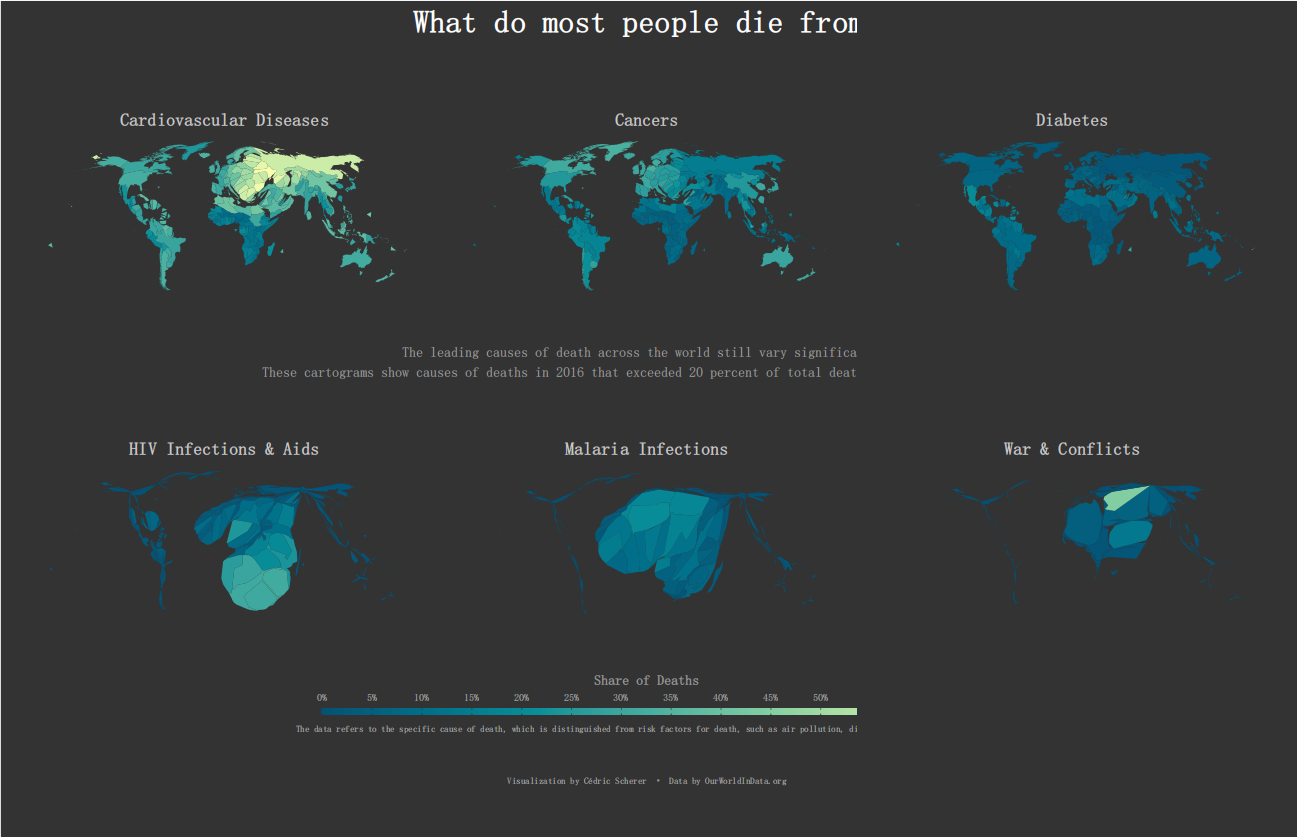
I assume there are two problem occuring here: 1. the 3rd and 6th plot is covering the 2nd and 5th one; 2. fonts could not be loaded automatilcally. Furthermore, because the update of the packages, I find warnings listed as:
old-style crs object detected; please recreate object with a recent sf::st_crs()
Warning messages:
1: It is deprecated to specify `guide = FALSE` to remove a guide. Please use `guide = "none"` instead.
Is there any way to figure them out? Thanks.
A declarative, efficient, and flexible JavaScript library for building user interfaces.
🖖 Vue.js is a progressive, incrementally-adoptable JavaScript framework for building UI on the web.
TypeScript is a superset of JavaScript that compiles to clean JavaScript output.
An Open Source Machine Learning Framework for Everyone
The Web framework for perfectionists with deadlines.
A PHP framework for web artisans
Bring data to life with SVG, Canvas and HTML. 📊📈🎉
JavaScript (JS) is a lightweight interpreted programming language with first-class functions.
Some thing interesting about web. New door for the world.
A server is a program made to process requests and deliver data to clients.
Machine learning is a way of modeling and interpreting data that allows a piece of software to respond intelligently.
Some thing interesting about visualization, use data art
Some thing interesting about game, make everyone happy.
We are working to build community through open source technology. NB: members must have two-factor auth.
Open source projects and samples from Microsoft.
Google ❤️ Open Source for everyone.
Alibaba Open Source for everyone
Data-Driven Documents codes.
China tencent open source team.