vizzuhq / vizzu-lib Goto Github PK
View Code? Open in Web Editor NEWLibrary for animated data visualizations and data stories.
Home Page: https://lib.vizzuhq.com
License: Apache License 2.0
Library for animated data visualizations and data stories.
Home Page: https://lib.vizzuhq.com
License: Apache License 2.0


plot: { xAxis: { label: { transform: ‘rotate(-45deg)’ } } }

Persio, a small startup asked that: do we have next.js module?
use case: easy dark/light mode switch, or themes
const el = document.getElementById("myVizzu");
const styles = window.getComputedStyle(el);
styles.getPropertyValue("--plot-marker-label-position");
// style: { plot: { marker: { label: { position: "whatever"}}}}
Legend and Geometry: Area charts work in reverse of each other as shown in the attached image.

I attempted to remedy this with configurations (reverse, orientation, rotate, etc.), but none seemed to solve with desirable outcome. It would be nice if this directionality was corrected by default, or a configuration to reverse the order in the Y Axis.
I see this emsc appearing on my legend and axis
but this isn't part of my data.

any idea where is this coming from?
Thanks
If I log the actual config
console.log(chart.config)
the tooltip value will be wrong (18446744073709551615)
... "title": "Stack", "tooltip": "18446744073709551615", "channels": { ...
Is it possible to render to existed canvas element?
Perhaps I am doing something silly, but trying to recreate the tutorial line by line, I get this error when trying to add a tooltip.
import Vizzu from "https://cdn.jsdelivr.net/npm/[email protected]/dist/vizzu.min.js";

let data = {
  series: [
  {
    name: 'Genres',
    type: 'dimension',
    values: [
    'Pop', 'Rock', 'Jazz', 'Metal',
    'Pop', 'Rock', 'Jazz', 'Metal',
    'Pop', 'Rock', 'Jazz', 'Metal'
    ]
  },
  {
    name: 'Types',
    type: 'dimension',
    values: [
    'Hard', 'Hard', 'Hard', 'Hard',
    'Smooth', 'Smooth', 'Smooth', 'Smooth',
    'Experimental', 'Experimental', 'Experimental', 'Experimental'
    ]
  },
  {
    name: 'Popularity',
    type: 'measure',
    values: [ 114, 96, 78, 52, 56, 36, 174, 121, 127, 83, 94, 58 ]
  }
  ]
};

let chart = new Vizzu('vizzu-tooltip')

chart.animate({ data });

chart.animate({
  config: {
    channels: {
      x: { set: ['Genres'] },
      y: { set: ['Popularity'] }
    }
  }
})

chart.feature('tooltip',true)
I am on [email protected], using npm live-server.
So I am very much sure my data does not end with low values right now.
But every day, the graph still ends as it seems to require finishing down its drawing to zero.
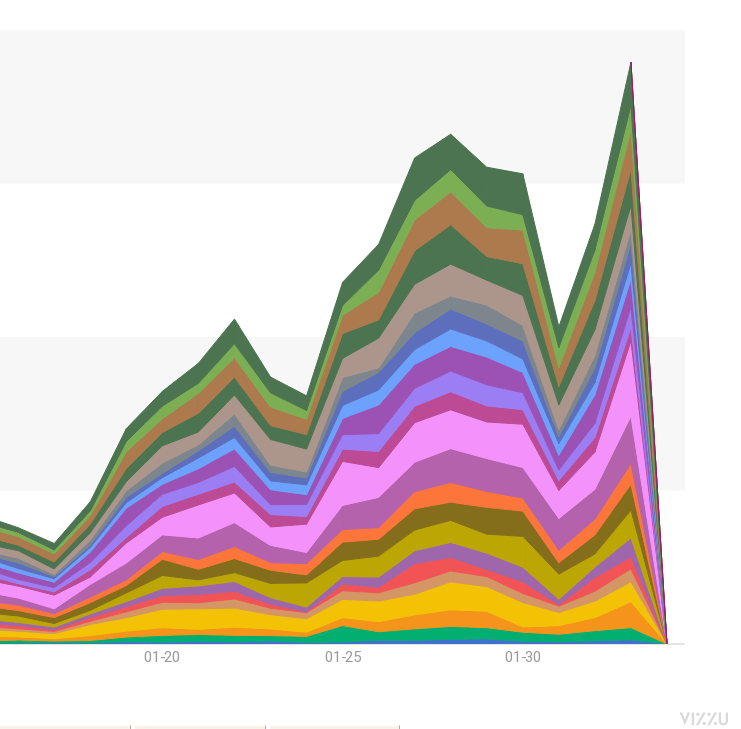
It is possible that's within Vizzu's engine that it drops to low values near the end like that?
Expected
Actual
Thanks
Hi,
my X axis contains more than 700 values (dates), which overlaps and looks like a big gray box.

How do I skip values, or override how this is displayed?
thanks
Events seem to fail to unregister while using the off method on a chart while multiple instances of the same handler is registered.
Support setting styles from JSON file.
Currently the chart's animate() method accepts style settings as objects:
let style = { ... };
chart.animate({ data, config, style });
If the parameter's style property is not an object, but a string, it should be considered as an URI for a style JSON file.
let style = '/mystyles.json';
chart.animate({ data, config, style });
Current implementation: https://github.com/vizzuhq/vizzu-lib/blob/main/src/apps/weblib/js-api/vizzu.js
Would anyone be interested in providing chart blocks for hal9.com? You can send us PRs to https://github.com/hal9ai/hal9ai
Although it's easy enough to transform the data, it'd be nice if Vizzu accepts data as an array of objects e.g.
[
{ Genre: 'Pop', Type: 'Hard', Popularity: 114 },
{ Genre: 'Rock', Type: 'Hard', Popularity: 96 },
...
]
Vizzu.style should return only the user-set styles, and there should be another function computedStyle() which returns all the styles regardless of being set or not by the user.
Currently, the chart's animate() method returns a promise. The starting animation can be controlled (pause/play/seek) through the chart's animation property.
let anim = chart.animate();
chart.animation.pause();
This two entity should be integrated together. The desired usage would be:
let anim = chart.animate();
anim.pause();
Current implementation:
https://github.com/vizzuhq/vizzu-lib/blob/main/src/apps/weblib/js-api/vizzu.js
https://github.com/vizzuhq/vizzu-lib/blob/main/src/apps/weblib/js-api/animcontrol.js
Upon removing a series from label, the numbers run to zero while fading out.
See below gif
Is this intended? My expectation would be a simple fadeout.
The types for color palettes are a little odd.
type Color = `#${number}`
	|`rgb(${number},${number},${number})`
	|`rgba(${number},${number},${number},${number})`;

type ColorPalette = Color
	| `${Color} ${Color}`
	| `${Color} ${Color} ${Color}`
	| `${Color} ${Color} ${Color} ${Color}`
	| `${Color} ${Color} ${Color} ${Color} ${Color}`;
This makes sense, but in the docs, and in many CSS hex codes, they aren't just numbers.
In the docs, the examples give #9355e8FF #123456FF #BDAF10FF as a valid option, but this throws a TS error because there are numbers and letters.
Changing the color template string to #1 #11 #1 fixes the TS error, but is not actually valid.
type Color = `#${number | string}`
	|`rgb(${number},${number},${number})`
	|`rgba(${number},${number},${number},${number})`;
This solves my use case, but I'm not sure if there was some logic around needing to be a number?
In the distributed package.json, the key for TS types is missing, thus leading to TS complaining it cannot find them.
// package.json
{
  "name": "vizzu",
   ...
  "types": "dist/vizzu.d.ts",
  ...
}
They are being included, but not referenced. Doing the above in my node_modules directory solved the issue
The data object in the Usage section of the README does not fit the type definition of a Data.Set.
See error below (ignore the React specific code around it)
Based on the comment in the type definition file, the type property should be made optional on this line
I also see why it would be strictly required, but then the README needs to be updated to reflect that.
Emscripten generates a JavaScript interface for the compiled wasm code /weblib/cvizzu.js with a lot of unnecessary checks:
"... was not exported. add it to EXTRA_EXPORTED_RUNTIME_METHODS (see the FAQ)"
Empscripten should be configured to not emit these checks, or if it not possible, the checks should be discarded in an additional build step.
Empscripten configuration: https://github.com/vizzuhq/vizzu-lib/tree/main/project/cmake/weblib
Building the project: https://github.com/vizzuhq/vizzu-lib/blob/main/project/build.md
Also, does it support server-side rendering?
Originally posted by @Zonalds in #147 (comment)
Create reveal.js plugin, where animations are triggered by reveal.js events.
Vizzu implements an abstract, chart type independent data visualization interface.
It would be good to provide explicit chart type presets (bar, pie, ...) for beginner users.
Interface: Vizzu class should have a static preset property, with methods for the different chart types.
these methods should return a chart config object specific for the selected chart type.
Usage:
chart.animate(Vizzu.presets.bar(['y axis data series 1', ...], ['x axis data series 1', ... ]));
Example output:
Vizzu.presets.bar(['a','b'], ['c', 'd' ])
->
{
  channels: {
    x: [ 'c', 'd'],
    y: ['a','b'],
    color: null,
    size: null,
    lightness: null,
    noop: null
  },
  geometry: 'rectangle',
  coordSystem: 'cartesian'
}
Vizzu class source file: https://github.com/vizzuhq/vizzu-lib/blob/main/src/apps/weblib/js-api/vizzu.js
Implemented Chart type examples: https://github.com/vizzuhq/vizzu-lib/tree/main/test/integration/test_cases/static_chart_types
It seems that the axis label number format adapts to the next animation phase instead of the actual one.
Example: https://jsfiddle.net/VizzuHQ/qtdgejsk/

On the attached screenshot of an example, the first three rows have 0 (or empty) values in all years, but the markers still appear.
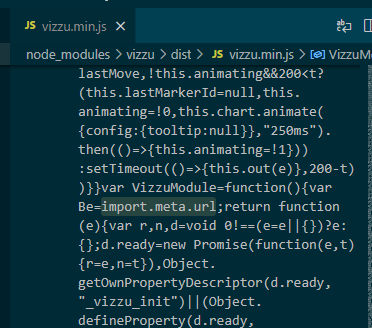
If Vizzu is deployed to production with console.log statements dropped, via Terser, the chart is not rendered and an exception is thrown.
If Terser is disabled, the chart library works fine.
Apologies for all the TS issues, please let me know if it's too much.
The records are only allowed to be strings, but I think numbers are valid as well.
interface Table1NF extends Filter {
  /** The list of the data series that make up the data set. */
  series?: Series[];
  /** The array of data records to be appended to the end of the data set. */
  records?: string[][];
}
Should the records only be strings? I have added a //@ts-ignore and this works with numbers. This [fiddle] also shows with numbers.
Is there an example of user interaction, i.e. I click a button, chart gets updated (for example with a different filter value)? I assume this could be achieved by registering a handler via chart.on() but the tutorial does not seem to have an example of this.
The Javascript API is documented now using a TypeScript type declaration file:
https://github.com/vizzuhq/vizzu-lib/blob/main/src/apps/weblib/js-api/vizzu.d.ts
It would be better to convert it to a JSon Schema file instead, then, we could generate both the d.ts file and python bindings for ipyvizzu from it.
A potential tool for generating the d.ts file:
https://www.npmjs.com/package/json-schema-to-typescript
https://jsfiddle.net/VizzuHQ/oqra16dg/1/
et data = {
  series: [
    { name: 'Foo', values: ['Alice', 'Bob', 'Ted'] },
    { name: 'Bar', values: [15, 32, 12] }
  ]
};

let chart = new Vizzu("myVizzu", { data });

chart.animate({
  y: 'Foo',
  x: 'Bar'
});

chart.animate({
  color: 'Foo',
  y: ['Bar','Foo'],
  x: null
});
Orientation should change to horizontal in this step.
interface definitions are missing from presets.d.ts
I'm playing around in a react project created with create-react-app (which uses webpack for bundling) and between how Vizzu is trying to locate its WASM and how webpack bundles it, I can't figure out an elegant way to get it to work.
I realize this is not an issue with Vizzu per se, but wanted to highlight it, as it will be important for the adoption.
Details as I understand them right now.
The vizzu js module tries to import its own wasm module based on its own import path.
In my case this resolves to http://localhost:3000/node_modules/vizzu/dist/cvizzu.wasm

This file path is not recognized by the local dev server (as it only bundles .js/.ts files by default)
Since the path is not recognized it serves the main webpage I'm trying to develop to test the module.

The wasm parser naturally fails to parse this and I get an empty page.

I know that there is a way to update the webpack config in order to serve the wasm file on this exact path, which is a half-decent solution but I don't (yet) know how to do it. I'll add details here once I have them
vizzu.min.js:19 Uncaught RangeError: WebAssembly.Memory(): could not allocate memory
at eval (vizzu.min.js:19:1)
at new Vizzu (vizzu.min.js:19:1)
at eval (ShareOfChart.js:158:1)
at invokePassiveEffectCreate (react-dom.development.js:23487:1)
at HTMLUnknownElement.callCallback (react-dom.development.js:3945:1)
at Object.invokeGuardedCallbackDev (react-dom.development.js:3994:1)
at invokeGuardedCallback (react-dom.development.js:4056:1)
at flushPassiveEffectsImpl (react-dom.development.js:23574:1)
at unstable_runWithPriority (scheduler.development.js:468:1)
at runWithPriority$1 (react-dom.development.js:11276:1)
https://jsfiddle.net/simzer/ey1apt68/1/
The bug introduced with this: #146
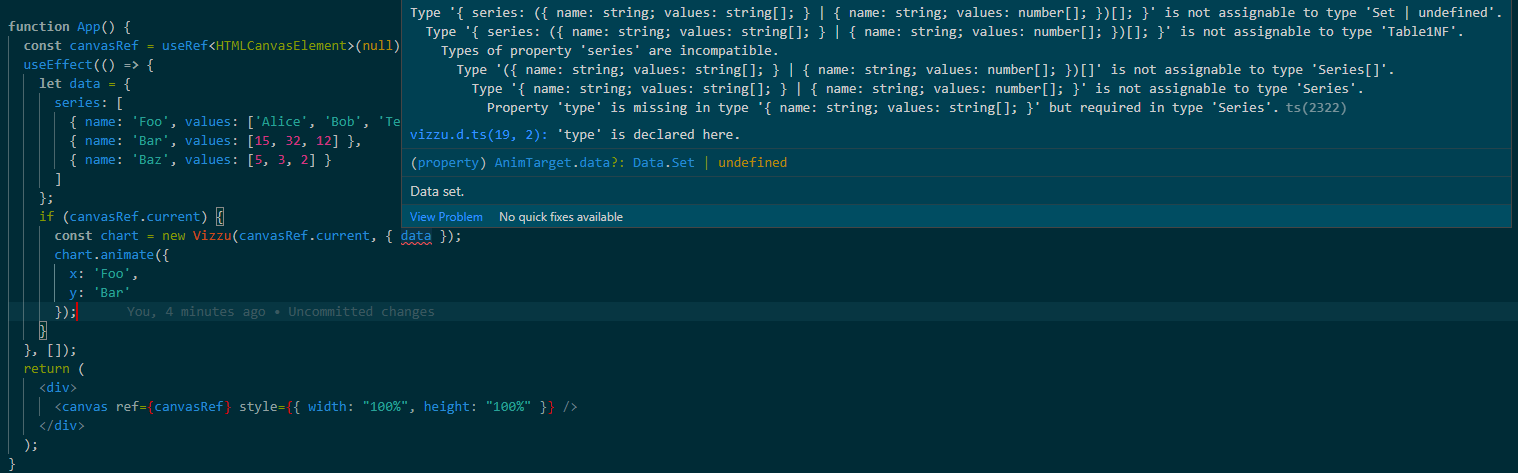
In the first example, the series of Foo, Bar and Baz fails to compile for TS.
Here is a screenshot of the error after copy / pasting.

It's complaining that type is required on each entry, but is not present in the example.
I am not sure if the following is correct, but it passes TS
import Vizzu, { AnimTarget } from 'vizzu'

let data: AnimTarget['data'] = {
    series: [
      { name: 'Foo', values: ['Alice', 'Bob', 'Ted'], type: 'dimension' },
      { name: 'Bar', values: [15, 32, 12], type: 'measure' },
      { name: 'Baz', values: [5, 3, 2], type: 'measure' }
    ]
  }

let chart = new Vizzu('myVizzu', { data })
If type is not actually required, perhaps make it so in the types. If it is, could you add it to the example?
The doc says that data can be specified by records, which I believe is referred to as Table1NF in the type definitions (at least based on the keys in that type)
let data = {
  series: [
    { name: 'Genres', type: 'dimension' },
    { name: 'Types', type: 'dimension' },
    { name: 'Popularity', type: 'measure' }
  ],
  records: [
    ['Pop', 'Hard', 114],
    ['Rock', 'Hard', 96],
    ['Jazz', 'Hard', 78],
    ['Metal', 'Hard', 52],
    ['Pop', 'Smooth', 56],
    ['Rock', 'Smooth', 36],
    ['Jazz', 'Smooth', 174],
    ['Metal', 'Smooth', 121],
    ['Pop', 'Experimental', 127],
    ['Rock', 'Experimental', 83],
    ['Jazz', 'Experimental', 94],
    ['Metal', 'Experimental', 58],
  ]
};
The type definition however requires that values must be set on the items of the series object. I believe type has been solved in #12 but that still means that values are required where they shouldn't be, according to the docs.
// comments stripped
interface SeriesMetaInfo
{
	name: string;
	type?: 'dimension'|'measure';
}

// [...]

interface Series extends SeriesMetaInfo {
  values: Values;
}

// [...]

interface Table1NF extends Filter {
  series?: Series[];
  records?: string[][];
}
I find the Table1NF naming confusing here, but I assume this is supposed to be a union type of the 'by series' and 'by records' specification of data. I don't think there is an elegant way around registering a separate interface for each of those.
I'll submit a PR soon.
Hi all!
Awesome project!
I'm looking for the example code which made the logo gif.
Is it shareable?
Atm i'm trying to concat the animations from 1 -> 2 in examples wihout success
https://lib.vizzuhq.com/0.3.0/#example-1.1.0

https://lib.vizzuhq.com/0.3.0/#example-1.1.1
can anyone guide/help me?
https://jsfiddle.net/crashlaker/7L3yg1bk/
regards,
C.
ps: perhaps we could only do this with the same dataset
This is a strange one, I'm not even sure it's a bug or just unexpected for me.
In my WIP application, I'm keeping track of the config object I'm passing to Vizzu because I use it to render pieces of the UI.
This state object extends the AppState interface from the below definition:
import { Data, Config } from "vizzu/dist/vizzu";
type FullConfig = NoOptional<Config.Chart>;
interface AppState {
  chartConfig: FullConfig;
  dataset: Data.TableBySeries;
}
in my app I pass this to Vizzu every single time it gets modified by my app
// whenever state.chartConfig is changed by the app
chart.animate({
  config: state.chartConfig,
});
in another place I attempt to render UI elements based on the state object, and so I loop through the key-value pairs of state.chartConfig.channels. a simplified snippet for this would be e.g.:
const colorSeries = state.chartConfig.channels.color
colorSeries.map(series => // render the ui)
However, after the first UI change, I get the following error:
TypeError: selected.map is not a function
Looking at my state object, it's because the channels no longer hold string arrays, they have been replaced by objects

I believe this is done because JavaScript passes objects by reference and not by value, so this line in the lib mutates my original object, instead of creating a copy for its own internal use.
This can be solved in two places in my view.
I think option 1 would give the better developer experience.
This can be replicated by following the plots in the sorting tutorial notebook.
As you follow along, the second to last plot looks like this:

and the final plot looks like:

Here - I think ideally, the final plot would have multi-tiered x axis labels, as by default it is impossible to know what each of the Genre bars within a Kind represent.
let conf = chart1.config
chart2.animate({config: conf})
error: std::bad_cast
v1.: Enable other standard options than SI, (K, M, B, T)
v2.: Enable custom options set by the user
Question: Can the same prefixes be used on tooltips and labels? Instead of writing 3458387205, 3.46B or 3,458M could be used.
I believe the rotation option was removed from the implementation but remains in the type definitions.

When trying to set it

https://jsfiddle.net/simzer/tfmjsunr/17/
This example should write "finished" on console.
A declarative, efficient, and flexible JavaScript library for building user interfaces.
🖖 Vue.js is a progressive, incrementally-adoptable JavaScript framework for building UI on the web.
TypeScript is a superset of JavaScript that compiles to clean JavaScript output.
An Open Source Machine Learning Framework for Everyone
The Web framework for perfectionists with deadlines.
A PHP framework for web artisans
Bring data to life with SVG, Canvas and HTML. 📊📈🎉
JavaScript (JS) is a lightweight interpreted programming language with first-class functions.
Some thing interesting about web. New door for the world.
A server is a program made to process requests and deliver data to clients.
Machine learning is a way of modeling and interpreting data that allows a piece of software to respond intelligently.
Some thing interesting about visualization, use data art
Some thing interesting about game, make everyone happy.
We are working to build community through open source technology. NB: members must have two-factor auth.
Open source projects and samples from Microsoft.
Google ❤️ Open Source for everyone.
Alibaba Open Source for everyone
Data-Driven Documents codes.
China tencent open source team.