pprof is a cpu profiler that can be easily integrated into a rust program.
![]()


First, get a guard to start profiling. Profiling will continue until this guard was dropped.
let guard = pprof::ProfilerGuardBuilder::default().frequency(1000).blocklist(&["libc", "libgcc", "pthread", "vdso"]).build().unwrap();During the profiling time, you can get a report with the guard.
if let Ok(report) = guard.report().build() {
    println!("report: {:?}", &report);
};
Debug was implemented for Report. It will print a human-readable stack counter report. Here is an example:
FRAME: backtrace::backtrace::trace::h3e91a3123a3049a5 -> FRAME: pprof::profiler::perf_signal_handler::h7b995c4ab2e66493 -> FRAME: Unknown -> FRAME: prime_number::is_prime_number::h70653a2633b88023 -> FRAME: prime_number::main::h47f1058543990c8b -> FRAME: std::rt::lang_start::{{closure}}::h4262e250f8024b06 -> FRAME: std::rt::lang_start_internal::{{closure}}::h812f70926ebbddd0 -> std::panicking::try::do_call::h3210e2ce6a68897b -> FRAME: __rust_maybe_catch_panic -> FRAME: std::panicking::try::h28c2e2ec1c3871ce -> std::panic::catch_unwind::h05e542185e35aabf -> std::rt::lang_start_internal::hd7efcfd33686f472 -> FRAME: main -> FRAME: __libc_start_main -> FRAME: _start -> FRAME: Unknown -> THREAD: prime_number 1217
FRAME: backtrace::backtrace::trace::h3e91a3123a3049a5 -> FRAME: pprof::profiler::perf_signal_handler::h7b995c4ab2e66493 -> FRAME: Unknown -> FRAME: alloc::alloc::box_free::h82cea48ed688e081 -> FRAME: prime_number::main::h47f1058543990c8b -> FRAME: std::rt::lang_start::{{closure}}::h4262e250f8024b06 -> FRAME: std::rt::lang_start_internal::{{closure}}::h812f70926ebbddd0 -> std::panicking::try::do_call::h3210e2ce6a68897b -> FRAME: __rust_maybe_catch_panic -> FRAME: std::panicking::try::h28c2e2ec1c3871ce -> std::panic::catch_unwind::h05e542185e35aabf -> std::rt::lang_start_internal::hd7efcfd33686f472 -> FRAME: main -> FRAME: __libc_start_main -> FRAME: _start -> FRAME: Unknown -> THREAD: prime_number 1
FRAME: backtrace::backtrace::trace::h3e91a3123a3049a5 -> FRAME: pprof::profiler::perf_signal_handler::h7b995c4ab2e66493 -> FRAME: Unknown -> FRAME: prime_number::main::h47f1058543990c8b -> FRAME: std::rt::lang_start::{{closure}}::h4262e250f8024b06 -> FRAME: std::rt::lang_start_internal::{{closure}}::h812f70926ebbddd0 -> std::panicking::try::do_call::h3210e2ce6a68897b -> FRAME: __rust_maybe_catch_panic -> FRAME: std::panicking::try::h28c2e2ec1c3871ce -> std::panic::catch_unwind::h05e542185e35aabf -> std::rt::lang_start_internal::hd7efcfd33686f472 -> FRAME: main -> FRAME: __libc_start_main -> FRAME: _start -> FRAME: Unknown -> THREAD: prime_number 1
cppenables the cpp demangle.flamegraphenables the flamegraph report format.prost-codecenables the pprof protobuf report format throughprost.protobuf-codecenables the pprof protobuf report format throughprotobufcrate.frame-pointergets the backtrace through frame pointer. only available for nightly
pprof = { version = "0.13", features = ["flamegraph"] }If flamegraph feature is enabled, you can generate flamegraph from the report. Report struct has a method flamegraph which can generate flamegraph and write it into a Write.
if let Ok(report) = guard.report().build() {
    let file = File::create("flamegraph.svg").unwrap();
    report.flamegraph(file).unwrap();
};
Additionally, custom flamegraph options can be specified.
if let Ok(report) = guard.report().build() {
    let file = File::create("flamegraph.svg").unwrap();
    let mut options = pprof::flamegraph::Options::default();
    options.image_width = Some(2500);
    report.flamegraph_with_options(file, &mut options).unwrap();
};
Here is an example of generated flamegraph:
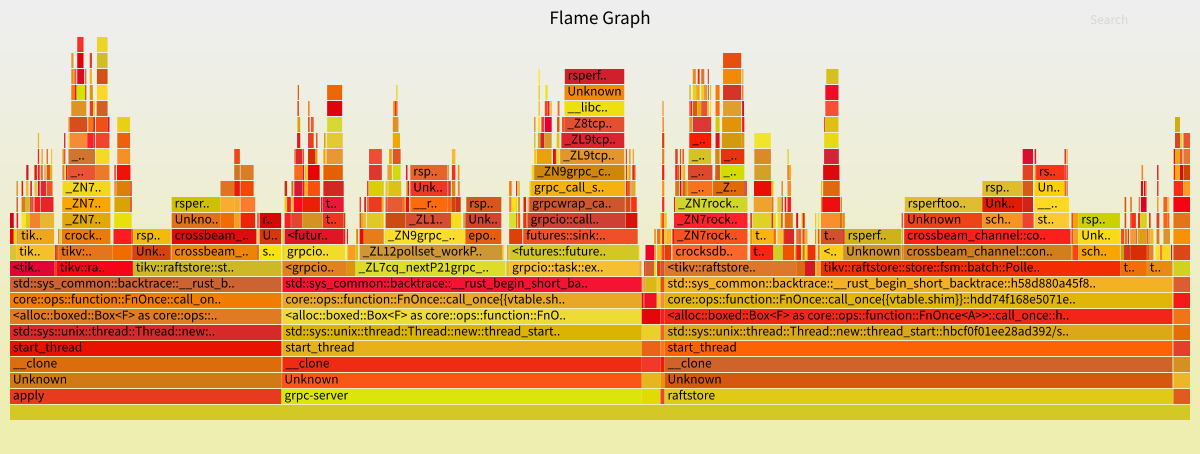
Before the report was generated, frame_post_processor was provided as an interface to modify raw statistic data. If you want to group several symbols/thread or demangle for some symbols, this feature will benefit you.
For example:
fn frames_post_processor() -> impl Fn(&mut pprof::Frames) {
    let thread_rename = [
        (Regex::new(r"^grpc-server-\d*$").unwrap(), "grpc-server"),
        (Regex::new(r"^cop-high\d*$").unwrap(), "cop-high"),
        (Regex::new(r"^cop-normal\d*$").unwrap(), "cop-normal"),
        (Regex::new(r"^cop-low\d*$").unwrap(), "cop-low"),
        (Regex::new(r"^raftstore-\d*$").unwrap(), "raftstore"),
        (Regex::new(r"^raftstore-\d*-\d*$").unwrap(), "raftstore"),
        (Regex::new(r"^sst-importer\d*$").unwrap(), "sst-importer"),
        (
            Regex::new(r"^store-read-low\d*$").unwrap(),
            "store-read-low",
        ),
        (Regex::new(r"^rocksdb:bg\d*$").unwrap(), "rocksdb:bg"),
        (Regex::new(r"^rocksdb:low\d*$").unwrap(), "rocksdb:low"),
        (Regex::new(r"^rocksdb:high\d*$").unwrap(), "rocksdb:high"),
        (Regex::new(r"^snap sender\d*$").unwrap(), "snap-sender"),
        (Regex::new(r"^snap-sender\d*$").unwrap(), "snap-sender"),
        (Regex::new(r"^apply-\d*$").unwrap(), "apply"),
        (Regex::new(r"^future-poller-\d*$").unwrap(), "future-poller"),
    ];

    move |frames| {
        for (regex, name) in thread_rename.iter() {
            if regex.is_match(&frames.thread_name) {
                frames.thread_name = name.to_string();
            }
        }
    }
}
if let Ok(report) = guard.frames_post_processor(frames_post_processor()).report().build() {
let file = File::create("flamegraph.svg").unwrap();
report.flamegraph(file).unwrap();
}With protobuf feature enabled, pprof-rs can also output profile.proto format.
match guard.report().build() {
Ok(report) => {
let mut file = File::create("profile.pb").unwrap();
let profile = report.pprof().unwrap();
let mut content = Vec::new();
profile.encode(&mut content).unwrap();
file.write_all(&content).unwrap();
println!("report: {}", &report);
}
Err(_) => {}
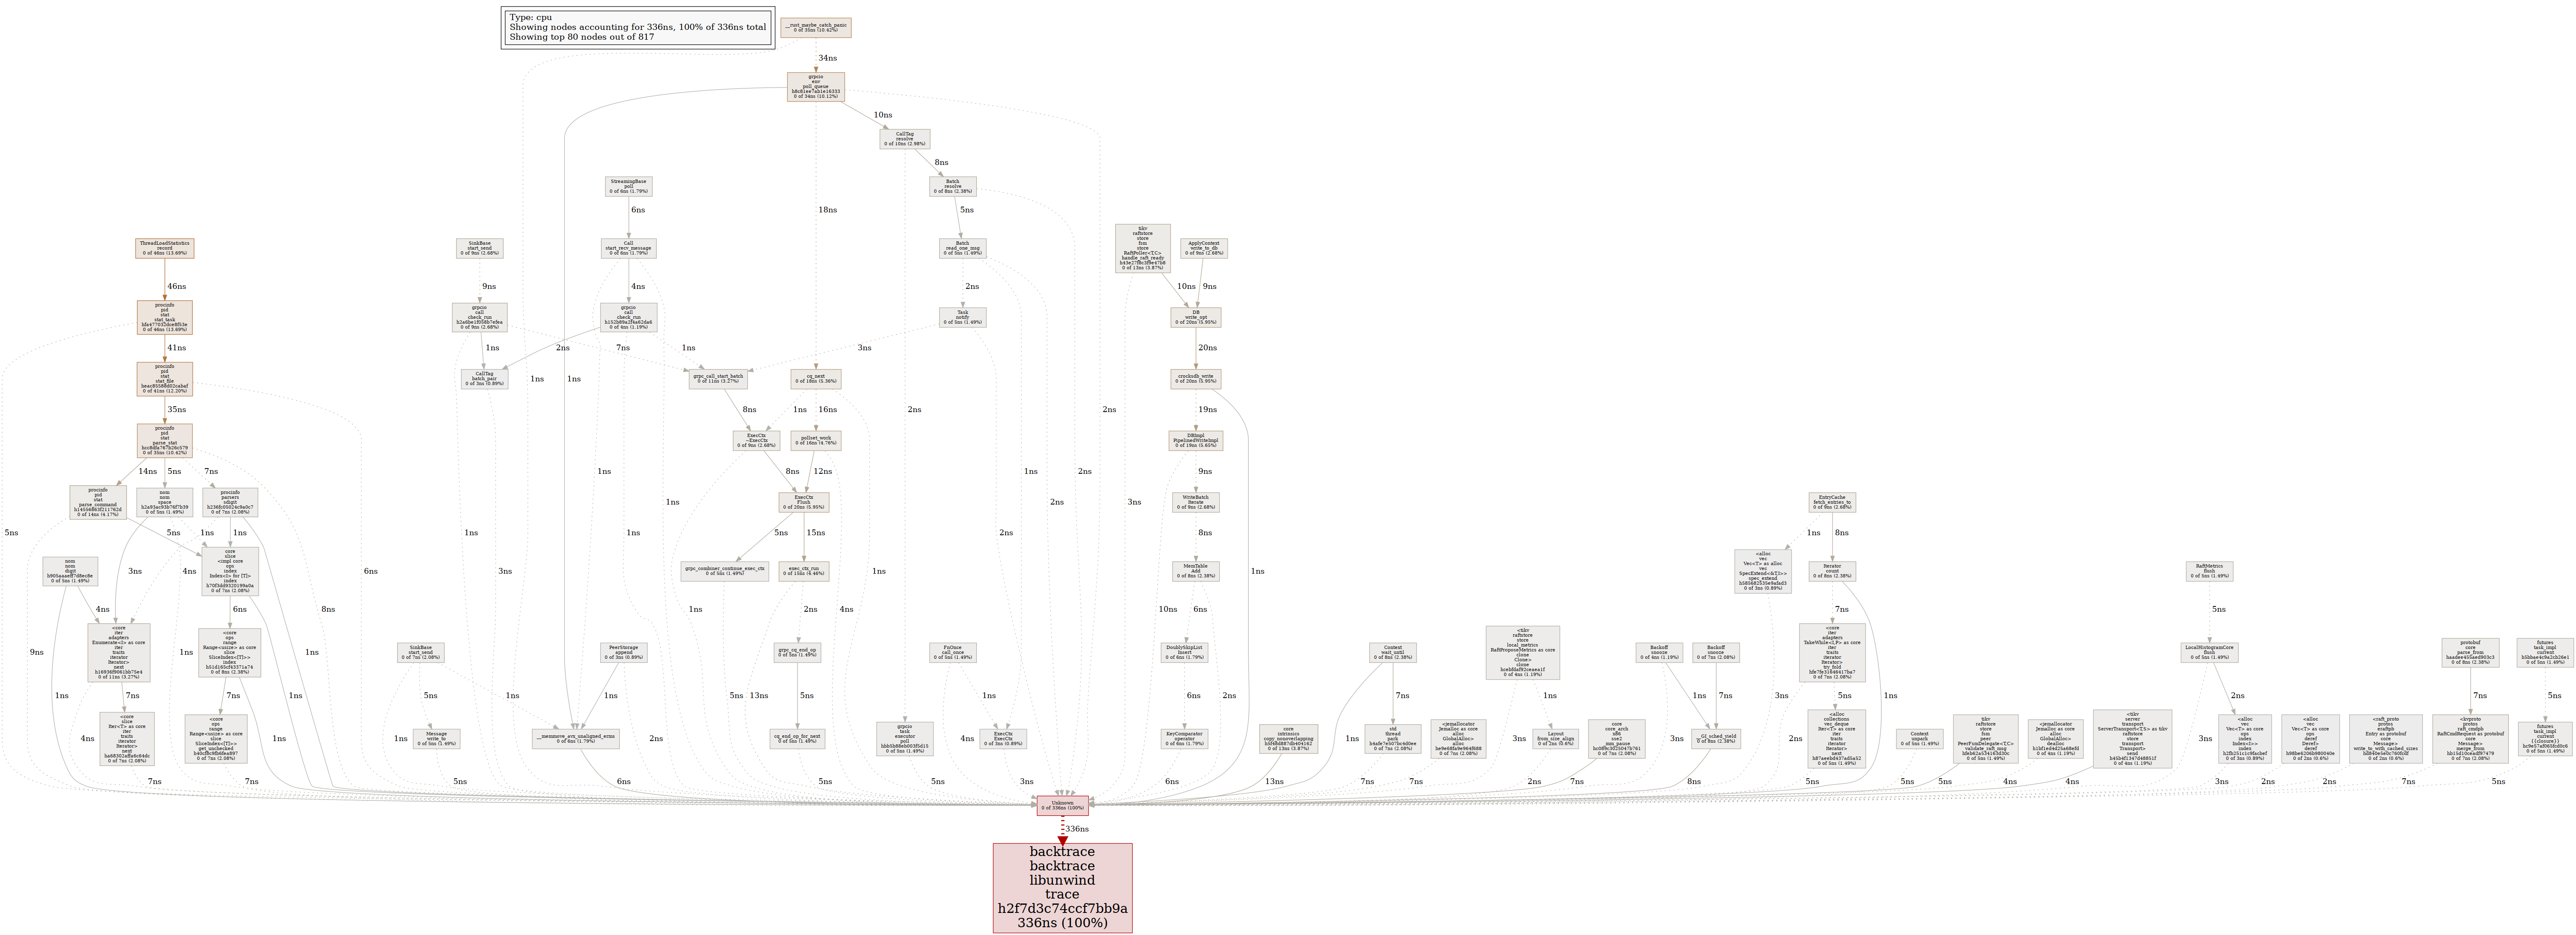
};Then you can use pprof command with profile.pb. For example:
~/go/bin/pprof -svg profile.pbThen pprof will generate a svg file according to the profile.
With criterion feature enabled, a criterion custom profiler is provided in pprof-rs.
use pprof::criterion::{PProfProfiler, Output};

criterion_group!{
    name = benches;
    config = Criterion::default().with_profiler(PProfProfiler::new(100, Output::Flamegraph(None)));
    targets = bench
}
criterion_main!(benches);
After running the benchmark, you can find the flamegraph at target/criterion/<name-of-benchmark>/profile/flamegraph.svg. protobuf output is also available with the Output::Protobuf option; these end up at target/criterion/<name-of-benchmark>/profile.pb.
For more details, you can check the examples/criterion.rs, and the profiling document of criterion. For a quick start, you can run this example with cargo run --example criterion --release --features="flamegraph criterion" -- --bench --profile-time 5
There have been tons of profilers, why we create a new one? Here we make a comparison between pprof-rs and other popular profilers to help you choose the best fit one.
gperftools is also an integrated profiler. There is also a wrapper for gperftools in rust called cpuprofiler which makes it programmable for a rust program.
pprof-rshas a modern build system and can be integrated into a rust program easily while compilinggperftoolsstatically is buggy.pprof-rshas a native rust interface whilegperftools's wrapper is just a wrapper.- Programming with rust guarantees thread safety natively.
gperftoolsis a collection of performance analysis tools which contains cpu profiler, heap profiler...pprof-rsfocuses on cpu profiler now.
perf is a performance analyzing tool in Linux.
- You don't need to start another process to perf with
pprof-rs. pprof-rscan be easily integrated with rust program which means you don't need to install any other programs.pprof-rshas a modern programmable interface to hack withpprof-rstheoretically supports all POSIX systems and can easily support more systems in the future.
perfis much more feature-rich thanpprof-rs.perfis highly integrated with Linux.
When profiling was started, setitimer system call was used to set up a timer which will send a SIGPROF to this program every constant interval.
When receiving a SIGPROF signal, the signal handler will capture a backtrace and increase the count of it. After a while, the profiler can get every possible backtrace and their count. Finally, we can generate a report with profiler data.
However, the real world is full of thorns. There are many worths of note parts in the implementation.
Unfortunately, there is no 100% robust stack tracing method. Some related researches have been done by gperftools. pprof-rs uses backtrace-rs which finally uses libunwind provided by libgcc
WARN: as described in former gperftools documents, libunwind provided by libgcc is not signal safe.
libgcc's unwind method is not safe to use from signal handlers. One particular cause of deadlock is when profiling tick happens when program is propagating thrown exception.
This can be resolved by adding a blocklist:
let guard = pprof::ProfilerGuardBuilder::default().frequency(1000).blocklist(&["libc", "libgcc", "pthread", "vdso"]).build().unwrap();The vdso should also be added to the blocklist, because in some distribution (e.g. ubuntu 18.04), the dwarf information in vdso is incorrect.
The pprof-rs also supports unwinding through frame pointer, without the need to use libunwind. However, the standard library shipped with the rust compiler does not have the correct frame pointer in every function, so you need to use cargo +nightly -Z build-std to build the standard library from source.
As we cannot get the stack boundaries inside the signal handler, it's also not possible to ensure the safety. If the frame pointer was set to a wrong value, the program will panic.
Signal safety is hard to guarantee. But it's not that hard.
First, we have to avoid deadlock. When profiler samples or reports, it will get a global lock on the profiler. Particularly, deadlock happenswhen the running program is getting a report from the profiler (which will hold the lock), at the same time, a SIGPROF signal is triggered and the profiler wants to sample (which will also hold the lock). So we don't wait for the lock in signal handler, instead we try_lock in the signal handler. If the global lock cannot be gotten, the profiler will give up directly.
Then, signal safety POSIX function is quite limited as listed here. The most bothering issue is that we cannot use malloc in signal handler. So we can only use pre-allocated memory in profiler. The simplest way is write every sample serially into a file. We optimized it with a fix-sized hashmap that has a fixed number of buckets and every bucket is an array with a fixed number of items. If the hashmap is full, we pop out the item with minimum count and write it into a temporary file.
Unit tests have been added to guarantee there is no malloc in sample functions.
futex is also not safe to use in signal handler. So we use a spin lock to avoid usage of futex.
- Restore the original SIGPROF handler after stopping the profiler.
Rust 1.64 or higher.
Minimum supported Rust version can be changed in the future, but it will be done with a minor version bump.


![dependabot[bot] avatar](https://avatars.githubusercontent.com/in/29110?v=4 "dependabot[bot]")