Coder Social home page Coder Social logo

schang412 / mpl-smithchart Goto Github PK

View Code? Open in Web Editor NEW

This project forked from vmeijin/pysmithplot

3.0 0.0 0.0 236 KB

Matplotlib extension for creating Smith charts with Python

License: BSD 3-Clause "New" or "Revised" License

Python 100.00%

mpl-smithchart's Introduction

mpl-smithchart

ci

This project is forked from pySmithPlot.

It adds/fixes the following:

  • CI/CD to facillitate package maintenance
  • addresses matplotlib deprecation warnings
  • updates numpy to newer version
  • fixes legend plotting
  • adds some automated testing of features
  • adds version lock file to show known-good build

Below this line is the old README.

New Release of Version 0.2

After 2 years of getting dusty pySmithPlot now got some new features and bug fixes. Here is a short changelog:

  • Support for Python 3
  • improved grid generation algorithm
  • plot() now also handles also single numbers and purely real data
  • plot() can now interpolate lines between points or generate an equidistant spacing
  • changed handling of input data and renormalization; now the actual datatype (S,Z,Y-Parameter) can be specified when calling plot()
  • changed behaviour for normalization and placement of the label
  • added some parameter checks
  • removed default matplotlib settings
  • renamed some parameters to improve consistency
  • fixed issues with Unicode symbols
  • fixed issues with grid generation
  • fixed issues with axis label display and placement

There are still some plans for the future and they hopefully don't take another two years:

  • support for Admittance Charts
  • support for contour() plots
  • zoom and 'cut out' function
  • special handling of other matplotlib.patch objects like arrows
  • ...

Features

pySmithPlot is a matplotlib extension providing a projection class for creating high quality Smith Charts with Python. The generated plots blend seamless into matplotlib's style and support almost the full range of customization options.

This Library allows the fully automatic generation of Smith Charts with various customizable parameters and well selected default values. It also provides the following modifications and extensions:

  • circle shaped drawing area with labels placed around
  • plot() accepts real and complex numbers as well as numpy.ndarray's
  • lines can be automatically interpolated to improve the optical appearance
  • data ranges can be interpolated to an equidistant spacing
  • start/end markers of lines can be modified and rotate tangential
  • gridlines are 3-point arcs to improve space efficiency of exported plots
  • 'fancy' option for adaptive grid generation
  • own tick locators for nice axis labels

For making a Smith Chart plot, it is sufficient to import smithplot and create a new subplot with projection set to 'smith'. (Requires matplotlib version 1.2)

A short example can be found in the testbenches directory and started with:

python3 smith_short_test.py

For more details and documentation, take a look into smithplot/smithaxes.py.

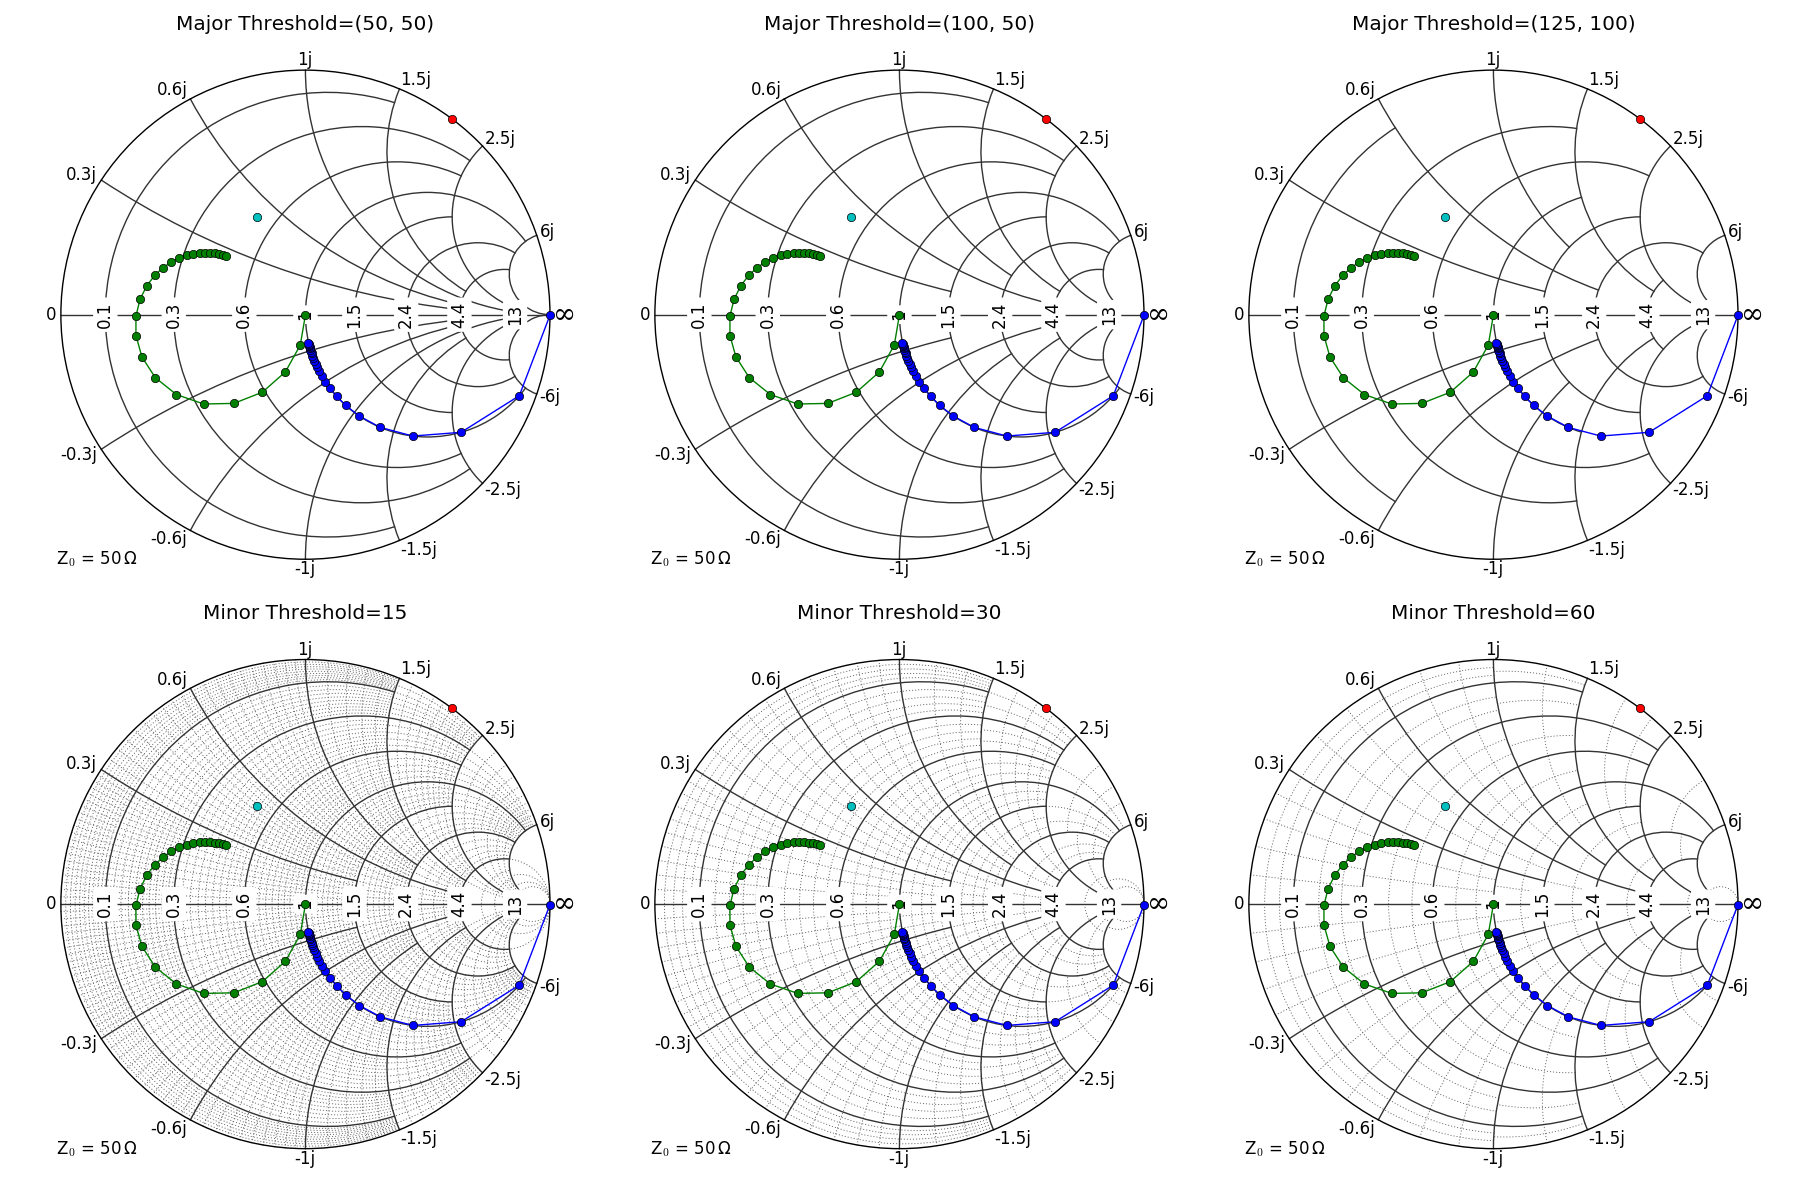
testbenches/smith_full_test.py runs various testbenches and gives a comparison for almost all parameters. These are the generated sample plots:

Grid Styles Grid Styles - PDF

Fancy Threshold Fancy Threshold - PDF

Grid Locators Grid Locators - PDF

Marker Modification Marker Modification - PDF

Interpolation Interpolation - PDF

Normalize Normalize - PDF

Miscellaneous Miscellaneous - PDF

mpl-smithchart's People

Contributors

schang412 avatar vmeijin avatar rpcope1 avatar

Stargazers

Arthur Adriaens avatar Felipe Baltor avatar  avatar

mpl-smithchart's Issues

Is there a way to use ipympl to zoom and manipulate the graph?

I am trying to utilize ipympl to manipulate my plots in jupyterlab but there seems to be something in the module that blocks interaction.

Is there a way to allow ipympl to interact with the plot?

Otherwise everything encountered so far seems to work correctly.

Recommend Projects

  • React photo React

    A declarative, efficient, and flexible JavaScript library for building user interfaces.

  • Vue.js photo Vue.js

    ๐Ÿ–– Vue.js is a progressive, incrementally-adoptable JavaScript framework for building UI on the web.

  • Typescript photo Typescript

    TypeScript is a superset of JavaScript that compiles to clean JavaScript output.

  • TensorFlow photo TensorFlow

    An Open Source Machine Learning Framework for Everyone

  • Django photo Django

    The Web framework for perfectionists with deadlines.

  • D3 photo D3

    Bring data to life with SVG, Canvas and HTML. ๐Ÿ“Š๐Ÿ“ˆ๐ŸŽ‰

Recommend Topics

  • javascript

    JavaScript (JS) is a lightweight interpreted programming language with first-class functions.

  • web

    Some thing interesting about web. New door for the world.

  • server

    A server is a program made to process requests and deliver data to clients.

  • Machine learning

    Machine learning is a way of modeling and interpreting data that allows a piece of software to respond intelligently.

  • Game

    Some thing interesting about game, make everyone happy.

Recommend Org

  • Facebook photo Facebook

    We are working to build community through open source technology. NB: members must have two-factor auth.

  • Microsoft photo Microsoft

    Open source projects and samples from Microsoft.

  • Google photo Google

    Google โค๏ธ Open Source for everyone.

  • D3 photo D3

    Data-Driven Documents codes.