Coder Social home page Coder Social logo

pysmithplot's Introduction

pySmithPlot

New Release of Version 0.2

After 2 years of getting dusty pySmithPlot now got some new features and bug fixes. Here is a short changelog:

  • Support for Python 3
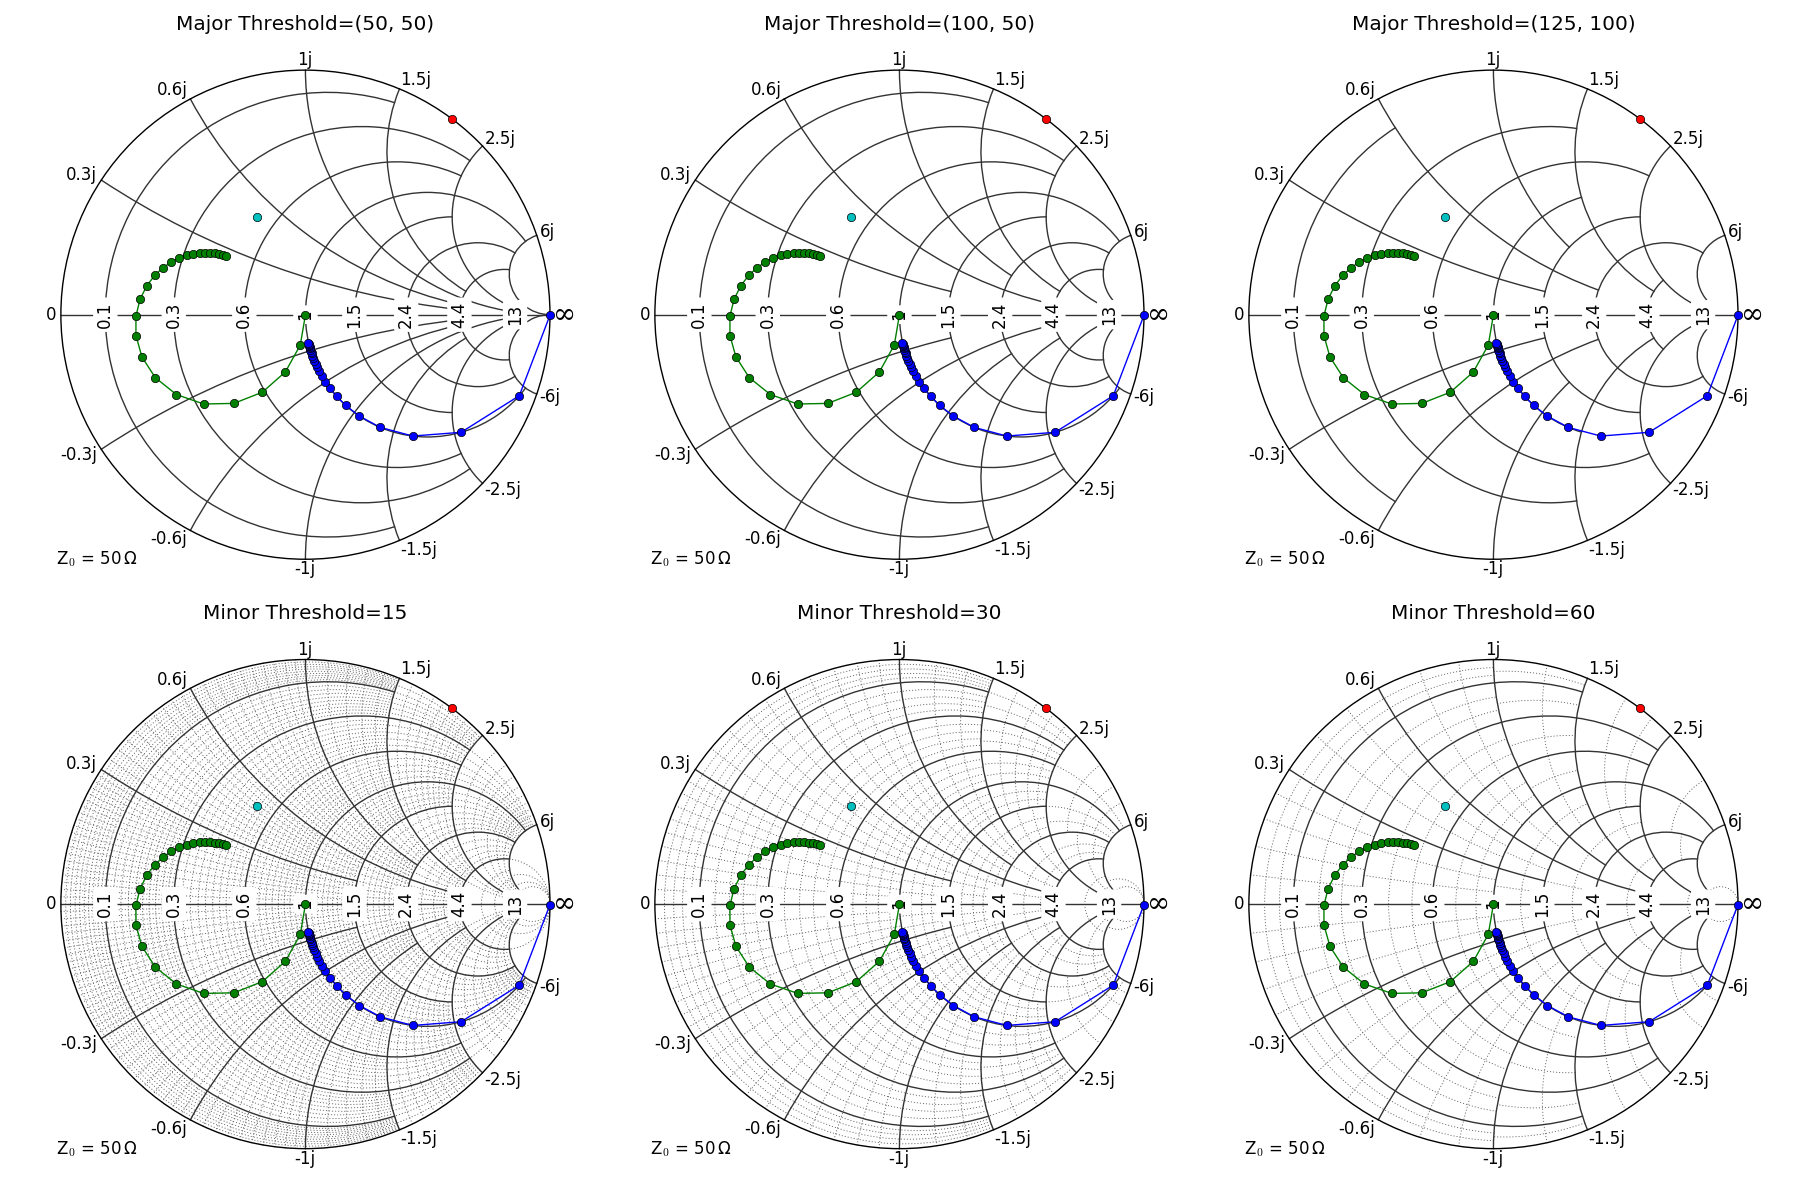
  • improved grid generation algorithm
  • plot() now also handles also single numbers and purely real data
  • plot() can now interpolate lines between points or generate an equidistant spacing
  • changed handling of input data and renormalization; now the actual datatype (S,Z,Y-Parameter) can be specified when calling plot()
  • changed behaviour for normalization and placement of the label
  • added some parameter checks
  • removed default matplotlib settings
  • renamed some parameters to improve consistency
  • fixed issues with Unicode symbols
  • fixed issues with grid generation
  • fixed issues with axis label display and placement

There are still some plans for the future and they hopefully don't take another two years:

  • support for Admittance Charts
  • support for contour() plots
  • zoom and 'cut out' function
  • special handling of other matplotlib.patch objects like arrows
  • ...

Features

pySmithPlot is a matplotlib extension providing a projection class for creating high quality Smith Charts with Python. The generated plots blend seamless into matplotlib's style and support almost the full range of customization options.

This Library allows the fully automatic generation of Smith Charts with various customizable parameters and well selected default values. It also provides the following modifications and extensions:

  • circle shaped drawing area with labels placed around
  • plot() accepts real and complex numbers as well as numpy.ndarray's
  • lines can be automatically interpolated to improve the optical appearance
  • data ranges can be interpolated to an equidistant spacing
  • start/end markers of lines can be modified and rotate tangential
  • gridlines are 3-point arcs to improve space efficiency of exported plots
  • 'fancy' option for adaptive grid generation
  • own tick locators for nice axis labels

For making a Smith Chart plot, it is sufficient to import smithplot and create a new subplot with projection set to 'smith'. (Requires matplotlib version 1.2)

A short example can be found in the testbenches directory and started with:

python3 smith_short_test.py

For more details and documentation, take a look into smithplot/smithaxes.py.

testbenches/smith_full_test.py runs various testbenches and gives a comparison for almost all parameters. These are the generated sample plots:

Grid Styles Grid Styles - PDF

Fancy Threshold Fancy Threshold - PDF

Grid Locators Grid Locators - PDF

Marker Modification Marker Modification - PDF

Interpolation Interpolation - PDF

Normalize Normalize - PDF

Miscellaneous Miscellaneous - PDF

pysmithplot's People

Contributors

rpcope1 avatar vmeijin avatar

Stargazers

 avatar  avatar  avatar  avatar  avatar  avatar  avatar  avatar  avatar  avatar  avatar  avatar  avatar  avatar  avatar  avatar  avatar  avatar  avatar  avatar  avatar  avatar  avatar  avatar  avatar  avatar  avatar  avatar  avatar  avatar  avatar  avatar  avatar  avatar  avatar  avatar  avatar  avatar  avatar  avatar  avatar  avatar  avatar  avatar  avatar  avatar  avatar  avatar  avatar  avatar  avatar  avatar  avatar  avatar  avatar  avatar  avatar  avatar  avatar  avatar  avatar  avatar  avatar  avatar  avatar  avatar  avatar  avatar  avatar  avatar  avatar  avatar  avatar  avatar  avatar  avatar  avatar  avatar  avatar  avatar  avatar  avatar  avatar  avatar  avatar  avatar  avatar  avatar  avatar  avatar  avatar  avatar  avatar  avatar  avatar  avatar  avatar  avatar  avatar  avatar

Watchers

 avatar  avatar  avatar  avatar  avatar  avatar  avatar  avatar  avatar  avatar  avatar  avatar  avatar  avatar  avatar  avatar  avatar  avatar  avatar  avatar  avatar

pysmithplot's Issues

type error when calling projection=smith

Using matplotlib 3.2 as well as with trying 1.2, which is recommended in the guideline, I have an "object of type <class 'numpy.float64'> cannot be safely interpreted as an integer" error I don't know why no one has reported it so far.

lt.figure(1, figsize=(4,4), facecolor='w')
ax = plt.subplot('111', projection='smith', plot_marker_default=None, axes_normalize_label=False) in this line I get type error below.

TypeError                                 Traceback (most recent call last)
~\Anaconda3\lib\site-packages\numpy\core\function_base.py in linspace(start, stop, num, endpoint, retstep, dtype, axis)
    116     try:
--> 117         num = operator.index(num)
    118     except TypeError:

TypeError: 'numpy.float64' object cannot be interpreted as an integer

During handling of the above exception, another exception occurred:

TypeError                                 Traceback (most recent call last)
<ipython-input-10-2f840a3fb238> in <module>
     34 
     35 plt.figure(1, figsize=(4,4), facecolor='w')
---> 36 ax = plt.subplot('111', projection='smith', plot_marker_default=None, axes_normalize_label=False)
     37 #axes_normalize=True, axes_impedance=50, axes_normalize_label=True
     38 

~\AppData\Roaming\Python\Python37\site-packages\matplotlib\pyplot.py in subplot(*args, **kwargs)
   1028 
   1029     fig = gcf()
-> 1030     a = fig.add_subplot(*args, **kwargs)
   1031     bbox = a.bbox
   1032     byebye = []

~\AppData\Roaming\Python\Python37\site-packages\matplotlib\figure.py in add_subplot(self, *args, **kwargs)
   1417                     self._axstack.remove(ax)
   1418 
-> 1419             a = subplot_class_factory(projection_class)(self, *args, **kwargs)
   1420 
   1421         return self._add_axes_internal(key, a)

~\AppData\Roaming\Python\Python37\site-packages\matplotlib\axes\_subplots.py in __init__(self, fig, *args, **kwargs)
     74 
     75         # _axes_class is set in the subplot_class_factory
---> 76         self._axes_class.__init__(self, fig, self.figbox, **kwargs)
     77         # add a layout box to this, for both the full axis, and the poss
     78         # of the axis.  We need both because the axes may become smaller

~\Anaconda3\lib\site-packages\smithplot\smithaxes.py in __init__(self, *args, **kwargs)
    372 
    373         # seperate Axes parameter
--> 374         Axes.__init__(self, *args, **SmithAxes.update_scParams(instance=self, filter_dict=True, reset=False, **kwargs))
    375         self.set_aspect(1, adjustable='box', anchor='C')
    376 

~\AppData\Roaming\Python\Python37\site-packages\matplotlib\axes\_base.py in __init__(self, fig, rect, facecolor, frameon, sharex, sharey, label, xscale, yscale, **kwargs)
    452 
    453         self._rasterization_zorder = None
--> 454         self.cla()
    455 
    456         # funcs used to format x and y - fall back on major formatters

~\Anaconda3\lib\site-packages\smithplot\smithaxes.py in cla(self)
    475 
    476         for grid in ['major', "minor"]:
--> 477             self.grid(b=self._get_key("grid.%s.enable" % grid), which=grid)
    478 
    479     def _set_lim_and_transforms(self):

~\Anaconda3\lib\site-packages\smithplot\smithaxes.py in grid(self, b, which, fancy, dividers, threshold, **kwargs)
   1062                             x_div, y_div = d_mat[i, k]
   1063 
-> 1064                             for xs in np.linspace(x0, x1, x_div + 1)[1:]:
   1065                                 x_lines.append([xs, y0, y1])
   1066                                 x_lines.append([xs, -y1, -y0])

<__array_function__ internals> in linspace(*args, **kwargs)

~\Anaconda3\lib\site-packages\numpy\core\function_base.py in linspace(start, stop, num, endpoint, retstep, dtype, axis)
    119         raise TypeError(
    120             "object of type {} cannot be safely interpreted as an integer."
--> 121                 .format(type(num)))
    122 
    123     if num < 0:

TypeError: object of type <class 'numpy.float64'> cannot be safely interpreted as an integer.

path_interpolation=0 does not work

plot with the option path_interpolation=0 results in a number of steps of zero which does not work and causes the error trace below

ValueError Traceback (most recent call last)
in ()
266
267 for proc in r:
--> 268 proc.get()
269 else:
270 # make_grids_on()

/usr/local/Cellar/python/2.7.5/Frameworks/Python.framework/Versions/2.7/lib/python2.7/multiprocessing/pool.pyc in get(self, timeout)
552 return self._value
553 else:
--> 554 raise self._value
555
556 def _set(self, i, obj):

ValueError: slice step cannot be zero

Python3.4 support?

Hi,
Does your software support Python 3.x? I seem to have errors when I try to use it with Python 3.4.
Thanks,
Phil

Cannot import name 'update_scParams'

I have this error:

mikek@mike-M6700:~/Documents/Mike_Play_Learn/SDR_Radio/pyLMS7002M/examples/VNA$ python3 calculateVNA.py r50 save
Traceback (most recent call last):
File "calculateVNA.py", line 29, in
from smithplot.smithaxes import update_scParams
ImportError: cannot import name 'update_scParams'

After running this example.
https://github.com/myriadrf/pyLMS7002M/blob/master/examples/VNA/calculateVNA.py

Also had trouble with python versions, 2.7 or 3.
I did do a Python3 ./setup.py install

Thanks.
MikeK

Always draw arrow on last point

Currently, the number of data points must be a multiple of mark every+1, for the end arrow to end up at the end of the curve.

It would be nice if this worked for arbitrary numbers of points.

Intall pysmithplot

I download pySmithPlot-master and I used pip install pysmithplot and that didn't install pysmithplot... I have matplotlib >1.2 and the numpy lib... What is the problem? Help please

TypeError when calling np.linespace in in smithies.py grid()

Using NumPy 1.18.4 and Matplotlib 3.2.1. Python version is 3.8.3. Mac OS X Catalina although I doubt this issue is platform dependent.

This looks like the derived value for num, using x_div+1, causes the error, likely because x_div is a float. NumPy is probably no longer doing an automatic type conversion. Anyhow, that's an assumption at this point.

~/fusion/prod/lib/python3.8/site-packages/smithplot/smithaxes.py in cla(self)
    475 
    476         for grid in ['major', "minor"]:
--> 477             self.grid(b=self._get_key("grid.%s.enable" % grid), which=grid)
    478 
    479     def _set_lim_and_transforms(self):

~/fusion/prod/lib/python3.8/site-packages/smithplot/smithaxes.py in grid(self, b, which, fancy, dividers, threshold, **kwargs)
   1062                             x_div, y_div = d_mat[i, k]
   1063 
-> 1064                             for xs in np.linspace(x0, x1, x_div + 1)[1:]:
   1065                                 x_lines.append([xs, y0, y1])
   1066                                 x_lines.append([xs, -y1, -y0])

<__array_function__ internals> in linspace(*args, **kwargs)

~/fusion/prod/lib/python3.8/site-packages/numpy-1.18.4-py3.8-macosx-10.15-x86_64.egg/numpy/core/function_base.py in linspace(start, stop, num, endpoint, retstep, dtype, axis)
    117         num = operator.index(num)
    118     except TypeError:
--> 119         raise TypeError(
    120             "object of type {} cannot be safely interpreted as an integer."
    121                 .format(type(num)))

TypeError: object of type <class 'numpy.float64'> cannot be safely interpreted as an integer.

Cannot create legend

I am getting an error when trying to create a legend. I modified smithaxes.py as follows:

Before it had:
from matplotlib.legend_handler import HandlerLine2D

I changed this to:
from matplotlib.legend_handler import HandlerLine2DCompound as HandlerLine2D

This seems to have resolved it.

License?

Can this library be used and if so what license may it be used under?

I note your setup.py says 'BSD' but this isn't noted in your repository.

Kind regards

Joni

Package for PyPI

This is by no means critical, but having a PyPI package for pySmithPlot would be convenient.

Crash with Matplotlib 3.2.1

I personally find this package super useful. If I can help keep it alive please let me know. Here's a crash with the latest Matplotlib release. Hopefully the fix is quick and easy!

if i==j: self.axes.append(self.fig.add_subplot(n,n,1+i*2+j, projection='smith'))
File "/Users/chrisgmorton/fusion/prod/lib/python3.8/site-packages/matplotlib/figure.py", line 1401, in add_subplot
self._process_projection_requirements(*args, **kwargs)
File "/Users/chrisgmorton/fusion/prod/lib/python3.8/site-packages/matplotlib/figure.py", line 1118, in _process_projection_requirements
projection_class = projections.get_projection_class(projection)
File "/Users/chrisgmorton/fusion/prod/lib/python3.8/site-packages/matplotlib/projections/init.py", line 56, in get_projection_class
raise ValueError("Unknown projection %r" % projection)
ValueError: Unknown projection 'smith'

AttributeError: 'YTick' object has no attribute 'label'

while running smith_short_test.py , saw the following error :

Traceback (most recent call last):
File "/Users/mayank/Downloads/pySmithPlot-master/testbenches/smith_short_test.py", line 23, in
ax = pp.subplot(1, 1, 1, projection='smith')
File "/Users/mayank/Downloads/Sinope_FR1/Dashboard/pySmithPlot-master/.venv/lib/python3.9/site-packages/matplotlib/pyplot.py", line 1437, in subplot
ax = fig.add_subplot(*args, **kwargs)
File "/Users/mayank/Downloads/Sinope_FR1/Dashboard/pySmithPlot-master/.venv/lib/python3.9/site-packages/matplotlib/figure.py", line 782, in add_subplot
ax = projection_class(self, *args, **pkw)
File "/Users/mayank/Downloads/pySmithPlot-master/smithplot/smithaxes.py", line 374, in init
Axes.init(self, *args, **SmithAxes.update_scParams(instance=self, filter_dict=True, reset=False, **kwargs))
File "/Users/mayank/Downloads/Sinope_FR1/Dashboard/pySmithPlot-master/.venv/lib/python3.9/site-packages/matplotlib/axes/_base.py", line 678, in init
self.clear()
File "/Users/mayank/Downloads/Sinope_FR1/Dashboard/pySmithPlot-master/.venv/lib/python3.9/site-packages/matplotlib/axes/_base.py", line 1386, in clear
self.cla()
File "/Users/mayank/Downloads/pySmithPlot-master/smithplot/smithaxes.py", line 420, in cla
Axes.cla(self)
File "/Users/mayank/Downloads/Sinope_FR1/Dashboard/pySmithPlot-master/.venv/lib/python3.9/site-packages/matplotlib/axes/_base.py", line 1395, in cla
self.__clear()
File "/Users/mayank/Downloads/Sinope_FR1/Dashboard/pySmithPlot-master/.venv/lib/python3.9/site-packages/matplotlib/axes/_base.py", line 1356, in __clear
self.yaxis.set_clip_path(self.patch)
File "/Users/mayank/Downloads/Sinope_FR1/Dashboard/pySmithPlot-master/.venv/lib/python3.9/site-packages/matplotlib/_api/deprecation.py", line 297, in wrapper
return func(*args, **kwargs)
File "/Users/mayank/Downloads/Sinope_FR1/Dashboard/pySmithPlot-master/.venv/lib/python3.9/site-packages/matplotlib/axis.py", line 1111, in set_clip_path
for child in self.majorTicks + self.minorTicks:
File "/Users/mayank/Downloads/Sinope_FR1/Dashboard/pySmithPlot-master/.venv/lib/python3.9/site-packages/matplotlib/axis.py", line 591, in get
tick = instance._get_tick(major=False)
File "/Users/mayank/Downloads/Sinope_FR1/Dashboard/pySmithPlot-master/.venv/lib/python3.9/site-packages/matplotlib/axis.py", line 1562, in _get_tick
return self._tick_class(self.axes, 0, major=major, **tick_kw)
File "/Users/mayank/Downloads/Sinope_FR1/Dashboard/pySmithPlot-master/.venv/lib/python3.9/site-packages/matplotlib/axis.py", line 480, in init
trans, va, ha = self._get_text1_transform()
File "/Users/mayank/Downloads/Sinope_FR1/Dashboard/pySmithPlot-master/.venv/lib/python3.9/site-packages/matplotlib/axis.py", line 492, in _get_text1_transform
return self.axes.get_yaxis_text1_transform(self._pad)
File "/Users/mayank/Downloads/pySmithPlot-master/smithplot/smithaxes.py", line 510, in get_yaxis_text1_transform
font_size = self.yaxis.majorTicks[0].label.get_size()
AttributeError: 'YTick' object has no attribute 'label'

Unknown property plot_hacklines

Hello.
I experienced issue #15 and commented out the 'update_scParams' import statement.
Running again the same program I got the following error message:

Traceback (most recent call last):
  File "calculateVNA.py", line 159, in <module>
    grid_minor_fancy=True, plot_hacklines=True)
  File "C:\ProgramData\Anaconda3\lib\site-packages\matplotlib\pyplot.py", line 1072, in subplot
    a = fig.add_subplot(*args, **kwargs)
  File "C:\ProgramData\Anaconda3\lib\site-packages\matplotlib\figure.py", line 1239, in add_subplot
    a = subplot_class_factory(projection_class)(self, *args, **kwargs)
  File "C:\ProgramData\Anaconda3\lib\site-packages\matplotlib\axes\_subplots.py", line 77, in __init__
    self._axes_class.__init__(self, fig, self.figbox, **kwargs)
  File "C:\ProgramData\Anaconda3\lib\site-packages\pysmithplot-0.2.0-py3.6.egg\smithplot\smithaxes.py", line 374, in __init__
  File "C:\ProgramData\Anaconda3\lib\site-packages\matplotlib\axes\_base.py", line 539, in __init__
    self.update(kwargs)
  File "C:\ProgramData\Anaconda3\lib\site-packages\matplotlib\artist.py", line 888, in update
    for k, v in props.items()]
  File "C:\ProgramData\Anaconda3\lib\site-packages\matplotlib\artist.py", line 888, in <listcomp>
    for k, v in props.items()]
  File "C:\ProgramData\Anaconda3\lib\site-packages\matplotlib\artist.py", line 881, in _update_property
    raise AttributeError('Unknown property %s' % k)
AttributeError: Unknown property plot_hacklines

At the moment, I removed the ,plot_hacklines=True parameter from the subplot statement in order to reach the end of program.

This happened on Windows 8.1, using Anaconda 3 and Python version 3.6.5

question on clearing axis (ax.clear())

I am noticing the following warning messages when I clear data from a Smith chart plot using ax.clear().
/usr/local/lib/python3.4/dist-packages/smithplot/smithaxes.py:1060: DeprecationWarning: object of type <class 'numpy.float64'> cannot be safely interpreted as an integer.
for xs in np.linspace(x0, x1, x_div + 1)[1:]:
/usr/local/lib/python3.4/dist-packages/smithplot/smithaxes.py:1064: DeprecationWarning: object of type <class 'numpy.float64'> cannot be safely interpreted as an integer.
for ys in np.linspace(y0, y1, y_div + 1)[1:]:
#####################################################################################################################

My code follows below and removing the ax.clear() removed the above warning messages.
replacing ax.clear() with ax.cla() gave the same results.
#############################################################

plot points and/or curves on Smith Chart

def plot_smith(data,canvas=None,figure=None,datatype="reflection",plottype="points",title="",interpolate=0,pointsonly=True):
Z0=50.
if canvas==None or figure==None: raise ValueError("ERROR! One of canvas or figure missing")
if datatype.lower()=="reflection" or datatype.lower()=="r": datatype=SmithAxes.S_PARAMETER
elif datatype.lower()=="impedance" or datatype.lower()=="z": datatype=SmithAxes.Z_PARAMETER
elif datatype.lower()=="admittance" or datatype.lower()=="y": datatype=SmithAxes.Y_PARAMETER
#fig=FigureCanvas(figure=plt.figure(1,figsize=(8,8),frameon=False))
ax = plt.subplot(1, 1, 1, projection='smith')
ax.clear()
if title!="": ax.set_title(title)
data=np.multiply(Z0,data)
if len(data)>0:
if datatype==SmithAxes.Z_PARAMETER:
if pointsonly: # plot data as single points
for d in data:
ax.plot(d,interpolate=0,datatype=datatype)
else: # plot a line
ax.plot(np.multiply(Z0,data),interpolate=interpolate,datatype=datatype)
elif datatype==SmithAxes.S_PARAMETER:
if pointsonly: # plot data as single points
for d in data:
ax.plot(d,interpolate=0,datatype=datatype)
else:
ax.plot(data,interpolate=interpolate,datatype=datatype)
#ax.hold(False)
canvas.draw()

#####################################################################################################################

if I remove the ax.clear() line

It's not working in my system.

I am using python3.3 and the error will show up as ' expection in Tkinder callback'.
Inside the function :Transform_path_non_affine
x,y= np.array(zip(*vertices)
Type error iteration over 0-d array.

Is there any design document here? It is hard to understand the coding.

Zoom and Pan

Are the matplotlib zoom and pan functions supported? The plots don't seem to respond, and from smithaxes.py lines 548-559 there look to be some comments and partial functions for pan and/or zoom.

Support for Python 3.10

This is by far the best smith chart plotting solution. Please add support for Python 3.10

Python 3.10 deprecated Iterable from collections (they moved it to collection.abc)

replacing collections with collection.abc is doesn't quite fix it though - it results in a different error

image

cannot import name 'Iterable' from 'collections'

I got following error: cannot import name 'Iterable' from 'collections'
It occurs when trying to import smithplot whilst using python 3.10.4 on the arch based linux distro 'Garuda Linux'.

The cause of this error:
Apparently the 'collections' module once contained the 'collections.abc' module that provides abstract base classes such as 'Iterable'. This was the case prior to python version 3.3. See https://docs.python.org/3/library/collections.abc.html

To fix this you need to replace
line 39 ('from collections import Iterable') in smithaxes.py with 'from collections.abc import Iterable' AND
line 4 ('from collections import Iterable') in smithhelper.py with 'from collections.abc import Iterable'

not working with Python2.7

Hi,

thanks for the update, but it is not working with Python2.7 (tested with Ubuntu and CentOs). The problem is with the arguments of member functions "_moebius_z" and "_moebius_inv_z" where the parameter "normalize" follows "*args" which seems to cause the problem with Python2.7.

Also, if using with Python3, one of the examples is not working due the special character \Omega...

Thanks,

Rainer

Convert purely real input to complex

When plotting a simple point, I noticed that passing a purely real number bugs. The first point ends up at 2.5 (OK), the second point at 2.5j (NOK). MWE:

import sys
sys.path.append("pySmithPlot")

from matplotlib import pyplot
import smithplot

axes = pyplot.subplot(1, 1, 1, projection='smith', axes_norm=1.0)
pyplot.plot(2.5+0j, markevery=5, label='2.5+0j')
pyplot.plot(2.5, markevery=5, label='2.5')
pyplot.legend()
pyplot.show()

purely_real_argument

Recommend Projects

  • React photo React

    A declarative, efficient, and flexible JavaScript library for building user interfaces.

  • Vue.js photo Vue.js

    ๐Ÿ–– Vue.js is a progressive, incrementally-adoptable JavaScript framework for building UI on the web.

  • Typescript photo Typescript

    TypeScript is a superset of JavaScript that compiles to clean JavaScript output.

  • TensorFlow photo TensorFlow

    An Open Source Machine Learning Framework for Everyone

  • Django photo Django

    The Web framework for perfectionists with deadlines.

  • D3 photo D3

    Bring data to life with SVG, Canvas and HTML. ๐Ÿ“Š๐Ÿ“ˆ๐ŸŽ‰

Recommend Topics

  • javascript

    JavaScript (JS) is a lightweight interpreted programming language with first-class functions.

  • web

    Some thing interesting about web. New door for the world.

  • server

    A server is a program made to process requests and deliver data to clients.

  • Machine learning

    Machine learning is a way of modeling and interpreting data that allows a piece of software to respond intelligently.

  • Game

    Some thing interesting about game, make everyone happy.

Recommend Org

  • Facebook photo Facebook

    We are working to build community through open source technology. NB: members must have two-factor auth.

  • Microsoft photo Microsoft

    Open source projects and samples from Microsoft.

  • Google photo Google

    Google โค๏ธ Open Source for everyone.

  • D3 photo D3

    Data-Driven Documents codes.