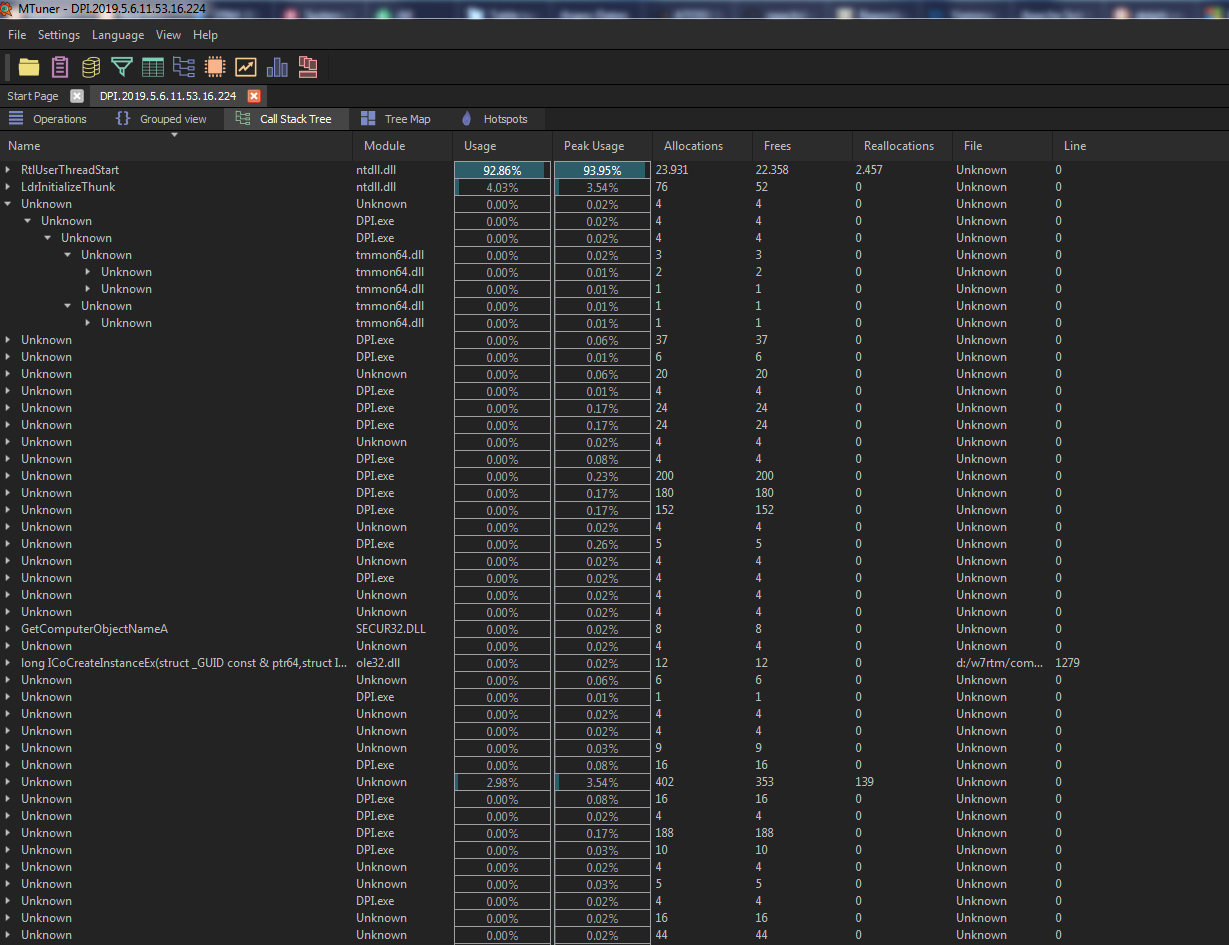
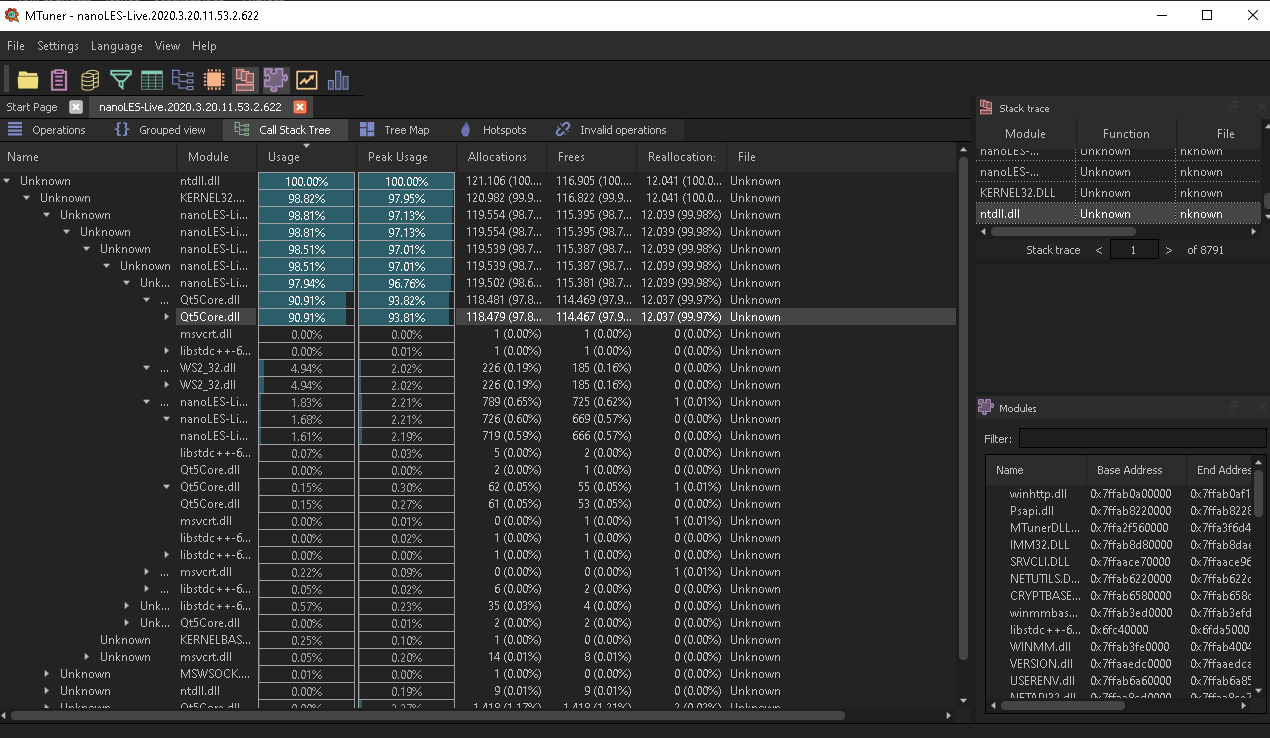
MTuner is a C/C++ memory profiler and memory leak finder for Windows, PlayStation 4 and 3, Android and other platforms.
MTuner utilizes a novel approach to memory profiling and analysis, keeping entire time-based history of memory operations. This gives an unique insight in memory related behavior of your software by making queries over the entire data set.
While MTuner was created for profiling C/C++ applications, it is possible to profile memory for programs written in other languages as long as there is corresponding debug symbol information. Users can convert DMD CodeView/DWARF debug symbols to PDB format using cv2pdb.

You can get the latest source code by cloning it from github:
git clone https://github.com/RudjiGames/MTuner.git
After cloning, we need to download dependencies:
git submodule init
git submodule update
Binaries can be downloaded from releases page
NB: If your application crashes while being profiled with MTuner, you can try adding MTuner folder to 'Exclusions' list under 'Virus & threat protection settings'
MTuner documentation can be found here.
MTuner uses Qt framework for user interface so it needs to be installed on the build machine. The build system is based on GENie and build in order to dramatically simplify managing build configurations and dependencies.
After cloning the repository and dependencies, here are the steps to build MTuner.
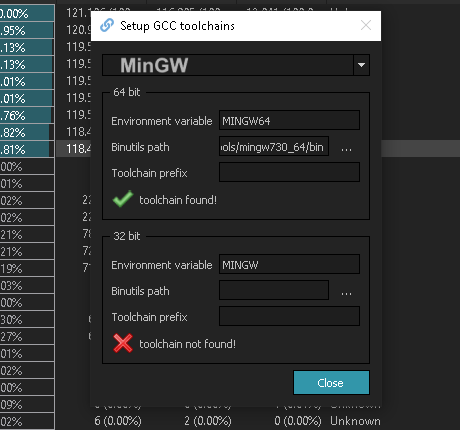
MinGW
$ cd MTuner/genie
$ genie --gcc=mingw-gcc gmake
$ cd ../../.build/windows/mingw-gcc/MTuner/projects/
$ make
MINGW environment variable must be set and point to the MinGW installation directory.
Tested with TDM64 MinGW using OpenMP package
Visual Studio
> cd MTuner/genie
> genie vs2022
Solution will be located here: {Clone root}/.build/windows/vs2022/projects/MTuner/MTuner.sln
NB: building Qt based projects with build requires Lua to be installed.
Environment variables are used to locate Qt installation, example:
set QTDIR_VS2022_x86=C:\<some_path>\Qt\6.3.1\msvc2019_64 *
set QTDIR_VS2022_x64=C:\<some_path>\Qt\6.3.1\msvc2019_64
* Note that Qt deprecated 32bit builds which is why both variables point to same location.
Copyright 2023 Milos Tosic. All rights reserved.

https://github.com/RudjiGames/MTuner

Redistribution and use in source and binary forms, with or without
modification, are permitted provided that the following conditions are met:

   1. Redistributions of source code must retain the above copyright notice,
      this list of conditions and the following disclaimer.

   2. Redistributions in binary form must reproduce the above copyright
      notice, this list of conditions and the following disclaimer in the
      documentation and/or other materials provided with the distribution.

THIS SOFTWARE IS PROVIDED BY COPYRIGHT HOLDER ``AS IS'' AND ANY EXPRESS OR
IMPLIED WARRANTIES, INCLUDING, BUT NOT LIMITED TO, THE IMPLIED WARRANTIES OF
MERCHANTABILITY AND FITNESS FOR A PARTICULAR PURPOSE ARE DISCLAIMED. IN NO
EVENT SHALL COPYRIGHT HOLDER OR CONTRIBUTORS BE LIABLE FOR ANY DIRECT,
INDIRECT, INCIDENTAL, SPECIAL, EXEMPLARY, OR CONSEQUENTIAL DAMAGES
(INCLUDING, BUT NOT LIMITED TO, PROCUREMENT OF SUBSTITUTE GOODS OR SERVICES;
LOSS OF USE, DATA, OR PROFITS; OR BUSINESS INTERRUPTION) HOWEVER CAUSED AND
ON ANY THEORY OF LIABILITY, WHETHER IN CONTRACT, STRICT LIABILITY, OR TORT
(INCLUDING NEGLIGENCE OR OTHERWISE) ARISING IN ANY WAY OUT OF THE USE OF
THIS SOFTWARE, EVEN IF ADVISED OF THE POSSIBILITY OF SUCH DAMAGE.