Coder Social home page Coder Social logo

rstudio / gt Goto Github PK

View Code? Open in Web Editor NEW
1.9K 49.0 192.0 249.94 MB

Easily generate information-rich, publication-quality tables from R

Home Page: https://gt.rstudio.com

License: Other

R 78.94% SCSS 0.39% Rich Text Format 20.64% Python 0.01% CSS 0.02%
r summary-tables easy-to-use docx html latex rtf

gt's Introduction

CRAN status License: MIT R build status Coverage status

Best Practices The project has reached a stable, usable state and is being actively developed. Monthly Downloads Total Downloads

Twitter Follow Posit Cloud

Discord

Contributor Covenant


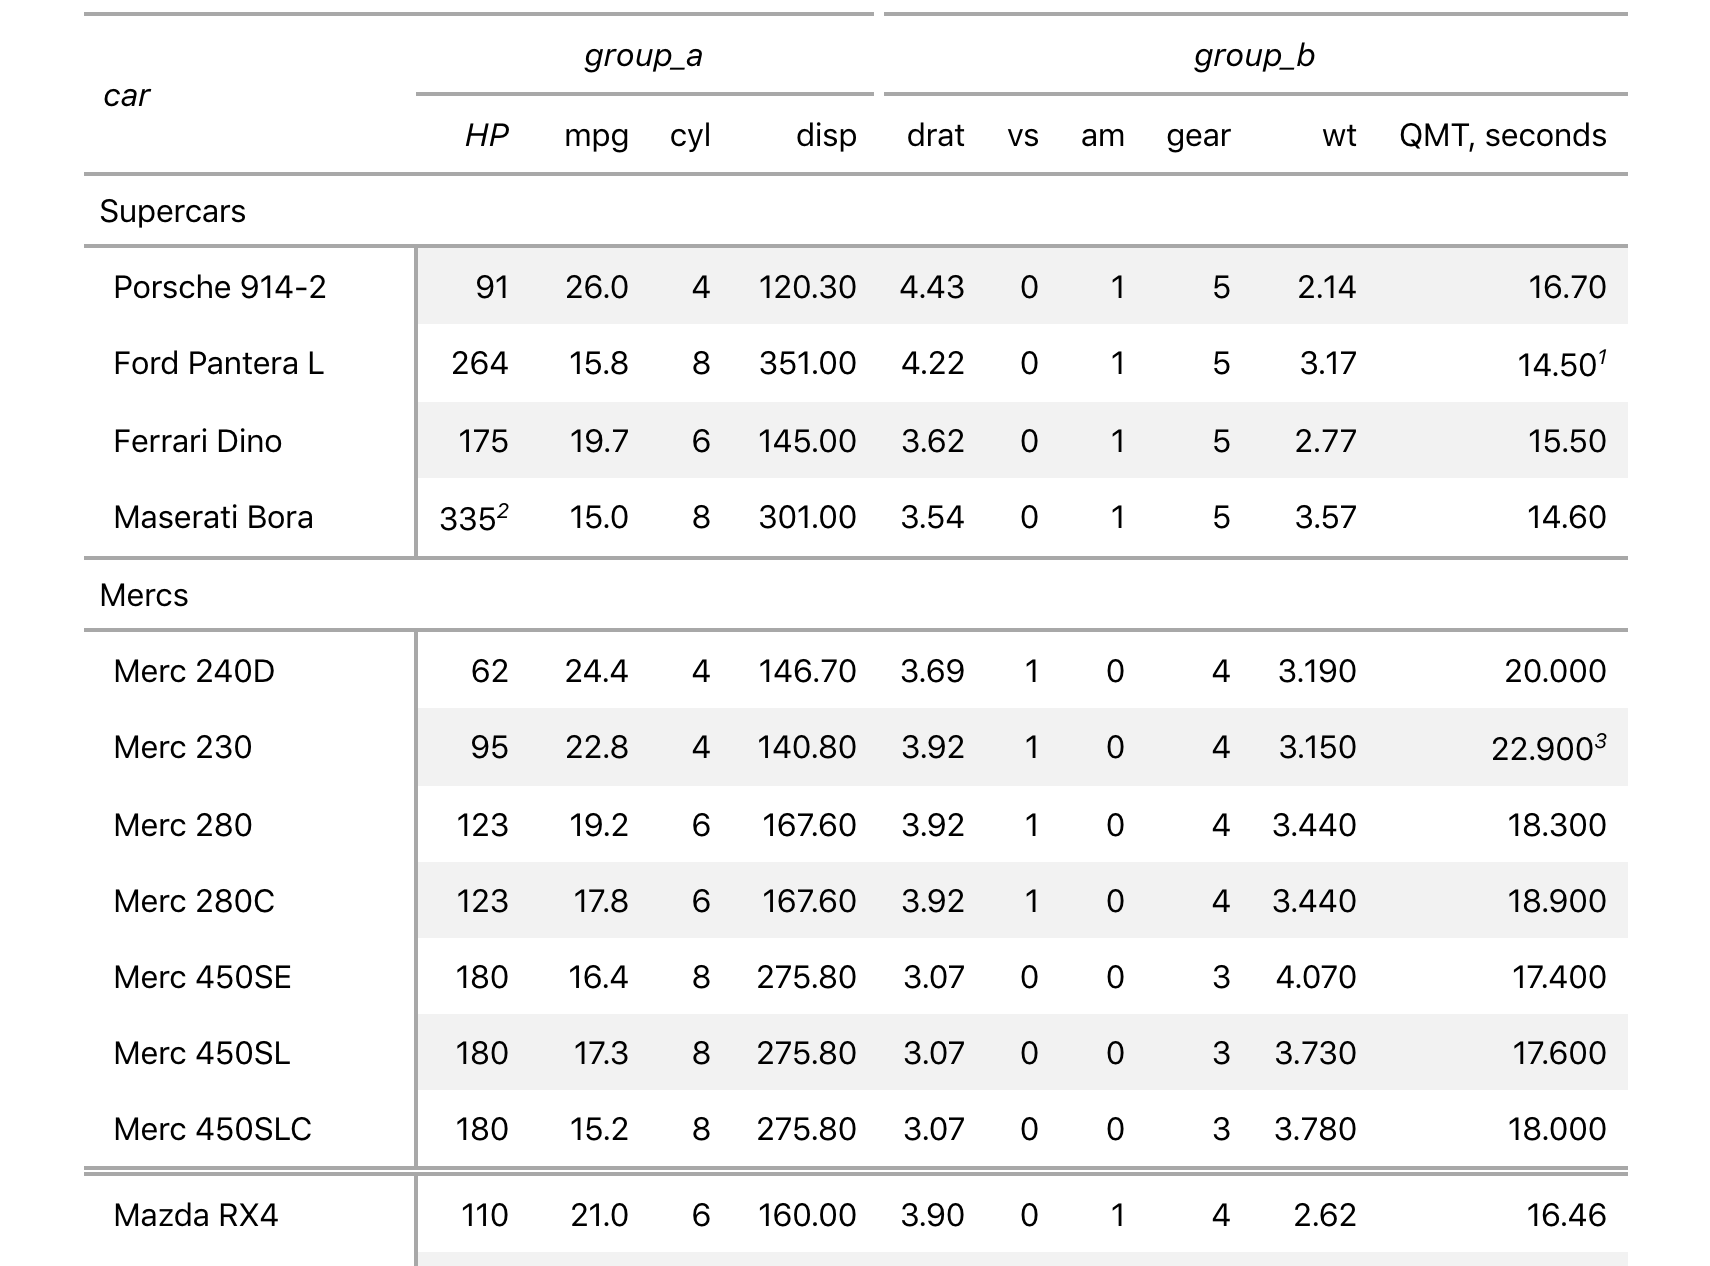
With the gt package, anyone can make wonderful-looking tables using the R programming language. The gt philosophy: we can construct a wide variety of useful tables with a cohesive set of table parts. These include the table header, the stub, the column labels and spanner column labels, the table body, and the table footer.

It all begins with table data (be it a tibble or a data frame). You then decide how to compose your gt table with the elements and formatting you need for the task at hand. Finally, the table is rendered by printing it at the console, including it in an R Markdown document, or exporting to a file using gtsave(). Currently, gt supports the HTML, LaTeX, and RTF output formats.


The gt package is designed to be both straightforward yet powerful. The emphasis is on simple functions for the everyday display table needs. Here is a brief example of how to use gt to create a table from the included sp500 dataset:

library(gt)

# Define the start and end dates for the data range
start_date <- "2010-06-07"
end_date <- "2010-06-14"

# Create a gt table based on preprocessed
# `sp500` table data
sp500 |>
  dplyr::filter(date >= start_date & date <= end_date) |>
  dplyr::select(-adj_close) |>
  gt() |>
  tab_header(
    title = "S&P 500",
    subtitle = glue::glue("{start_date} to {end_date}")
  ) |>
  fmt_currency() |>
  fmt_date(columns = date, date_style = "wd_m_day_year") |>
  fmt_number(columns = volume, suffixing = TRUE)

There are twelve datasets provided by gt: countrypops, sza, gtcars, sp500, pizzaplace, exibble, towny, metro, constants, illness, rx_adsl, and rx_addv.

All of this tabular data is great for experimenting with gt’s functions and we make extensive use of these datasets in our documentation.

Beyond the functions shown in the simple sp500-based example, there are many functions available in gt for creating super-customized tables. Check out the documentation website to get started via introductory articles for making gt tables. There's a handy Reference section that has detailed help for every function in the package.

Documentation Site

With the gt Test Drive, you can try gt in the Posit Cloud environment that features the RStudio IDE and a large collection of ready-to-run examples. Visit the publicly available Posit Cloud project and try out the package in your browser. There's no charge to use this platform and you'll learn a lot about what the package can do!

Posit Cloud


Let's talk about making tables with gt! There are a few locations where there is much potential for discussion.

One such place is in GitHub Discussions. This discussion board is especially great for Q&A, and many people have had their problems solved in there.

GitHub Discussions

Another fine venue for discussion is in the gt_package Discord server. This is a good option for asking about the development of gt, pitching ideas that may become features, and sharing your table creations!

Discord Server

Finally, there is the gt_package Twitter account. There you'll find tweets about gt (including sneak previews about in-development features) and other table-generation packages.

Twitter Follow

These are all great places to ask questions about how to use the package, discuss some ideas, engage with others, and much more!

INSTALLATION

The gt package can be installed from CRAN with:

install.packages("gt")

You can also choose to install the development version of gt from GitHub:

devtools::install_github("rstudio/gt")

If you encounter a bug, have usage questions, or want to share ideas to make this package better, please feel free to file an issue.


Packages that use or extend gt

There are several R packages that either use gt to generate tabular outputs or extend gt in amazing ways. Here is a short list of some of these great packages:


Code of Conduct

Please note that the gt project is released with a contributor code of conduct.
By participating in this project you agree to abide by its terms.

📄 License

gt is licensed under the MIT license. See the LICENSE.md file for more details.

© Posit Software, PBC.

🏛️ Governance

This project is primarily maintained by Rich Iannone. Other authors may occasionally assist with some of these duties.


gt's People

Contributors

alex-lauer avatar bastistician avatar billdenney avatar cderv avatar charliejhadley avatar christopherkenny avatar coatless avatar cscheid avatar davidkane9 avatar ddsjoberg avatar elipousson avatar hadley avatar jcheng5 avatar jooyoungseo avatar kbrevoort avatar mcanouil avatar mgirlich avatar mojister avatar nanxstats avatar olivroy avatar rcannood avatar rich-iannone avatar rkb965 avatar ryanbthomas avatar salim-b avatar schloerke avatar slodge avatar steveputman avatar teunbrand avatar thebioengineer avatar

Stargazers

 avatar  avatar  avatar  avatar  avatar  avatar  avatar  avatar  avatar  avatar  avatar  avatar  avatar  avatar  avatar  avatar  avatar  avatar  avatar  avatar  avatar  avatar  avatar  avatar  avatar  avatar  avatar  avatar  avatar  avatar  avatar  avatar  avatar  avatar  avatar  avatar  avatar  avatar  avatar  avatar  avatar  avatar  avatar  avatar  avatar  avatar  avatar  avatar  avatar  avatar  avatar  avatar  avatar  avatar  avatar  avatar  avatar  avatar  avatar  avatar  avatar  avatar  avatar  avatar  avatar  avatar  avatar  avatar  avatar  avatar  avatar  avatar  avatar  avatar  avatar  avatar  avatar  avatar  avatar  avatar  avatar  avatar  avatar  avatar  avatar  avatar  avatar  avatar  avatar  avatar  avatar  avatar  avatar  avatar  avatar  avatar  avatar  avatar  avatar  avatar

Watchers

 avatar  avatar  avatar  avatar  avatar  avatar  avatar  avatar  avatar  avatar  avatar  avatar  avatar  avatar  avatar  avatar  avatar  avatar  avatar  avatar  avatar  avatar  avatar  avatar  avatar  avatar  avatar  avatar  avatar  avatar  avatar  avatar  avatar  avatar  avatar  avatar  avatar  avatar  avatar  avatar  avatar  avatar  avatar  avatar  avatar  avatar  avatar  avatar  avatar  avatar

gt's Issues

Create new datasets for the package

Add 3–4 original datasets to the package. These should be from different topic areas and useful for demonstrating different types of table features.

Conditional formatting (expression in `rows`) doesn't work

The following used to work but no longer does:

readr::read_csv(
    system.file("extdata", "sp500.csv", package = "gt"),
    col_types = "cddddd") %>%
  gt() %>%
  fmt_number(
    columns = vars(Open),
    rows = Open > 1900,
    decimals = 3,
    scale_by = 1/1000,
    pattern = "{x}K") %>%
  fmt_number(
    columns = vars(Close),
    rows = High < 1940 & Low > 1915,
    decimals = 3) %>%
  fmt_currency(
    columns = vars(High, Low, Close),
    rows = Date > "2016-02-20",
    currency = "USD")

The following error is obtained:

Error in rlang::eval_tidy(var_expr, data_df, env = NULL) : 
  object 'Open' not found 

Ensure that this works again and include the appropriate testthat tests as well.

Modify naming of table elements

From discussions with @schloerke , we came up with alternative names for table elements that would be clearer to the average user. Here are the name changes, roughly from the top to the bottom of the table:

table title (part) -> table header
title -> title
headnote -> subtitle
boxhead (part) -> column labels

stubhead caption -> stubhead label

row caption -> row label

stub -> stub (no change)
row group -> row group (no change) (contains all information in a row)
stub group label -> row group label (label for the row group)

spanner group column -> spanner column label
column label -> column label (no change)

summary caption -> summary label

field -> table body

“” -> footer (part)
source notes -> source notes (no change)
footnotes -> footnotes (no change)

Nomenclature for other main objects:

dataset supplied to gt: table data
the R object using in successive gt API calls: gt object
the print output of the gt object: gt table

Most of this doesn't have an impact on the gt function names but rather just text in documentation and in code comments.

Remove class of `data.frame` from the gt data object

Currently, there are classes of gt_tbl and data.frame. This may cause problems when inadvertently using data frame indexing or dplyr functions, which don't cause errors and will produce strange results.

Consider removing the data.frame class and adding print methods that will work with as.data.frame, summary, etc.

Default S3 rendering method

A default S3 formatting method should be implemented, with this logic ported to format_gt.default and format_gt.list. That method should be sure to take a rendering format too (HTML vs. RTF).

Fix for `fmt_percent()` when rendering to Latex

Currently, the percentage sign is not escaped for Latex when that is the output mode. Each fmt_*() function contains specialized formatter functions for each output mode and only default is defined for fmt_percent().

Create pkgdown site

Create a pkgdown site for the package. This will involve having:

  • all of the necessary vignettes completed (they will be articles): #44
  • all of the internal help/man-page documentation completed: #43
  • a minimal README.md with examples removed: #45

Another thing to consider: details related to the hosting of the site of the pkgdown site.

Coloring

It would be nice to have a color argument to the theme_striped() function for the background color.

Additionally, the color scheme of the tables matching the R Markdown theme of the document they live in would look nice.

Improvements to the appearance of the HTML table

The table should be centered in the content area and not (by default) take 100% of the width. Also, the row captions in the stub area should be left-aligned and have a slight indent (to visually separate row captions from the stub group captions).

Delay text processing of column headers until render time

The process_text() function is called to process column label text prior to rendering within a specific context (e.g., HTML, Latex, etc.). This should change to a system where these labels are be held in a list of lists (within data, as an attribute). This is so that text can be modified repeatedly and also that classes can be used and retained until render time.

The cols_label(), cols_split_delim(), and tab_boxhead_panel() functions will need to be reworked.

Complete first pass of package vignettes

The package vignettes should include:

  • an introductory article (as a quick-start guide)
  • several vignettes focussed on a specific gt feature (e.g., formatting, summaries, table components, etc.)
  • case studies, where a fairly complex table task is shown from beginning to end

Create QA test plans

Need to write a QA testing plan for the comprehensive internal testing of the gt package. Key points to consider:

  • all output formats render properly (HTML, RTF, Latex) in their respective browsers/applications/viewers
  • works across platforms (Mac, Linux, Windows)
  • text rendering works

The way to prepare/conduct this testing is to have a series of test scripts and .Rmd documents that can be tested across platforms/browsers/applications (e.g., does a gt table as an RTF document render correctly in Word on Windows 10?).

Several problems with `summary_rows()`

The summary_rows() function is problematic in many cases. It seems to only work at all when:

  • there is a stub column (using any of the methods to create a stub column with gt())
  • there are row groups (using any of the methods to create groups with gt() or group_by(data) %>% gt())

Also, there are usability problems with the arguments:

  • the groups argument can't use group names enclosed in vars() but only c() (this is more of a consistency issue since a lot of label selections can use both)
  • the columns argument (even though the default is NULL) must contain either a vars() or c() with columns to be included in the aggregation for the selected groups: NULL or TRUE yield errors (Error: `.vars` must be a character/numeric vector or a `vars()` object, not logical)

For reference, this currently works:

gt(iris %>% tibble::rownames_to_column(), groupname_col = "Species") %>%
  summary_rows(
    columns = vars(Sepal.Length, Sepal.Width, Petal.Length, Petal.Width),
    fns = list(avg = "mean", `s.d.` = "sd"))

But the user may not want/need row captions and also wouldn't like to type out all of the column names.

There is also another issue (#38) that puts forward that summary_rows() should also create a 'grand summary', that is, include all rows (irrespective of any groups they may or may not be part of) and create summary rows at the bottom of the table.

Thus, to plan for this extra functionality, the groups argument might take in the following to perform the intended actions:

  1. Grand Summary Rows (creates rows at the bottom, not concerned with individual groups at all) – becomes the default behavior
.... %>%
summary_rows(
  groups = NULL,
  columns = vars(....),
  fns = list(....))
  1. Summary Rows for All Groups (creates rows at the bottom of each group, uses a sentinel function like all_groups())
.... %>%
summary_rows(
  groups = all_groups(),
  columns = vars(....),
  fns = list(....))
  1. Summary Rows for Selected Groups (creates rows at the bottom of each group specified)
.... %>%
summary_rows(
  groups = vars(....),
  columns = vars(....),
  fns = list(....))

Very open to discussion on this topic.

For all `fmt*()` fcns, have option to include/exclude processing of NA rows

There should be better NA-handling options for all the fmt*() fcns. Currently, this example:

sza %>%
  filter(latitude == 20) %>%
  filter(!is.na(sza)) %>%
  spread(key = "tst", value = sza) %>%
  gt(rowname_col = "month") %>%
  fmt_number(columns = TRUE, decimals = 2) %>%
  fmt_missing(columns = TRUE, missing_text = "")

will not replace the NA values because the fmt_number() will include all rows in the stored function (regardless of NA or not) and so fmt_missing() will have no rows to format.

Hiding rows in a long table

Sometimes it's nice to show the data frame in slides, especially when teaching what a data frame is. In those occasions I usually show the top <5 rows, then a row of ..., then the last row. It would be nice to have such a display functionality.

This is pretty hacky, but something along the lines of this:

library(tidyverse)

df <- mtcars %>%
  slice(1:5) %>%
  rbind(rep("...", ncol(.))) %>%
  rbind(slice(mtcars, nrow(mtcars)))

row.names(df)[6] <- "..."
row.names(df)[7] <- nrow(mtcars)

df
#>      mpg cyl disp  hp drat    wt  qsec  vs  am gear carb
#> 1     21   6  160 110  3.9  2.62 16.46   0   1    4    4
#> 2     21   6  160 110  3.9 2.875 17.02   0   1    4    4
#> 3   22.8   4  108  93 3.85  2.32 18.61   1   1    4    1
#> 4   21.4   6  258 110 3.08 3.215 19.44   1   0    3    1
#> 5   18.7   8  360 175 3.15  3.44 17.02   0   0    3    2
#> ...  ... ...  ... ...  ...   ...   ... ... ...  ...  ...
#> 32  21.4   4  121 109 4.11  2.78  18.6   1   1    4    2

Created on 2018-05-14 by the reprex package (v0.2.0).

Locale based formatting

A few locale based customizations that I can think of are:

  • currency symbol at the beginning/end of value
  • comma/period for decimals
  • % sign at the beginning/end of value
  • minus sign/parentheses for negative values

I have not looked for an comprehensive resource on this, but I bet there is one.

Rename `cols_remove()` to `cols_hide()`

The renaming of cols_remove() to cols_hide() better communicate that certain columns are not going to be displayed in the output display table. This wording is also more in line with spreadsheeting terminology.

Two-way summaries

base::table() results in an output that is decidedly not tidy, and not necessarily very attractive either, but it does a good job in suumarising the conditional distribution of one categorical variable over the other, and it’s a nice display for teaching conditional probabilities. It would be nice to think about whether/how to achieve this same goal here (ideally along with margins added too).

Fix the `inline_html_styles()` utility function

The inline_html_styles() function is used for inlining CSS styles in a gt table and this is an essential preparatory step for inclusion of gt tables in email message bodies. Recent changes to the SCSS file (particularly the addition of a random id element) resulted in this function no longer working.

The function needs to be rewritten to take the SCSS changes into account.

Have underlying data for an HTML table be downloadable

For reproducibility, we'd want to have source data available with an HTML table by default. This includes the input data and also the code required to generate the table. The user could opt out of including any one of these (or both).

For HTML, the following files should made available through links somewhere in the displayed table:

  • raw CSV of the table (data_df)
  • gt code required to produce the table

To do this, have an extra internal attribute that collects all gt statements. At render time, the statements will

  • be formatted as a pipeline
  • always referring to input data as data

Difficulties will come in when users supply their own custom functions or values that can not be immediately captured. The choice will have to be made as to how far the inspection code will traverse to have full reproducibility.

Proof of concept:

z <- 1
f <- function(x) x + z
key <- function(x, b) {
  x + f(b)
}

input_to_string <- function(x) {
  conn <- textConnection("list_to_string", "w")
  on.exit({close(conn)})
  dput(x, file = conn)
  paste0(textConnectionValue(conn), collapse = "\n")
}

input_to_string(a)
#> [1] "function (x, b) \n{\n    x + f(b)\n}"

datadr::drGetGlobals(key)
#> $vars
#> $vars$f
#> function (x) 
#> x + z
#> 
#> $vars$z
#> [1] 1
#> 
#> 
#> $packages
#> [1] "base"

Created on 2018-10-04 by the reprex package (v0.2.1)

Result could be something like...

some_gt_function(
  key = local({
    z <- 1
    f <- function(x) x + 1
    function(x, b) {
      x + f(b)
    }
  })
)

Reproducibility could be tested by calling the captured code and comparing the initial table with the reproduced table.

Remove need to use `header-includes` for necessary Latex packages

Currently, the user needs to use:

header-includes:
   - \usepackage{booktabs, caption}

in the YAML header when knitting to PDF when there is a gt table present in the document. This is difficult to remember, so an automatic solution within knit_print.gt_tbl is required here.

Remove top line gap in HTML table under certain circumstances

A gap in the top line appears when there are two adjacent column spanner groups and there is no table title.

The following statement, adapted from the html-06-mtcars.R example .R script, reproduces the display bug:

gt(mtcars, rownames_to_stub = TRUE) %>%
  cols_align(
    align = "right",
    columns = vars(disp, vs)) %>%
  tab_boxhead_panel(
    group = md("*group_a*"),
    columns = vars(mpg, cyl, disp, hp)) %>%
  tab_boxhead_panel(
    group = md("*group_b*"),
    columns = vars(drat, wt, qsec, vs, am, gear, carb)) %>%
  cols_move_to_start(columns = vars(hp)) %>%
  cols_move_to_end(columns = vars(am, gear)) %>%
  cols_hide(columns = vars(carb)) %>%
  cols_move(columns = vars(wt, carb, qsec), after = vars(gear)) %>%
  tab_stub_block(
    group = "Mercs",
    rows = c(
      "Merc 240D", "Merc 230", "Merc 280C", "Merc 280",
      "Merc 450SE", "Merc 450SL", "Merc 450SLC")) %>%
  tab_stub_block(
    group = "Supercars",
    rows = c("Ferrari Dino", "Maserati Bora", "Porsche 914-2", "Ford Pantera L")) %>%
  blocks_arrange(
    groups = c("Supercars", "Mercs")) %>%
  fmt_number(
    columns = vars(disp, drat, wt), decimals = 2) %>%
  fmt_number(
    columns = vars(qsec, wt), decimals = 3, rows = starts_with("Merc")) %>%
  fmt_number(
    columns = vars(mpg), decimals = 1) %>%
  # tab_heading(
  #   title = md("The **mtcars** dataset"),
  #   headnote = md("[A rather famous *Motor Trend* table]")) %>%
  tab_source_note(
    source_note = md("Main Source of Data: *Henderson and Velleman* (1981).")) %>%
  tab_source_note(
    source_note = md("Original Data: *Motor Trend Magazine* (1974).")) %>%
  tab_stubhead_caption(
    caption = md("*car*")) %>%
  tab_footnote(
    footnote = md("*Really* fast quarter mile."),
    locations = cells_data(
      columns = vars(qsec),
      rows = "Ford Pantera L")) %>%
  tab_footnote(
    footnote = "Massive hp.",
    locations = cells_data(
      columns = vars(hp),
      rows = "Maserati Bora")) %>%
  tab_footnote(
    footnote = "Excellent gas mileage.",
    locations = cells_data(
      columns = 1,
      rows = "Toyota Corolla")) %>%
  tab_footnote(
    footnote = md("Worst speed *ever*."),
    locations = cells_data(
      columns = vars(qsec),
      rows = "Merc 230")) %>%
  cols_label(
      hp = md("*HP*"),
      qsec = "QMT, seconds")

This is seen in the RStudio Viewer (macOS 10.14):

line_gap

The top line should have no apparent gaps in it.

Add Latex support for breaking longer table across pages

This might use the longtable or supertabular Latex package. Also, we want options for the user to specify the Continued text (word replacement, disabling, etc.). Other issues are availability of these packages in the TinyTeX default installation, pinning the table to the intended start location (i.e., Latex may choose to start a table on the next page), and making this work with the captions Latex package.

Recommend Projects

  • React photo React

    A declarative, efficient, and flexible JavaScript library for building user interfaces.

  • Vue.js photo Vue.js

    🖖 Vue.js is a progressive, incrementally-adoptable JavaScript framework for building UI on the web.

  • Typescript photo Typescript

    TypeScript is a superset of JavaScript that compiles to clean JavaScript output.

  • TensorFlow photo TensorFlow

    An Open Source Machine Learning Framework for Everyone

  • Django photo Django

    The Web framework for perfectionists with deadlines.

  • D3 photo D3

    Bring data to life with SVG, Canvas and HTML. 📊📈🎉

Recommend Topics

  • javascript

    JavaScript (JS) is a lightweight interpreted programming language with first-class functions.

  • web

    Some thing interesting about web. New door for the world.

  • server

    A server is a program made to process requests and deliver data to clients.

  • Machine learning

    Machine learning is a way of modeling and interpreting data that allows a piece of software to respond intelligently.

  • Game

    Some thing interesting about game, make everyone happy.

Recommend Org

  • Facebook photo Facebook

    We are working to build community through open source technology. NB: members must have two-factor auth.

  • Microsoft photo Microsoft

    Open source projects and samples from Microsoft.

  • Google photo Google

    Google ❤️ Open Source for everyone.

  • D3 photo D3

    Data-Driven Documents codes.