Coder Social home page Coder Social logo

mobdebug's Introduction

Project Description

MobDebug is a remote debugger for Lua (including Lua 5.1, Lua 5.2, Lua 5.3, Lua 5.4, and LuaJIT 2.x).

Features

MobDebug allows to control the execution of another Lua program remotely, set breakpoints, and inspect the current state of the program.

Mobdebug is a cross-platform debugger, which not only works on Windows, macOS, and Linux, but also supports debugging with the application and debugger running on different platforms.

It also supports source maps, which allows debugging of Lua-based languages, like Moonscript and GSL-shell.

MobDebug is based on RemDebug and extends it in several ways:

  • added support for Lua 5.2, Lua 5.3, and Lua 5.4;
  • added support for LuaJIT debugging;
  • added support for cross-platform debugging (client and server running on different platforms/filesystems);
  • added new commands: LOAD, RELOAD, OUT, STACK, DONE;
  • added ability to pause and abort running applications;
  • added pretty printing and handling of multiple results in EXEC;
  • added stack and local/upvalue value reporting (STACK);
  • added on/off commands to turn debugging on and off (to improve performance);
  • added support for coroutine debugging (see examples/README for details);
  • added support for varargs in stack trace;
  • added support for vararg expressions in EXEC;
  • added support for source maps;
  • added support for debugging nginx/OpenResty, Lapis, and wxwidgets applications;
  • removed dependency on LuaFileSystem;
  • provided integration with ZeroBrane Studio IDE.

Usage

-- to start a server you can use to debug your application
> lua -e "require('mobdebug').listen()"

-- to debug a script, add the following line to it:
require("mobdebug").start()

Installation

Make src/mobdebug.lua available to your script. See examples/README and examples/*.lua for examples of how to use the module.

Dependencies

MobDebug depends on LuaSocket 2.0+ and has been tested with Lua 5.1, Lua 5.2, Lua 5.3, and Lua 5.4. MobDebug also works with LuaJIT v2.0+; using loop and scratchpad methods requires v2.0.1.

Troubleshooting

Generally, breakpoints set with in the debugger should work without any additional configuration, but there may be cases when this doesn't work out of the box, which may happen for several reasons:

  • A breakpoint may be inside a coroutine; by default breakpoints inside coroutines are not triggered. To enable debugging in coroutines, including triggering of breakpoints, you may either (1) add require('mobdebug').on() call to that coroutine, which will enable debugging for that particular coroutine, or (2) add require('mobdebug').coro() call to your script, which will enable debugging for all coroutines created using coroutine.create later in the script.
  • If you enable coroutine debugging using require('mobdebug').coro(), this will not affect coroutines created using C API or Lua code wrapped into coroutine.wrap. You can still debug those fragments after adding require('mobdebug').on() to the coroutine code.
  • The path of the file known to the debugger (the caller of setb command) may not be the same as the path known to the Lua engine (running the code being debugged). For example, if you use an embedded engine, you may want to check if the path reported by the engine is normalized (doesn't include ../ references) by checking the result of debug.getinfo(1,"S").source.
  • The capitalization of the file known to the debugger may not be the same as the capitalization of the file known to the Lua engine with the latter running on a case-sensitive system. For example, if you set a breakpoint on the file TEST.lua in the debugger running on Window (case-insensitive), it may not fire in the application running test.lua on Linux (with case-sensitive file system). To avoid this make sure that the capitalization for your project files is the same on both file systems.
  • The script you are debugging may change the current folder (for example, using lfs module) and load the script (using dofile) from the changed folder. To make breakpoints work in this case you may want to use absolute path with dofile.
  • You may have a symlink in your path and be referencing paths to your scripts differently in the code and in the debugger (using a path with symlink in one case and not using it in the other case).
  • You may be using your own Lua engine that doesn't report file names relative to the project directory (as set in the debugger). For example, you set the project directory pointing to scripts folder (with common subfolder) and the engine reports the file name as myfile.lua instead of common/myfile.lua; the debugger will be looking for scripts/myfile.lua instead of scripts/common/myfile.lua and the file will not be activated and the breakpoints won't work. You may also be using inconsistent path separators in the file names; for example, common/myfile.lua in one case and common\myfile.lua in another.
  • If you are loading files using luaL_loadbuffer, make sure that the chunk name specified (the last parameter) matches the file location.
  • If you set/remove breakpoints while the application is running, these changes may not have any effect if only a small number of Lua commands get executed. To limit the negative impact of socket checks for pending messages, the debugger in the application only checks for incoming requests every 200 statements (by default), so if your tests include fewer statements, then pause/break commands and toggling breakpoints without suspending the application may not work. To make the debugger to check more frequently, you can update checkcount field (require('mobdebug').checkcount = 1) before or after debugging is started.

Author

Paul Kulchenko ([email protected])

License

See LICENSE file

mobdebug's People

Contributors

dodo avatar felixonmars avatar moteus avatar neomantra avatar pkulchenko avatar

Stargazers

 avatar  avatar  avatar  avatar  avatar  avatar  avatar  avatar  avatar  avatar  avatar  avatar  avatar  avatar  avatar  avatar  avatar  avatar  avatar  avatar  avatar  avatar  avatar  avatar  avatar  avatar  avatar  avatar  avatar  avatar  avatar  avatar  avatar  avatar  avatar  avatar  avatar  avatar  avatar  avatar  avatar  avatar  avatar  avatar  avatar  avatar  avatar  avatar  avatar  avatar  avatar  avatar  avatar  avatar  avatar  avatar  avatar  avatar  avatar  avatar  avatar  avatar  avatar  avatar  avatar  avatar  avatar  avatar  avatar  avatar  avatar  avatar  avatar  avatar  avatar  avatar  avatar  avatar  avatar  avatar  avatar  avatar  avatar  avatar  avatar  avatar  avatar  avatar  avatar  avatar  avatar  avatar  avatar  avatar  avatar  avatar  avatar  avatar  avatar  avatar

Watchers

 avatar  avatar  avatar  avatar  avatar  avatar  avatar  avatar  avatar  avatar  avatar  avatar  avatar  avatar  avatar  avatar  avatar  avatar  avatar  avatar  avatar  avatar  avatar  avatar  avatar  avatar  avatar  avatar  avatar  avatar  avatar  avatar  avatar  avatar  avatar  avatar  avatar  avatar  avatar  avatar  avatar  avatar  avatar  avatar  avatar  avatar  avatar  avatar  avatar  avatar  avatar  avatar  avatar  avatar

mobdebug's Issues

Debugger breaks with copas/http-client request and timeout

When debugging a copas-program, which runs in timeout issues in a http-client-request, then line 1111 breaks:

1111 return (dtraceback(...):gsub("(stack traceback:\n)[^\n]*\n", "%1"))
because dtraceback returns a table {"timeout"} in this case.

So I replaced line 1111 with:

local dtb=dtraceback(...)
if dtb.gsub then
  return dtb:gsub("(stack traceback:\n)[^\n]*\n", "%1")
else
  return
end

"Run To Cursor" and "Continue" don't work when remote debugging.

After read the documents (https://studio.zerobrane.com/doc-remote-debugging), I try to debug my project using remote debugging.

After run my application, I could see green arrow pointing to the next statement after the start() call in ZeroBrane Studio and I can press "Step over" to jump code step by step.

The problem is :
I only jump code step by step. If I toggle breakpoint at the next 3 line and press "Continue" or press "Run To Cursor" at the next 3 line in my code, the code fly....

This issue will not be reproduced when using local debugging. (anything is OK in local debugging)
operating system: windows7
IDE version: ZeroBraneStudio 1.30
Thanks.

update luarocks version

can you update luarocks version please?
In rocks, the MobDebug version is 0.55. It is too old and can't be used in Lua5.3.

Debugger doesn't show some local variables

This is mobdebug issue I guess. Consider the following code fragment:

local var1 = 666

function func()
    local var2 = 10
    print("Hello world") -- breakpoint here
end

func()

When stopped at breakpoint Stack Window correctly shows both variables var1 and var2. However other tools (Watch Window, Local console, tooltip) wrongly evaluate var1 as nil :(

But it's only half the story. When I make use of var1 in function func, e.g.

local var1 = 666

function func()
    local var2 = 10
    print("Hello world", var1) -- breakpoint here
end

func()

then everything works fine. Making var1 global also fixes the issue.

Update coro() method to return `create` and `wrap` values.

This is commit from far-support branch: 0801f18

Discussed here: http://forum.farmanager.com/viewtopic.php?p=116873#p116873

Edit
The idea behind current coro is great: to hide all tricky doings into 1 high level function.
Unfortunately, it's not bullet proof enough, and to handle possible issues one must clearly understand what exactly is happening inside (and due to lack of documentation it's necessary to inspect mobdebug source code).

Thus the idea of 'highlevelness' of this function gets completely destroyed.
So I propose to make things a level lower, but a lot clearer way.

The call stack may not be displayed completely

the next patch file can fix it.

 lualibs/mobdebug/mobdebug.lua | 2 +-
 1 file changed, 1 insertion(+), 1 deletion(-)

diff --git a/lualibs/mobdebug/mobdebug.lua b/lualibs/mobdebug/mobdebug.lua
index dc4ea684..efea8f66 100644
--- a/lualibs/mobdebug/mobdebug.lua
+++ b/lualibs/mobdebug/mobdebug.lua
@@ -338,7 +338,7 @@ local function stack(start)
        linemap and linemap(source.currentline, source.source) or source.currentline,
        source.what, source.namewhat, source.short_src},
       vars(i+1)})
-    if source.what == 'main' then break end
+    -- if source.what == 'main' then break end
   end
   return stack
 end

before use it
image

after use it
image

Documentation to implement servers

Is there some handy documentation on how to implement the server? What commands should be sent and how each part relates to each other.

I have been reading the source but I have to look for commands all over the place I have found a few but I'm not sure of what they do and what the arguments are (Please correct this information if something is wrong)

SETB %FILE% %LINE%  #Sets breakpoint
DELB %FILE% %LINE% #Delete breakpoint
SETW %EXPRESSION% #Sets a watcher (gives the result of an expression)
DELW %EXPRESSION% #Deletes a watcher
DONE #Finish debugging
EXIT #Finish debugging and quit

RUN #Runs the program?
SUSPEND #Does nothing?

EXEC %CHUNK% #?
OVER #?
OUT #?
BASEDIR %DIRECTORY% #?
STACK #?
OUTPUT %STREAM% %MODE% #?
LOAD %SIZE% %NAME% #?

Some more questions:

  • What are the possible responses for each command?
  • What are the common error messages I should handle?
  • Does the client send commands to the server? Which?
  • Which commands do I need to continually send and which are permanent? (I guess SET[B/W] and DEL[B/W] are permanents)

PS: I wanna make a debugger for Atom, but I want to use JavaScript to create the server so there is no requirement for Lua to be installed. The server needs to be compatible with the MobDebug commands.

How can i debug a process with ZeroBrane Studio with MobDebug?

Hi, bigcow, i am a newbie to lua, and can you tell me hao to debug with another windows process with
ZeroBrane Studio? I used some kind of lua debug ide like LuaStdio before(cracked version and unstable,in my country this is a very common habit), and i knew it inject into the process and so to debug it. Now i don't want to use LuaStdio, i use ZeroBrane Studio with MobDebug, and it's a great tool.

In common work, ZeroBrane Studio debug is very comfortable, but when i want debug some windows process which written in C++ with lua vm, i don't know hao to start. I already knows how to remote debug a script, but how to this with an another process? please help me, 3Q very much!

EXEC command removes comments in strings

function print_args(args)
    print(args)
end

use below code:

local _, result, err = mobdebug.handle(string.format("exec return print_args('%s')", '1/0 --[[math.huge]]'), client)

result is:
image

but execute from local like below code:

print_args('1/0 --[[math.huge]]')

result is:
image

Step in doesn't work for functions in files not opened in ZeroBrane Studio

Hi!
I'm developing a game on custom engine that run scripts with embedded LuaJIT 2.0.5.

Not too long started to debug scripts with mobdebug and ZBS. For some reason "Step into" feature sometimes doesn't work (it just steps on the next line instead of stepping into a function). But sometimes it works fine. What are the limitations for "Step into"?

Usage examples

Hi, I love being able to debug in Lua, finally!
But I have some doubts about how to use some functions, like

setw <exp>            -- adds a new watch expression
delw <index>          -- removes the watch expression at index
delallw               -- removes all watch expressions
reload                -- restarts the current debugging session
stack                 -- reports stack trace
output stdout <d|c|r> -- capture and redirect io stream (default|copy|redirect)

Is there some tutorials / examples about this stuff?

Thank you very much

luajit substitute for mobdebug.coro

As follows from this discussion, mobdebug makes special actions to forbid debugging of that coroutines, where it was not explicitely enabled with on() call (or implicitely via coro())

It looks like overkill: forbid debugging in one place, and compensate it by unobvious and tricky coro call.

I understand that it's all for the sake of uniform module interface.

But what if you make special option for this?

Make sure metamethods can't interfere with Serpent

I've produced a few test cases that can either interfere with debug output or outright crash the debugger. This is really just an annoyance for me, but it may also have some security implications.

The metamethods I've tested were __pairs and __tostring. The former is easy to work around using next, but the latter needs a temporarily unsetting of the metatable and then a subsequent reset. Since the output of getmetatable can be overwritten I suggest debug.getmetatable.

I'll try to make a PR fixing these right now, but I'll leave the issue open.

Problem with llthreads

There is a seldom issue with mobdebug and llthreads.

Line 24:
port = os and os.getenv and tonumber(os.getenv("MOBDEBUG_PORT")) or 8172,

It seems that under certain circumstances "os.getenv" fails and gives a second result. This result (error message) ist used by "tonumber()", which causes to fail mobdebug.

As portnumbers always are decimal numbers, I simply added ",10" as second parameter to "tonumber()":

New Line 24:
port = os and os.getenv and tonumber(os.getenv("MOBDEBUG_PORT"),10) or 8172,

package.loaded.mobdebug = mobdebug

-- this is needed to make "require 'modebug'" to work when mobdebug
-- module is loaded manually
package.loaded.mobdebug = mobdebug

I see mobdebug now does not require itself in code, so this line is probably not needed anymore.

the 'debug.traceback' defined in 'local function start(controller_host, controller_port)' has bug

the example code from https://github.com/cocos2d/cocos2d-x/blob/v4/cocos/scripting/lua-bindings/script/cocos2d/functions.lua

function dump(value, description, nesting)
    if type(nesting) ~= "number" then nesting = 3 end

    local lookupTable = {}
    local result = {}

    local traceback = string.split(debug.traceback("", 2), "\n")
    print("dump from: " .. string.trim(traceback[3]))

the function call debug.traceback("", 2), and assume its result is not null, if use MobDebug remote debugger and open print redirect function like debugger.redirect='c' the dump function will crash, because the below code:

    local function f() return function()end end
    if f() ~= f() then -- Lua 5.1 or LuaJIT
      local dtraceback = debug.traceback
      debug.traceback = function (...)
        if select('#', ...) >= 1 then
          local thr, err, lvl = ...
          if type(thr) ~= 'thread' then err, lvl = thr, err end
          local trace = dtraceback(err, (lvl or 1)+1)
          if genv.print == iobase.print then -- no remote redirect
            return trace
          else
            genv.print(trace) -- report the error remotely
            return -- don't report locally to avoid double reporting
          end
        end

the line return -- don't report locally to avoid double reporting return nothing as the result of debug.traceback, so I think
we need to change to return trace or delete this user implemented debug.traceback function

Couldn't activate file - ini File with Global Function loaded at startup

Hello Paul,
thirst of all, thank you very much for your development on MobDebug and ZeroBraneStudio !

Maybe it is working as expected, here my case:
Game --> XPlane 11 Flight Simulator --> Plugin Engine loads --> FlyWithLua
In this Plugin Environment can Lua Scripts run with "LuaJIT 2.0.5"

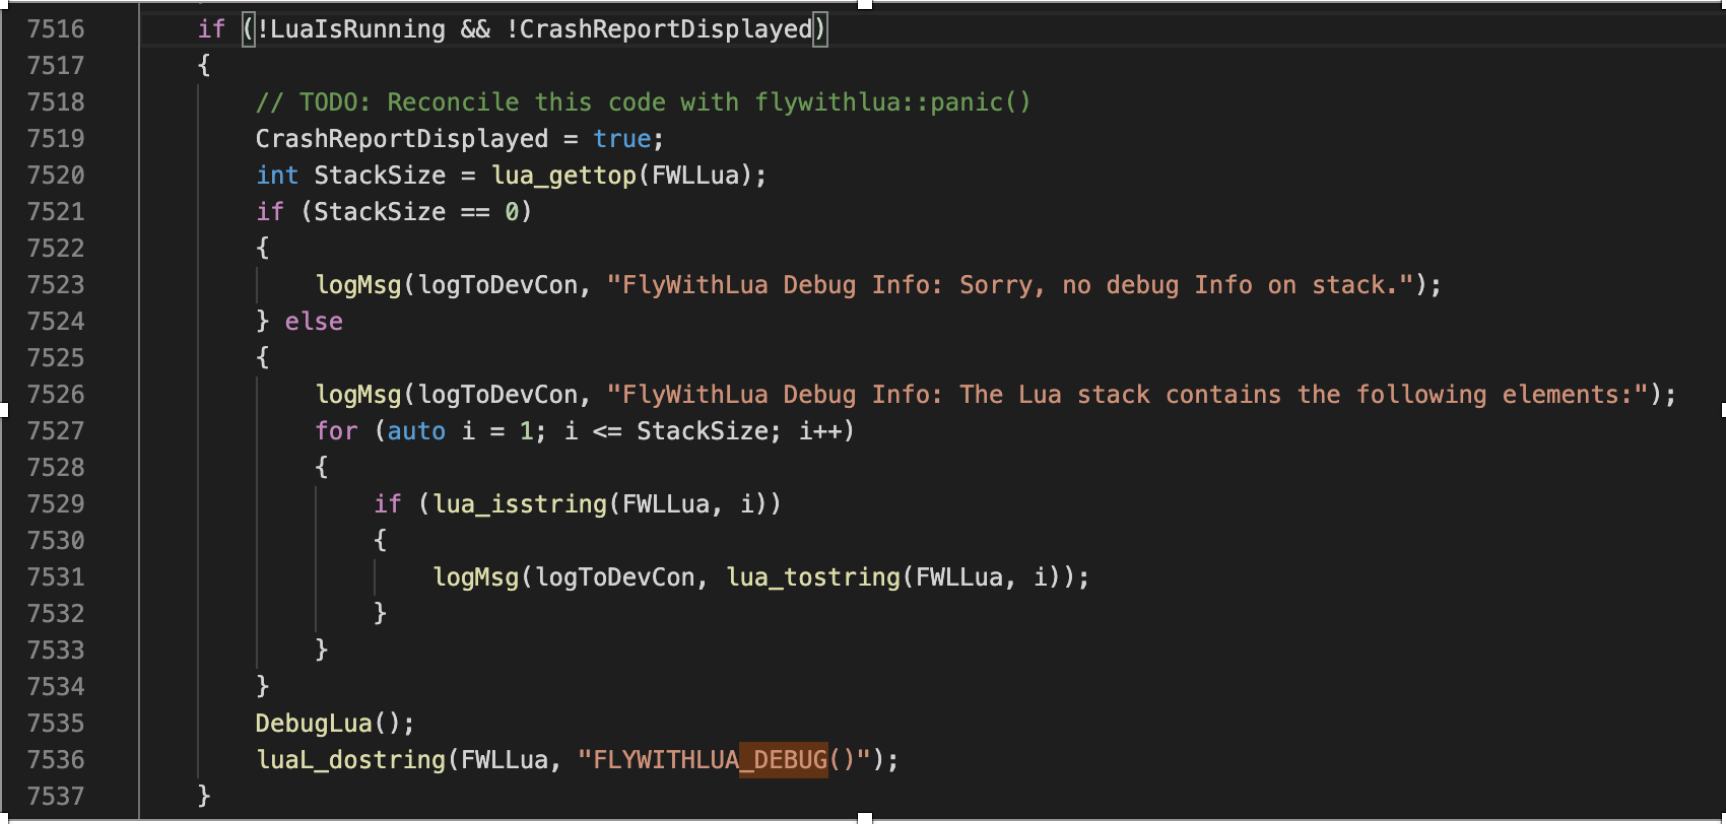
When this Plugin is loaded in Xplane, it reads in the first time an ini File with some Basic stuff plus delivered also a function --> function FLYWITHLUA_DEBUG(). Inside this function is logging etc ...

Source --> https://github.com/X-Friese/FlyWithLua/blob/master/FlyWithLua/Internals/FlyWithLua.ini

I can see it is loaded and presend in _G
When now an issue inside a script is, calls FlywithLua on C side a luaL_dostring (line 7536)

image

Source:

https://github.com/X-Friese/FlyWithLua/blob/master/src/FlyWithLua.cpp

After i create a failure inside a "Module" as example i got this:

Couldn't activate file '/Volumes/SSD2go PKT/X-Plane 11 stable/Resources/plugins/FlyWithLua/flywithlua_debug()' for debugging; continuing without it.

And see nothing more, but the Debugger is always running, but can`t see where

Thanks in advance !
Greetings Lars

Edit: Sorry I forgot to write that I expected at least a step in here.
VERSIONS --> ZeroBrane Studio (1.90; MobDebug 0.706)

In all other cases is this what i use then to catch my issue afterwards:

-- Works like pcall(), but invokes the debugger on an error.
function dbg_call(f, ...)
	return xpcall(f, function(err)
    require("mobdebug").start()
    print( "ERROR: ", err )
		return err
	end, ...)
end


dbg_call(function()
	-- Put some buggy code in here:
    local toast = require("toast")
end)

can't run the examples

Hi, I meet a problem when run the examples server.lua && start.lua
I have lua5.1.
The connection established correctly, But the client side can not receive the "STEP\n" sent by the listener(client:send("STEP\n")),
then, it would be blocked at the receive() function forever.

  1. I tried to send something from client to server, the server can receive it correctly.
  2. I also tried to write some test code with lua socket 2.0.2 which send data from server to client, every thing works fine.so it should not be a lua socket issue.

overwriting debug.traceback corrupts the lua global environment

I tried to integrate MobDebug into Cocos2d-x lua in my game.
But I found that MobDebug overwrites the debug.traceback function.
Both Cocos2d-x (v3.10) and my code use debug.traceback (see cocos2d/functions.lua for example). This causes conflicts.
Change behavior of a common function is not a best practice, I think.
Why not just provide another function (i.e. mob.traceback)?

Debugging lua scripts within mpv , crashes

Hi Paul,

-I copied the mobdebug.lua under /usr/local/share/lua/5.1
-Created foo.lua in /opt/ZeroBraneStudio-1.90/myprograms so it is reachable by zbstudio with this content
require('mobdebug').start()
lineforthebreakpoint=1
I installed the plugin autostart from https://github.com/pkulchenko/ZeroBranePackage/blob/master/autostartdebug.lua
cp autostartdebug.lua /opt/ZeroBraneStudio-1.90/packages

then launched zbstudio
i put the dummy breakpoint on lineforthebreakpoint and it works when I run , it switches into debug and halts on this line

BUT if i trigger this from mpv latest relying on LuaJIT 2.1.0-beta3

mpv 0.33.0-209-gf2afae55e9 Copyright © 2000-2020 mpv/MPlayer/mplayer2 projects
built on Sun Jul 4 14:32:32 CEST 2021
FFmpeg library versions:
libavutil 56.70.100
libavcodec 58.134.100
libavformat 58.76.100
libswscale 5.9.100
libavfilter 7.110.100
libswresample 3.9.100
FFmpeg version: n4.4-78-g031c0cb0b4
then the call mpv --script=foo.lua bar.mp4 gives me Segmentation fault

Any idea Sir?

can not eval ... varargs in lua5.4.x

local function test_varargs(p1, ... )
    --
    local arg = {...}
    print(p1, ...)
end
test_varargs("1", 2, "你好", "SONY", 3.14)

put a breakpoint in the follow line

print(p1, ...)

when the breakpoint is triggered,
add watch '...' will get a result as
image
, but if use lua5.2-5.3 and luajit it will get a result as
image

Avoid os.exit()

There are several places in mobdebug.lua where os.exit() called (on error, or debug session end).
I need somehow avoid this in order to continue normal client execution.

Breakpoints never hit

I use IDEA to debug my mobile Lua program
image
When using the default port 8172, the Android client cannot connect to my IDEA, so I use port 8082, because of this port, I have used adb to link it.
But when everything is ready and IDEA shows "Connected",
No breakpoint is hit
image
Where the code will run, the breakpoint will not hit.
Has anyone encountered this problem?
thank

Start and off method

My use case now is work with server which creates separate coroutine for each request.
So code looks like this

mobdebug.coro()
mobdebug.start()
mobdebug.off()
function handler() -- this function calls in coro
  mobdebug.on()
  .... 
  mobdebug.off()
end

In this case I have small inconvenience.
Debugger interrupt execution of main thread just after mobdebug.start() returns.
But I really do not need this. I just need only connect to debugger and then
just turn on debugger in some functions.
So I suggest add one more argument to start
In my system i implement it just like if off then mobdebug.off() end before return true
inside start function and use it like

mobdebug.coro()
mobdebug.start(nil, nil, true)
function handler()
  mobdebug.on()
  .... 
  mobdebug.off()
end

Could not connect to localhost:8172: connection refused

My issue is similar to this one: #4

However, I did use the correct Lua version (5.1) from the beginning.

I compiled both LuaJIT-2.0.3 and the latest luasocket (3.0 rc1) with MinGW and embedded both into our application.
This is how luasocket is embedded (put into preload):

lua_getfield(_luascript->get_ptr(), LUA_GLOBALSINDEX, "package");
lua_getfield(_luascript->get_ptr(), -1, "preload");
lua_pushcfunction(_luascript->get_ptr(), luaopen_socket_core);
lua_setfield(_luascript->get_ptr(), -2, "socket.core");

The application is linked against the "socket.dll.3.0-rc1" (which is the weirdest name ever for a DLL...) and loads it just fine when the application starts.

I have also copied mobdebug.lua into our scripts folder. However, I get the error in the description as soon as I require("mobdebug").start().

I wanted to use luasocket-2.0.2 instead, but it seems that it cannot be compiled in MinGW without serious hassle, so I stopped trying.

mobdebug suddenly gets out of sync

In a project (which relies heavily on copas an coroutines) mobdebug suddenly shows these lines, however keeps on working - but verly slow as these lines are repeated permanently.
How can I track down this bug?

INFO 2019-09-13 09:30:40 ...Public\Lua\ZeroBraneStudio\lualibs/mobdebug/mobdebug.lua:187: attempt to call field '__tostring' (a nil value)
stack traceback:
c:\lua\systree\share\lua\5.1\coxpcall.lua:35: in function 'pcall'
...Public\Lua\ZeroBraneStudio\lualibs/mobdebug/mobdebug.lua:187: in function 'val2str'
...Public\Lua\ZeroBraneStudio\lualibs/mobdebug/mobdebug.lua:224: in function 'val2str'
...Public\Lua\ZeroBraneStudio\lualibs/mobdebug/mobdebug.lua:248: in function <...Public\Lua\ZeroBraneStudio\lualibs/mobdebug/mobdebug.lua:147>
INFO 2019-09-13 09:30:40 ...Public\Lua\ZeroBraneStudio\lualibs/mobdebug/mobdebug.lua:188: attempt to call field '__serialize' (a nil value)
stack traceback:
c:\lua\systree\share\lua\5.1\coxpcall.lua:35: in function 'pcall'
...Public\Lua\ZeroBraneStudio\lualibs/mobdebug/mobdebug.lua:188: in function 'val2str'
...Public\Lua\ZeroBraneStudio\lualibs/mobdebug/mobdebug.lua:224: in function 'val2str'
...Public\Lua\ZeroBraneStudio\lualibs/mobdebug/mobdebug.lua:248: in function <...Public\Lua\ZeroBraneStudio\lualibs/mobdebug/mobdebug.lua:147>
Debugging session completed (traced 1 instruction).

Give users full direct control over path mapping

Please admit that it is a completely unrealistic fantasy to believe that path mapping between vastly different environments (development environment with checked-out monorepo source tree vs. docker container with highly optimized directory layout, container-only .d -> .avail style symlinks etc. etc.) can be solved entirely automatically.

Users must be allowed to take full control in this area when necessary.

Please provide user configurable multi path mapping as a first-class feature in ZBS/MobDebug. Please do it instead of forcing users to report issues and corner cases time and again and again and again so you can continue to tweak your autoresolver further and further and further and further.

I just came back to working on our Lua codebase after two months, and I understand NOTHING of the hacks I was forced to employ back in July to work around the limitations in ZBS/MobDebug's automatic path resolution. The whole odyssey is logged in the latter comments in this issue. I did things like changing entries in LUA_PATH from absolute to relative, something that I shouldn't have to do. I arrived at an elusive understanding of what needs to be done and why after inspecting the debugger/debugge communication, inspecting the debuggee module source code, and going through several rounds of communication with you, none of which should be a prerequisite to being able to stop on breakpoints.

Give us control!

Fail with Lua binaries Max OSX Snow Leopard

I have a Lua binaries 5.1 compiled with Lua socket 2.02.
I have in the current directory the CompleteLua(Lua binary with socket complie with xcode 4) and the moddebug.lua and all the test files.

./CompleteLua mobdebug.lua
will come out with no error. Then from the > propmt of the interpreter I type

require("mobdebug").listen("*", 8171)
Lua Remote Debugger
Run the program you wish to debug
./mobdebug.lua:866: attempt to call field 'bind' (a nil value)
stack traceback:
./mobdebug.lua:866: in function 'listen'
stdin:1: in main chunk
[C]: ?

Debugger connection closed after some commands

Using the version from the master branch (by the way, it would be great to have 0.62 available through Luarocks), the debugger exits without any errors after running any of exec, listw, listb and help. On the side of the program being debugged I get

lua: test.lua: Debugger connection closed
stack traceback:
    [C]: in function 'error'
    ./mobdebug.lua:665: in function <./mobdebug.lua:505>
    test.lua:5: in main chunk
    [C]: ?

Update luarocks please... :)

The latest LuaRocks version is not compatible with Lua 5.4 and thus breaks when trying to use it with ZBS. Thanks!

调试请教-how debug

您好!
我想Windows上使用IDEA远程调试Linux上的openresty的lua程序。
widow上IntelliJ IDEA 2018.2.1+EmmyLua 1.2.6-IDEA182
Linux上程序test.lua中加入了:
local mobdebug = require("src.initial.mobdebug");
mobdebug.start(8172);

但是我不清楚Linux是作为服务端监听8172,Windows上使用idea作为客户端连接Linux的8172端口?原理是怎样的?如何使用呢?谢谢!

Hello!
I want to use IDEA on Windows to remotely debug the openresty lua program on Linux.
Widow on IntelliJ IDEA 2018.2.1+EmmyLua 1.2.6-IDEA182
The program test.lua on Linux has been added:
local mobdebug = require("src.initial.mobdebug");
mobdebug.start(8172);

But I don't know Linux is listening to 8172 as a server, and using IDE as a client to connect to Linux port 8172 on Windows? What is the principle? How to use it? Thank you!

Can't debug scripts running on mobile devices

The path to scripts in mobile applications are different from the one in my development machine. Worse, it changes on each build at least on iOS devices.

I tried to add a command to MobDebug to specify a regex pattern to transform local file paths in the mobile devices into paths that ZeroBrane Studio could find in the development's machine file system, but failed to make it work.

It would be nice if remote debugging of scripts running on remote machines with different file paths was supported. I can give it another try with some guidance on how to implement it properly.

Wrong display (console and in site comment) when a table has two equal references

I thought there was a problem with lua but in fact, everything works fine, it is only a question of wrong display of the console or of the in situ comments.
Here is an example :

arrFunc={function(x) return 10*x end}
arrFunc[2]=arrFunc[1]

In the console in response to the question :
arrFunc
the answer :
{function() --[[..skipped..]] end --[[function: 0x1371060]], nil --[[ref]]} --[[table: 0x1371150]] --[[incomplete output with shared/self-references skipped]]
"nil" is incorrect.
print(type(arrFunc[2]) gives "function" (rather strange for a nil)
Moreover arrFunc2 gives 30 (again not in line with a "nil") but shows that it is working fine in lua.

The same phenomenon is true for another type of reference as a table, as in :

arrRef[1]=arrFunc
arrRef[2]=arrFunc

Version : 1.7 ; MobDebug 0.702
OS : Ubuntu LTS 14.04

Feature Request: Pop Out Stack Frame, Break On Function Call

Often, when I am debugging, I want to have either

A: a breakpoint on a function call so that I can see where a function is called and what values it is called with

or

B: the ability to pop backwards a stack frame so I can retry the function with different arguments.

Are either of these possible, and if so, do you have any advice as to how they might be implemented? Thank you.

ZBS for Darktable on windows 64bits

I'm trying to figure out how to use ZBS for Darktable plugins o Windows.
The start of the module is like this:

local dt = require "darktable"
local debug = require "darktable.debug"
package.cpath = "C:/Program Files/darktable/bin/lua53.dll;"..package.cpath
package.cpath = "C:/Documents/Darktable/lua/luasocket/socket/core.dll;"..package.cpath
package.cpath = "C:/Documents/Darktable/lua/luasocket/mime/core.dll;"..package.cpath
package.path = package.path..";C:/Program Files (x86)/ZeroBraneStudio/lualibs/mobdebug/mobdebug.lua"
require('mobdebug').start()

And I get the following error.

LUA ERROR : error loading module 'socket' from file 'C:/Program Files (x86)/ZeroBraneStudio/lualibs/mobdebug/mobdebug.lua':
	...iles (x86)/ZeroBraneStudio/lualibs/mobdebug/mobdebug.lua:222: too many C levels (limit is 200) in function at line 176 near 'value'

If I remove the darktable debug option the plugin doesn't start neither.
Could you help fix this ?

ZBS: 1.70; MobDebug 0.70
Darktable 2.41
Windows 10
core.dll : the 64bits ones provided by you on a separate link.

Improve nginx/Openresty debugging

I hereby challenge you to screencast and publish a video that demonstrates:

  • your product, ZeroBrane studio
  • in a remote debugging session,
  • successfully stepping through and stopping on breakpoints in openresty Lua code
  • that uses modebug.lua debuggee library
  • and runs in request context (as oposed to merely init_by_lua_*)
  • in relatively recent openresty (not a version from 2014 when you wrote your tutorial)
  • in a Docker container
  • on a Linux host

If you cannot produce this video, then you should add exceptions to your published claims that ZBS supports openresty.

I have sunk thousands of dollars worth of my work time over the last year-and-a-half trying to achieve usable step debugging of openresty Lua code. Mere listing of different error messages I have seen could fill a book. Had I been officially warned that my platform (or openresty in general) is not supported, I would have invested that time into developing alternative strategies for debugging.

I am currently convinced that neither ZBS nor mobdebug specifically can possibly work with a modern openresty, and your claims that they do amount to false advertising. In my extensive Googling I haven't seen a single crumb of evidence that it ever worked for anyone. Will you be able to convince me otherwise? All it takes is actual demonstration.

Implicit load std lua libraries.

I use host application which just register std libraries loaders.
So when MobDebug try use table library i get error.

--
-- MobDebug 0.542
-- Copyright 2011-13 Paul Kulchenko
-- Based on RemDebug 1.0 Copyright Kepler Project 2005
--

local coroutine = require "coroutine"
local io        = require "io"
local os        = require "os"
local string    = require "string"
local table     = require "table"

local mobdebug = {

How can i use this with Love2d?

I'd like to use mobdebug in vscode but not sure how to install and get it to work. (Sorry, i'm new to computer science and programming)

Recommend Projects

  • React photo React

    A declarative, efficient, and flexible JavaScript library for building user interfaces.

  • Vue.js photo Vue.js

    🖖 Vue.js is a progressive, incrementally-adoptable JavaScript framework for building UI on the web.

  • Typescript photo Typescript

    TypeScript is a superset of JavaScript that compiles to clean JavaScript output.

  • TensorFlow photo TensorFlow

    An Open Source Machine Learning Framework for Everyone

  • Django photo Django

    The Web framework for perfectionists with deadlines.

  • D3 photo D3

    Bring data to life with SVG, Canvas and HTML. 📊📈🎉

Recommend Topics

  • javascript

    JavaScript (JS) is a lightweight interpreted programming language with first-class functions.

  • web

    Some thing interesting about web. New door for the world.

  • server

    A server is a program made to process requests and deliver data to clients.

  • Machine learning

    Machine learning is a way of modeling and interpreting data that allows a piece of software to respond intelligently.

  • Game

    Some thing interesting about game, make everyone happy.

Recommend Org

  • Facebook photo Facebook

    We are working to build community through open source technology. NB: members must have two-factor auth.

  • Microsoft photo Microsoft

    Open source projects and samples from Microsoft.

  • Google photo Google

    Google ❤️ Open Source for everyone.

  • D3 photo D3

    Data-Driven Documents codes.