Most teams believe Story Points are something you MUST do as part of any Agile framework. This is a Power BI template to challenge this notion, allowing you the ability to connect to your Jira, Azure DevOps, Azure DevOps Server and/or TFS data and see the correlation (or not!) of story points.
-
Download the appropriate template file:
-
For the Jira version:
- Follow these steps to setup a Jira API token and note it down (e.g. copy/paste into Notepad)
- You will need to know the 'customfield_xxxxx' value for story points, you can get this by going to https://'your-jira-instance'.atlassian.net/rest/api/3/field (replace 'your-jira-instance' with what it actually is) and then identifying the field that represents Story Points. Look for the field with a name similar to "Story Points" or "Story Point," and note its ID. It will be something like 'customfield_10000'
-
Then you're good to get started!
- Open the .pbit file
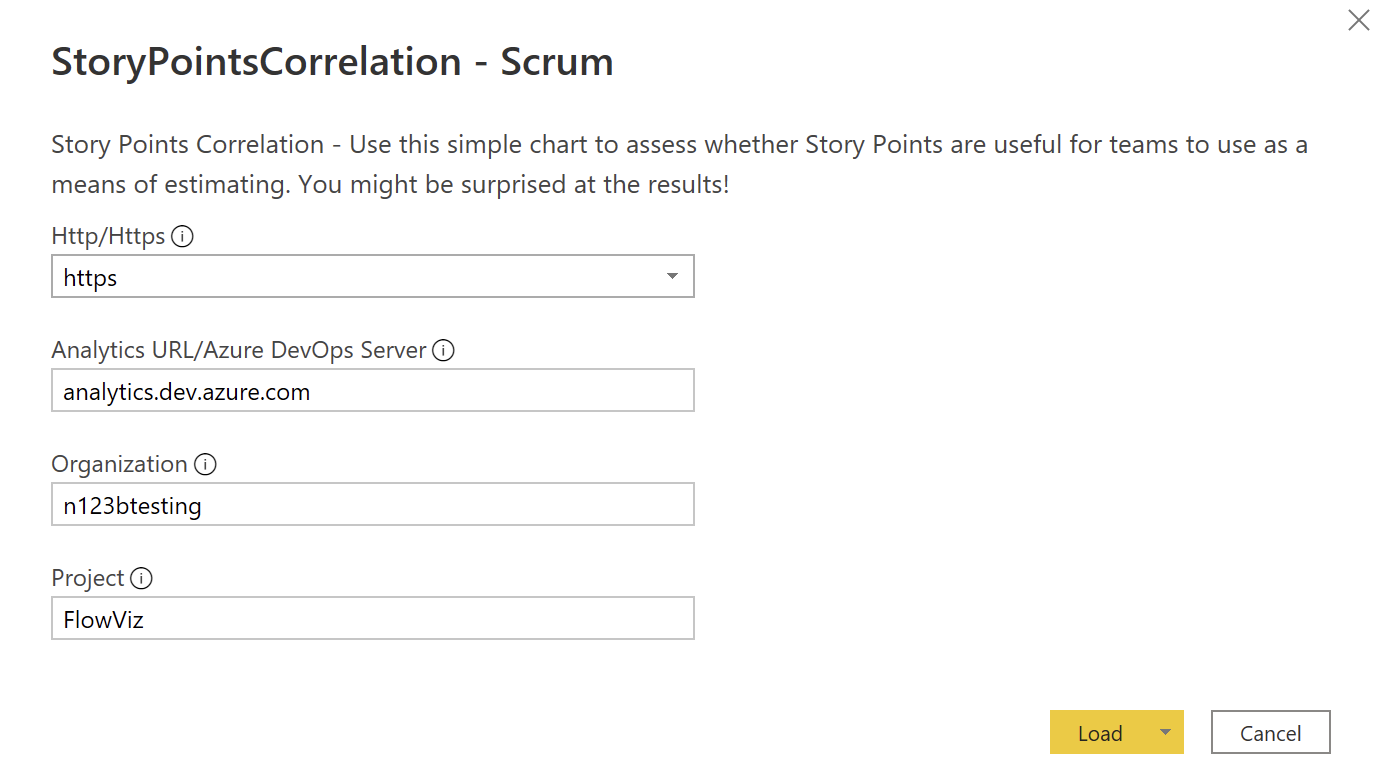
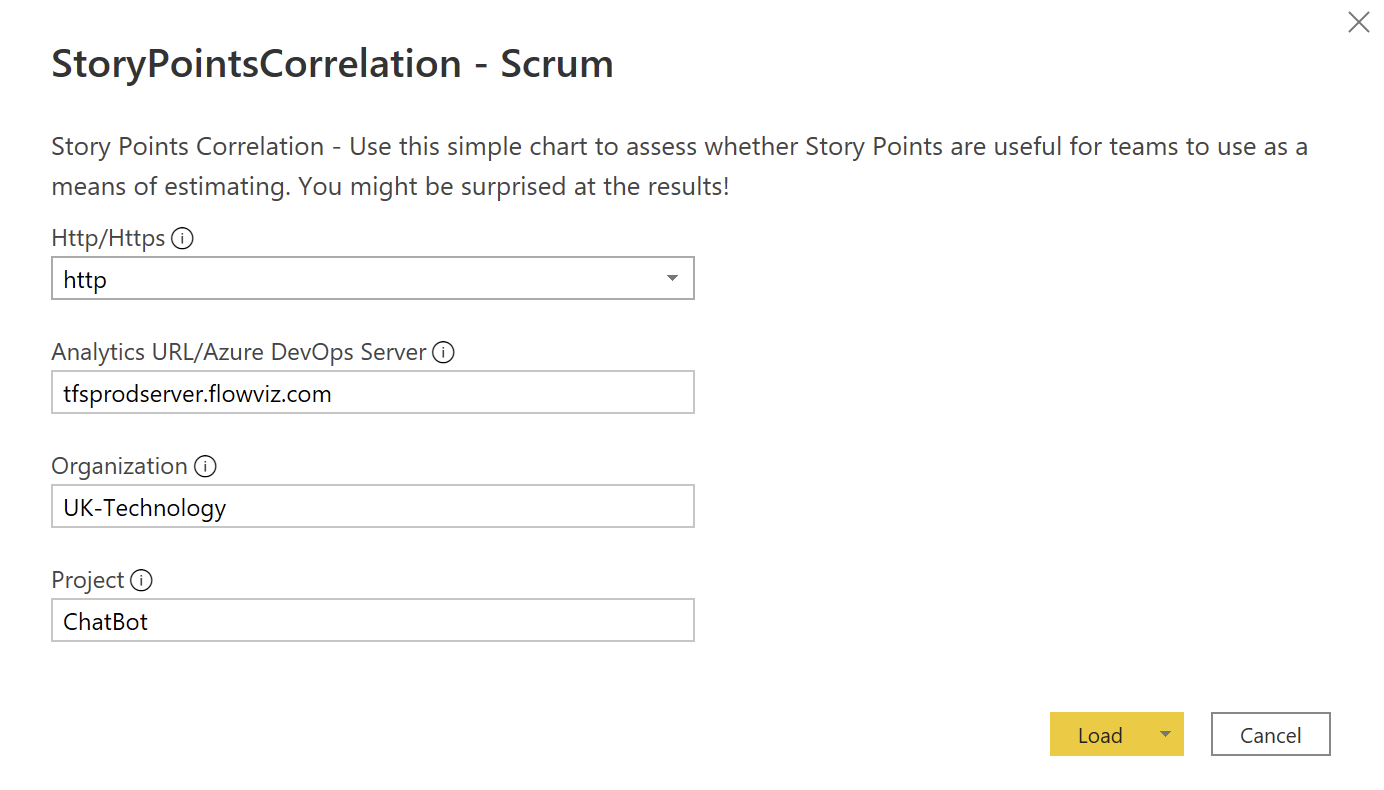
- Select http/https (only choose http if your Azure DevOps Server is HTTP)
- Add the Analytics / Azure DevOps Server URL - for Azure DevOps services enter 'analytics.dev.azure.com' / for Azure DevOps Server enter your server details
- Add your organization and project name
Don't confuse the team name with the project name, a common mistake. If the URL you use is "http://dev.azure.com/Microsoft-UK/AzureDevOpsTeam/Database", then Microsoft-UK is the Organization Name, AzureDevOpsTeam is the Project name, Database is the team name.
- It should then look something like this:
Azure DevOps Services:
Azure DevOps Server:
-
Hit 'Load'
-
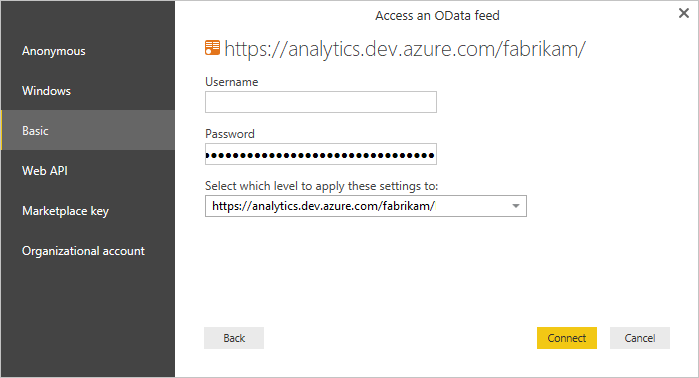
If you are prompted for a login, you can choose:
- 'Organizational' and enter your Organization email/password (if required) and sign in
- 'Basic' and use a Personal Access Token (PAT) to login, entering it in the password field (user can be left as blank)
-
Once signed in hit 'Load' and wait for your charts to populate!
-
Open the .pbit file in Power BI Desktop
-
Add your Jira URL
-
Add your Jira Project Key(s) - don't confuse the project name with the project key, a common mistake! Your project key will be in the URL when viewing an item.
-
Add your field value for story points
-
It should then look something like this:

- For multiple projects, it should look like:

- Hit 'Load'
- You will be prompted for a login, choose Basic and enter:
- Your email associated with your Jira account for your username
- Your API token you created in the Prerequisities
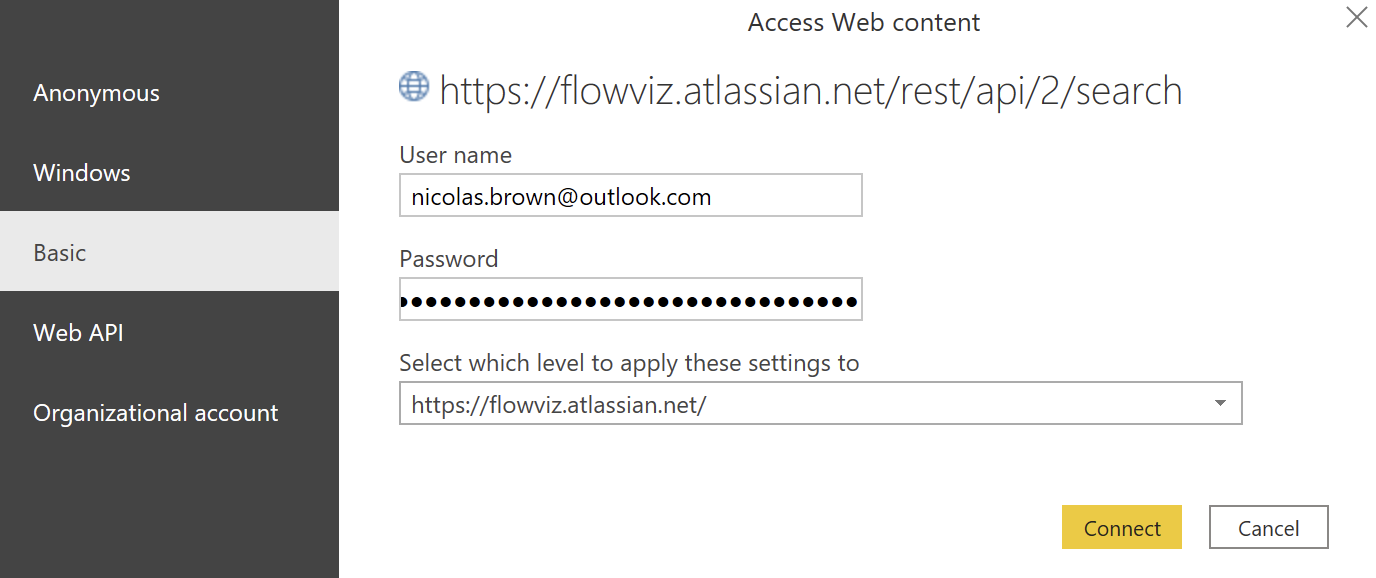
- Then hit 'Connect' and wait for the data and charts to load!


Example of looking at multiple teams data and story point correlation with the best result seen (note: not comparing teams to each other!)