Coder Social home page Coder Social logo

microsoft / vscode-python Goto Github PK

View Code? Open in Web Editor NEW

This project forked from donjayamanne/pythonvscode

4.2K 173.0 1.1K 153.34 MB

Python extension for Visual Studio Code

Home Page: https://aka.ms/pvsc-marketplace

License: MIT License

Python 10.54% TypeScript 88.78% JavaScript 0.45% HTML 0.01% Jupyter Notebook 0.17% Roff 0.01% Dockerfile 0.01% Shell 0.02% PowerShell 0.01%

vscode-python's Introduction

Python extension for Visual Studio Code

A Visual Studio Code extension with rich support for the Python language (for all actively supported Python versions), providing access points for extensions to seamlessly integrate and offer support for IntelliSense (Pylance), debugging (Python Debugger), formatting, linting, code navigation, refactoring, variable explorer, test explorer, and more!

Support for vscode.dev

The Python extension does offer some support when running on vscode.dev (which includes github.dev). This includes partial IntelliSense for open files in the editor.

Installed extensions

The Python extension will automatically install the following extensions by default to provide the best Python development experience in VS Code:

  • Pylance - to provide performant Python language support
  • Python Debugger - to provide a seamless debug experience with debugpy

These extensions are optional dependencies, meaning the Python extension will remain fully functional if they fail to be installed. Any or all of these extensions can be disabled or uninstalled at the expense of some features. Extensions installed through the marketplace are subject to the Marketplace Terms of Use.

Extensibility

The Python extension provides pluggable access points for extensions that extend various feature areas to further improve your Python development experience. These extensions are all optional and depend on your project configuration and preferences.

If you encounter issues with any of the listed extensions, please file an issue in its corresponding repo.

Quick start

Set up your environment

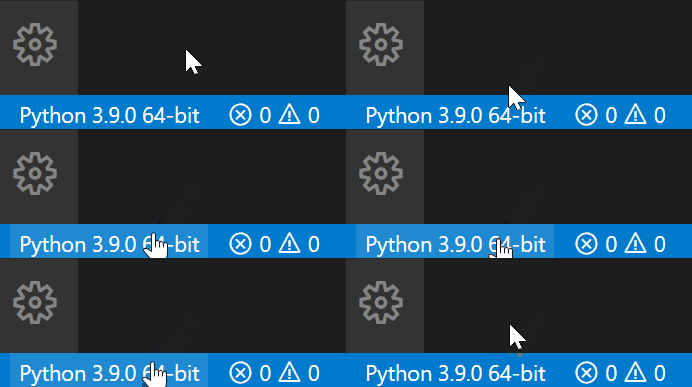
  • Select your Python interpreter by clicking on the status bar
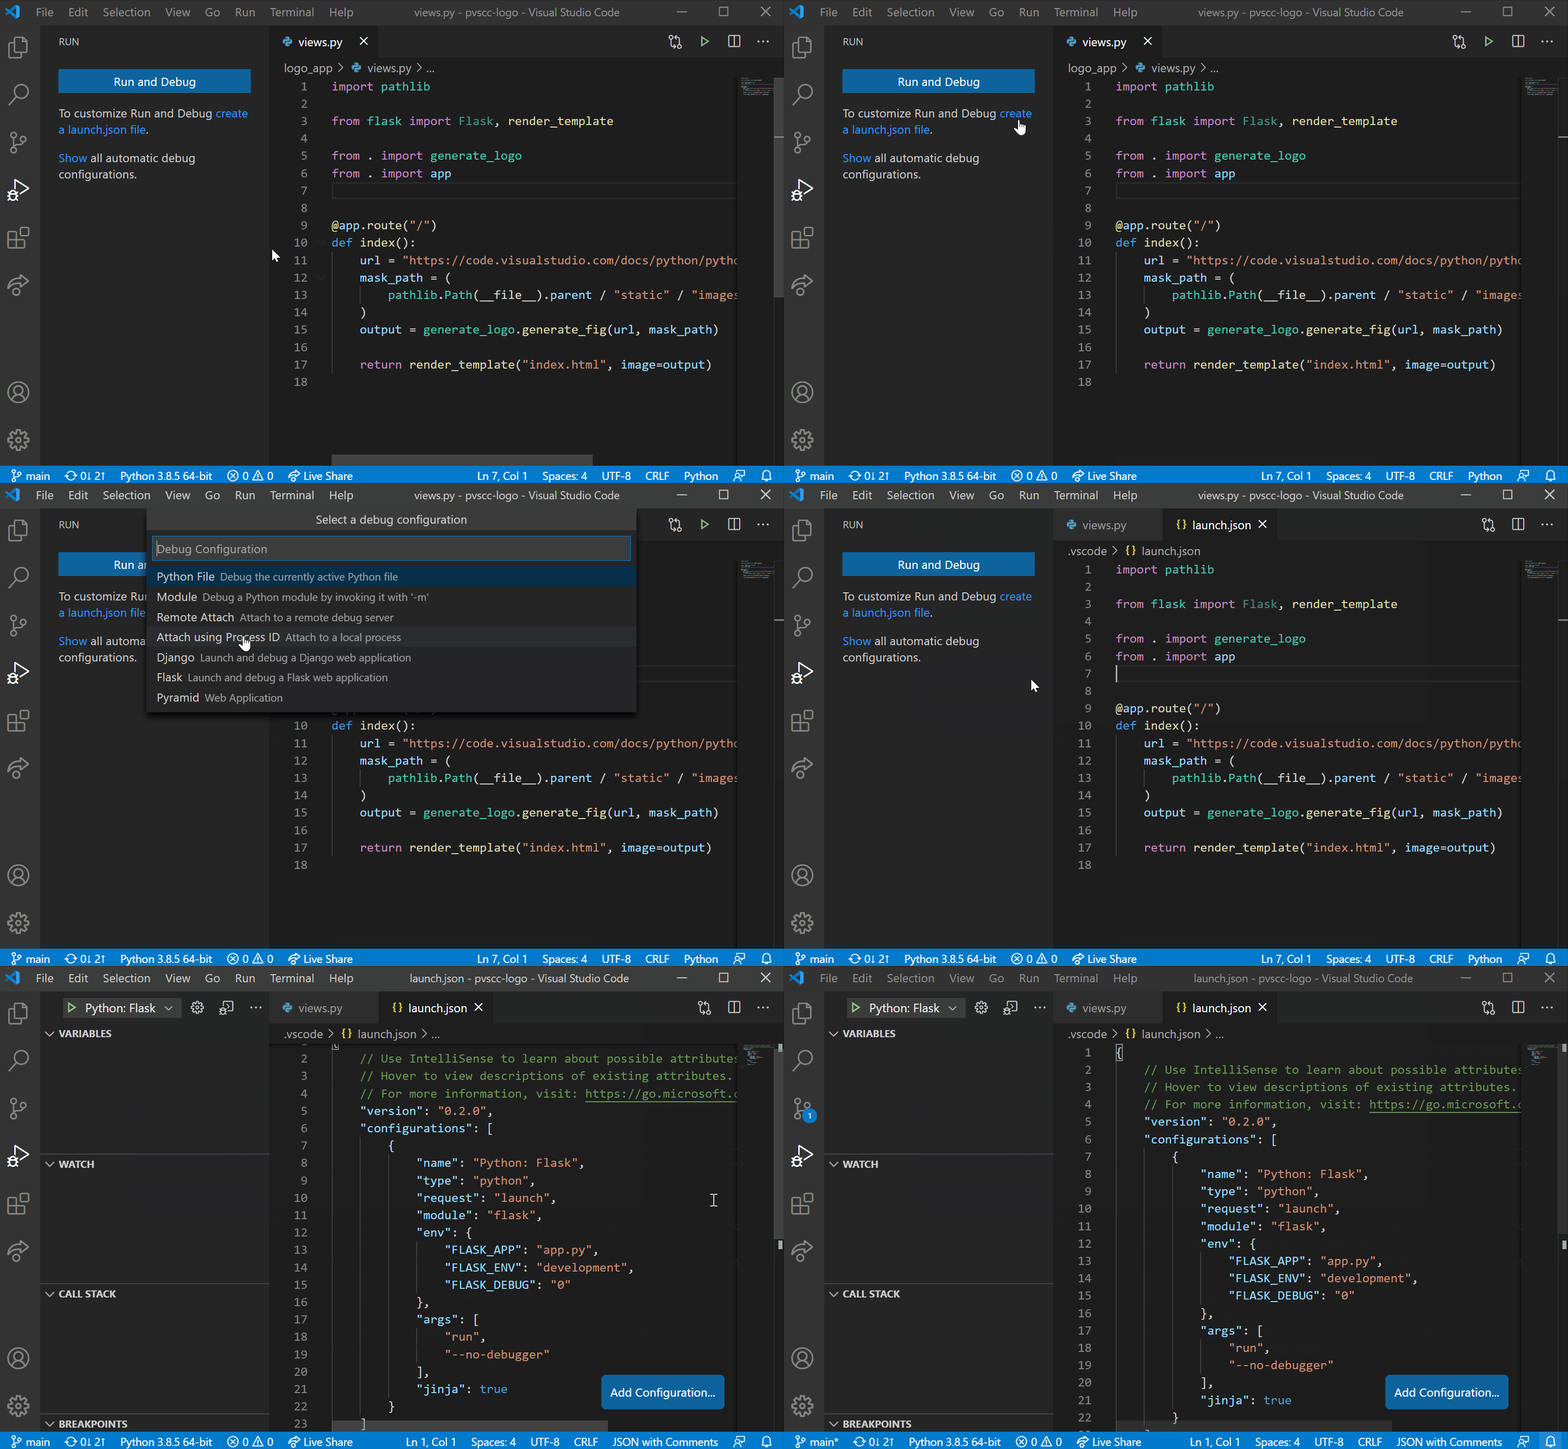
  • Configure the debugger through the Debug Activity Bar
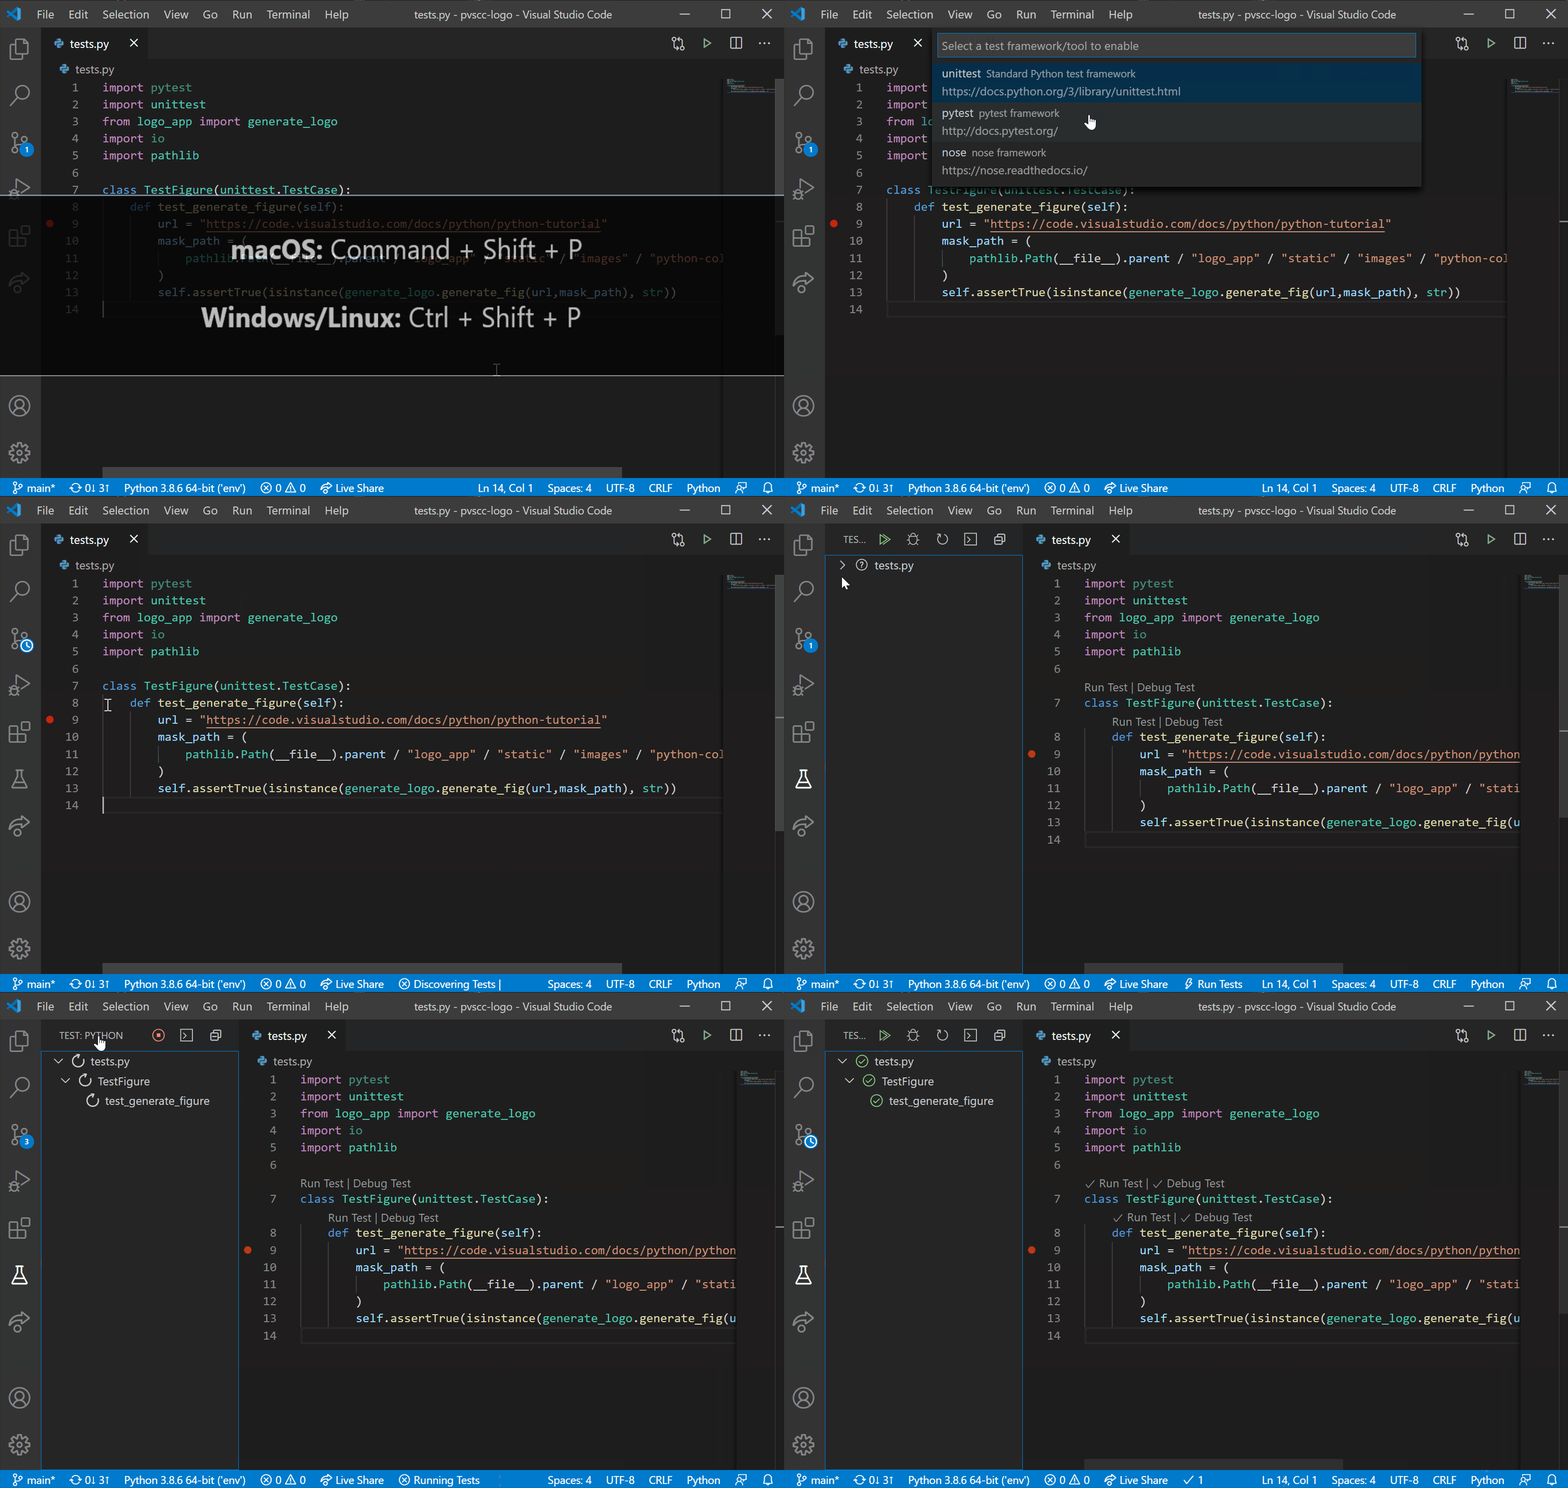
  • Configure tests by running the Configure Tests command

Jupyter Notebook quick start

The Python extension offers support for Jupyter notebooks via the Jupyter extension to provide you a great Python notebook experience in VS Code.

  • Install the Jupyter extension.

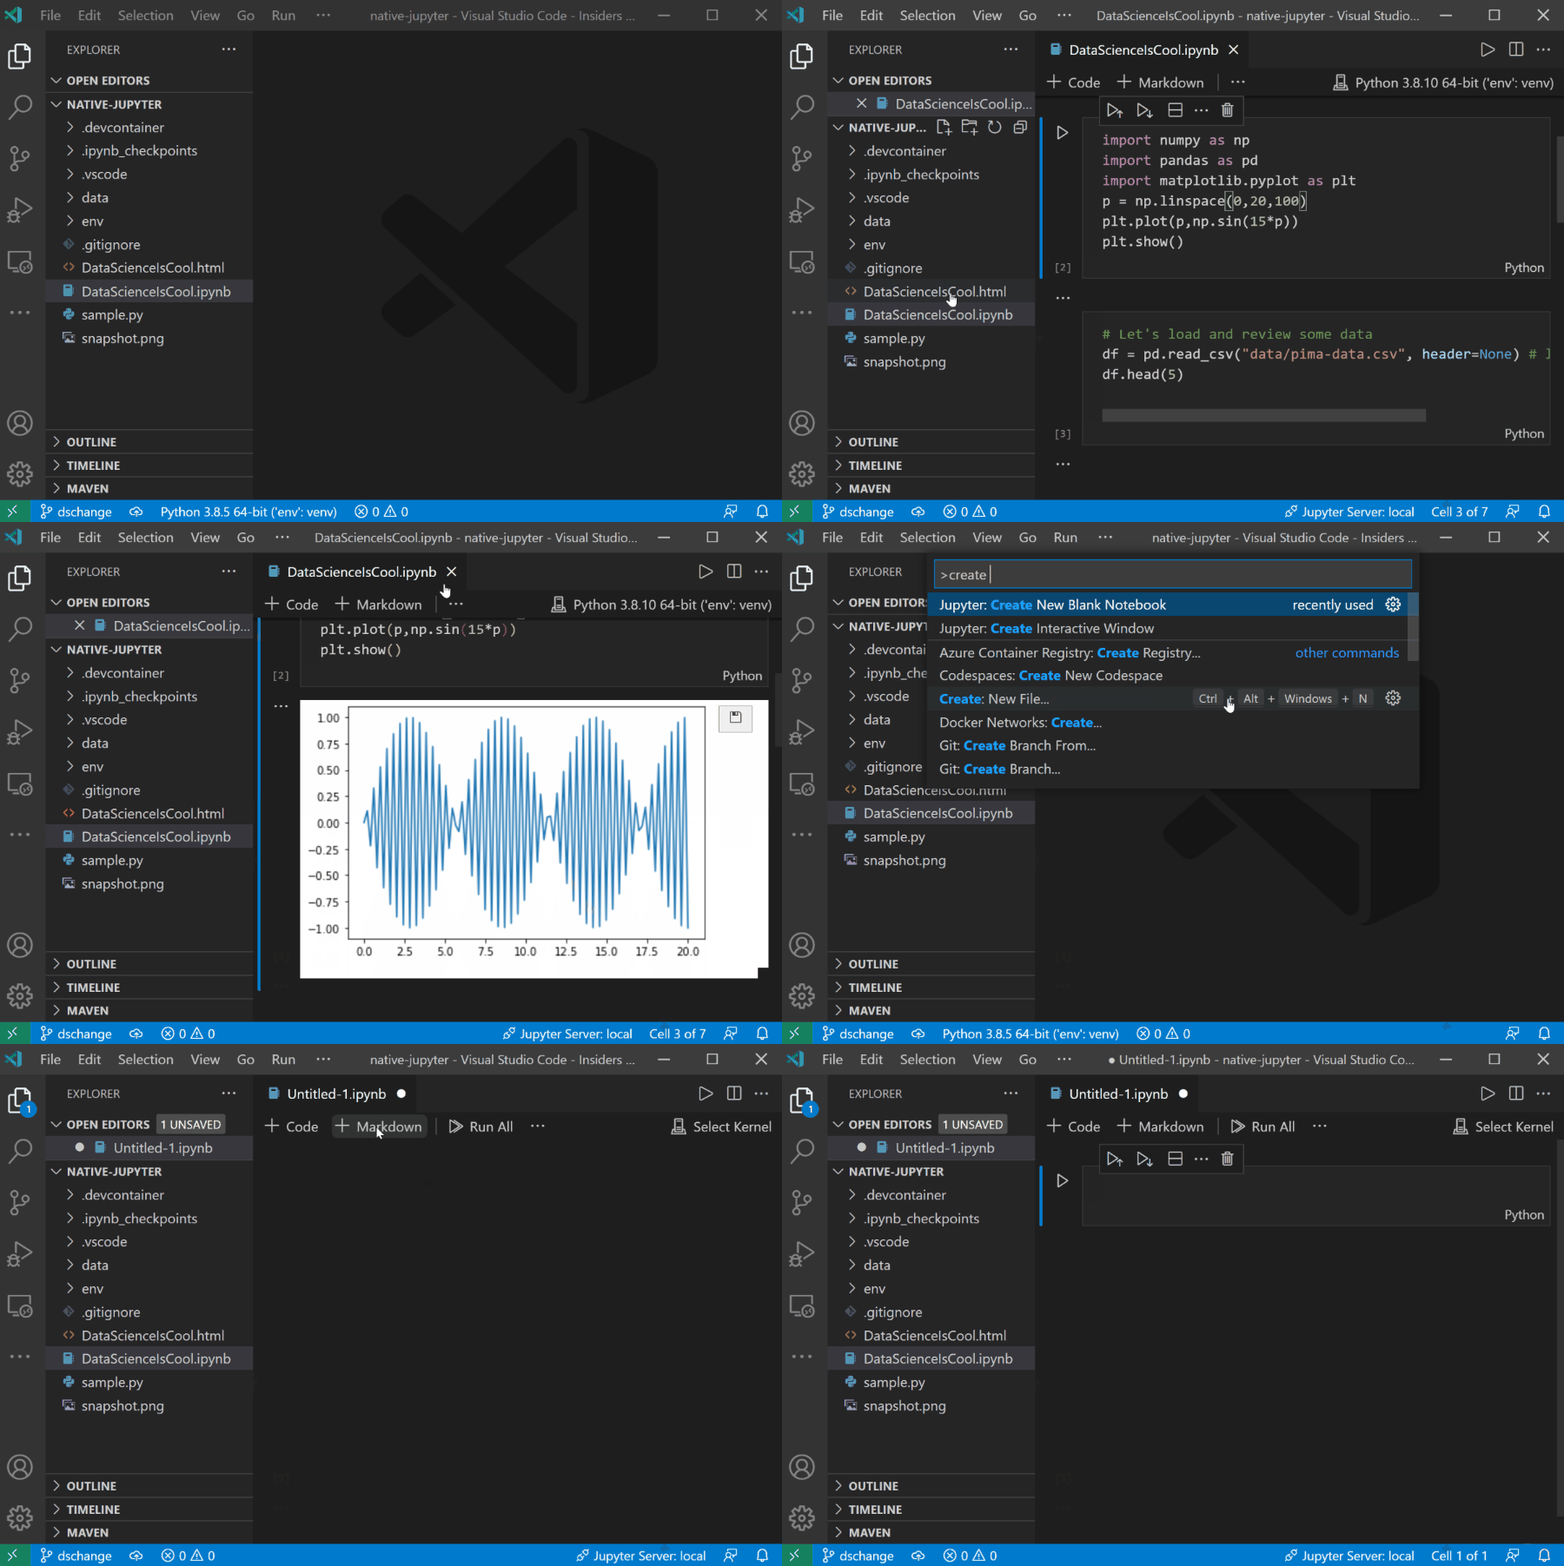
  • Open or create a Jupyter Notebook file (.ipynb) and start coding in our Notebook Editor!
For more information you can:

Useful commands

Open the Command Palette (Command+Shift+P on macOS and Ctrl+Shift+P on Windows/Linux) and type in one of the following commands:

Command Description
Python: Select Interpreter Switch between Python interpreters, versions, and environments.
Python: Start REPL Start an interactive Python REPL using the selected interpreter in the VS Code terminal.
Python: Run Python File in Terminal Runs the active Python file in the VS Code terminal. You can also run a Python file by right-clicking on the file and selecting Run Python File in Terminal.
Python: Configure Tests Select a test framework and configure it to display the Test Explorer.

To see all available Python commands, open the Command Palette and type Python. For Jupyter extension commands, just type Jupyter.

Feature details

Learn more about the rich features of the Python extension:

  • IntelliSense: Edit your code with auto-completion, code navigation, syntax checking and more
  • Linting: Get additional code analysis with Pylint, Flake8 and more
  • Code formatting: Format your code with black, autopep or yapf
  • Debugging: Debug your Python scripts, web apps, remote or multi-threaded processes
  • Testing: Run and debug tests through the Test Explorer with unittest or pytest.
  • Jupyter Notebooks: Create and edit Jupyter Notebooks, add and run code cells, render plots, visualize variables through the variable explorer, visualize dataframes with the data viewer, and more
  • Environments: Automatically activate and switch between virtualenv, venv, pipenv, conda and pyenv environments
  • Refactoring: Restructure your Python code with variable extraction and method extraction. Additionally, there is componentized support to enable additional refactoring, such as import sorting, through extensions including isort and Ruff.

Supported locales

The extension is available in multiple languages: de, en, es, fa, fr, it, ja, ko-kr, nl, pl, pt-br, ru, tr, zh-cn, zh-tw

Questions, issues, feature requests, and contributions

  • If you have a question about how to accomplish something with the extension, please ask on our Discussions page.
  • If you come across a problem with the extension, please file an issue.
  • Contributions are always welcome! Please see our contributing guide for more details.
  • Any and all feedback is appreciated and welcome!
    • If someone has already filed an issue that encompasses your feedback, please leave a ๐Ÿ‘/๐Ÿ‘Ž reaction on the issue.
    • Otherwise please start a new discussion.
  • If you're interested in the development of the extension, you can read about our development process.

Data and telemetry

The Microsoft Python Extension for Visual Studio Code collects usage data and sends it to Microsoft to help improve our products and services. Read our privacy statement to learn more. This extension respects the telemetry.enableTelemetry setting which you can learn more about at https://code.visualstudio.com/docs/supporting/faq#_how-to-disable-telemetry-reporting.

vscode-python's People

Stargazers

 avatar  avatar  avatar  avatar  avatar  avatar  avatar  avatar  avatar  avatar  avatar  avatar  avatar  avatar  avatar  avatar  avatar  avatar  avatar  avatar  avatar  avatar  avatar  avatar  avatar  avatar  avatar  avatar  avatar  avatar  avatar  avatar  avatar  avatar  avatar  avatar  avatar  avatar  avatar  avatar  avatar  avatar  avatar  avatar  avatar  avatar  avatar  avatar  avatar  avatar  avatar  avatar  avatar  avatar  avatar  avatar  avatar  avatar  avatar  avatar  avatar  avatar  avatar  avatar  avatar  avatar  avatar  avatar  avatar  avatar  avatar  avatar  avatar  avatar  avatar  avatar  avatar  avatar  avatar  avatar  avatar  avatar  avatar  avatar  avatar  avatar  avatar  avatar  avatar  avatar  avatar  avatar  avatar  avatar  avatar  avatar  avatar  avatar  avatar  avatar

Watchers

 avatar  avatar  avatar  avatar  avatar  avatar  avatar  avatar  avatar  avatar  avatar  avatar  avatar  avatar  avatar  avatar  avatar  avatar  avatar  avatar  avatar  avatar  avatar  avatar  avatar  avatar  avatar  avatar  avatar  avatar  avatar  avatar  avatar  avatar  avatar  avatar  avatar  avatar  avatar  avatar  avatar  avatar  avatar  avatar  avatar  avatar  avatar  avatar  avatar  avatar  avatar  avatar  avatar  avatar  avatar  avatar  avatar  avatar  avatar  avatar  avatar  avatar  avatar  avatar  avatar  avatar  avatar  avatar  avatar  avatar  avatar  avatar  avatar  avatar  avatar  avatar  avatar  avatar  avatar  avatar  avatar  avatar  avatar  avatar  avatar  avatar  avatar  avatar  avatar  avatar  avatar  avatar  avatar  avatar  avatar  avatar  avatar  avatar  avatar  avatar

vscode-python's Issues

SQLAlchemy Model Object Unlinting

Environment data

VS Code version: 1.18.0
Python Extension version: 0.8.0
Python Version: 3.5
OS and version: Linux Ubuntu

Actual behavior

Errors during development, but running python works normally. In case the imported db is a class that returns SQLAlchemy()
image
image

Expected behavior

Do not display code inconsistency for cases like the one presented above.

Steps to reproduce:

  • Create db.py
    from flask_sqlalchemy import SQLAlchemy
    db = SQLAlchemy()

  • Use this importing db in the model class and declare the variables the way I presented in the print above.

Python crashes while debugging

From @roblourens on October 26, 2016 22:16

Simple script, debugging with the system's python3.5, and when i step all the way to the end, it says "python quit unexpectedly". Not sure why or whether there's anything you can do about it. Right now it's happening about 2/3 times.

image

Copied from original issue: DonJayamanne/pythonVSCode#465

Error "Cannot read property 'openConfigFile' of undefined" when starting python program without the debugger

Environment data

VS Code version: 1.18.0
Python Extension version: 0.8.0
Python Version: 2.7.14
OS and version: Windows 10

Actual behavior

Press Ctrl+F5 to start a python program without the debugger, and VS Code displays the error
"Cannot read property 'openConfigFile' of undefined"

F5 to start with the debugger works fine.

Expected behavior

Should just start the program. It always did with Python Extension 0.7.0, which I had been using for some time.

Steps to reproduce:

Start any python program inside version 0.8.0 of this extension, without the debugger.

Logs

No output

How to get all parameter info when filling in a function param list

From @horserma on December 22, 2016 0:48

  • VSCode Version:1.8.1
  • OS Version:MAC OS

Hi guys, I am using vscode for writing python code. I found when I tried to fill in a function with parameters, the hint will be shown one by one instead of all. For example, if the function has 3 parameters, the hint will show the first one first and after I fill in it and write a comma, the second will be triggered. I just want to show them all to get clear what parameters I am going to fill in. Any suggestions?

Copied from original issue: DonJayamanne/pythonVSCode#598

vscode-python 0.8.0 makes all debugging services of vscode 1.18 non-working

Environment data

VS Code version: 1.18
Python Extension version: 0.8.0
Python Version: 3.6.3
OS and version: Windows_NT x64 10.0.15063

Actual behavior

Once the extension is enabled everything in vscode related to debugging (Start Debugging, Open Configurations etc.) stops working. All other languages (e.g. C++) are affected as well. Disabling vscode-python extension restores normal operation. It worked before upgrade to 1.18/0.8.0 without a problem.

Expected behavior

Working debug

Steps to reproduce:

  • Select from menu Debug -> Open Configurations. Nothing happens.

Logs

Output from Python output panel

(none printed where)

Output from Console window (Help->Developer Tools menu)

(none printed where)

RFE: Support Remote Interpreter

From @satyenr on May 13, 2016 3:37

The ability to run code on a remote machine is awesome. You can develop on a Windows PC or a Mac while running and debugging on a remote Linux server. PyCharm supports such a feature - https://www.jetbrains.com/help/pycharm/2016.1/configuring-remote-python-interpreters.html.

Having a remote interpreter also helps when the remote machine already has a functional Python environment - possibly managed by someone else - which you don't want to/can't replicate on your local machine.

Copied from original issue: DonJayamanne/pythonVSCode#123

Arguments tab defaults to collapsed when debugging

I'm not %100 sure if this is the place for this issue. However, I don't think it's a general issue with VS Code because of what was said in this issue.

Environment data

VS Code version: 1.17.2
Python Extension version: 0.7.0
Python Version: 3.6.2
OS and version: Windows 10 Home, 1703

Actual behavior

When debugging, the "Arguments" tab inside VARIABLES defaults to closed.
image

Expected behavior

Arguments are pretty important, perhaps this should default to open, like it does for local variables? Or at least have an option to toggle this behaviour.

Steps to reproduce:

Debug any Python program

Logs

Output from Python output panel

Output from Console window (Help->Developer Tools menu)

image

Debug django application

Hello,
I reopen my issue here since it has been removed on the last repo.

Environment data

VS Code version: 1.18.0
Python Extension version: 0.8.0
Python Version: 3.5
OS and version: Ubuntu 16.04

Actual behavior

I am not able to debug a django application with a postgres database

Expected behavior

I should be able to debug a django application with a postgres database

Steps to reproduce:

  • create a django project
  • in your django settings, define the "DATABASE" variable with a connection to a postgres database
  • launch your application in debug mode
  • the debug mode does not hold, it just starts then stops

Logs

Output from Python output panel
there is no output
Output from Console window (Help->Developer Tools menu)

/usr/share/code/resources/app/out/vs/workbench/workbench.main.js:9 [/home/johndoe/.vscode/extensions/ms-vscode.cpptools-0.14.2]: La commande 'workbench.action.gotoSymbol' apparaรฎt plusieurs fois dans la section 'commands'.
/usr/share/code/resources/app/out/vs/workbench/workbench.main.js:9 [/home/johndoe/.vscode/extensions/ms-vscode.cpptools-0.14.2]: La commande 'workbench.action.showAllSymbols' apparaรฎt plusieurs fois dans la section 'commands'.
/usr/share/code/resources/app/out/vs/workbench/workbench.main.js:9 [Extension Host] vscode-icons is active!
/usr/share/code/resources/app/out/vs/workbench/workbench.main.js:9 [Extension Host] activating extension
/usr/share/code/resources/app/out/vs/workbench/workbench.main.js:9 [Extension Host] rejected promise not handled within 1 second
t.log @ /usr/share/code/resources/app/out/vs/workbench/workbench.main.js:9
/usr/share/code/resources/app/out/vs/workbench/workbench.main.js:10 spawn ctags ENOENTย : Error: spawn ctags ENOENT
	at exports._errnoException (util.js:1050:11)
	at Process.ChildProcess._handle.onexit (internal/child_process.js:193:32)
	at onErrorNT (internal/child_process.js:367:16)
	at _combinedTickCallback (internal/process/next_tick.js:80:11)
	at process._tickCallback (internal/process/next_tick.js:104:9)
e.onUnexpectedError @ /usr/share/code/resources/app/out/vs/workbench/workbench.main.js:10
console.ts:123 [Extension Host] (node:9600) DeprecationWarning: os.tmpDir() is deprecated. Use os.tmpdir() instead.
t.log @ console.ts:123
t._logExtensionHostMessage @ extensionHost.ts:377
(anonymous) @ extensionHost.ts:202
emitTwo @ events.js:106
emit @ events.js:194
process.nextTick @ internal/child_process.js:766
_combinedTickCallback @ internal/process/next_tick.js:73
_tickCallback @ internal/process/next_tick.js:104

Debug adapter process has terminated unexpectedly

From @zeus on January 7, 2017 17:23

Environment data

VS Code version: 1.8.1
Python Extension version: 0.5.5
Python Version: 2.7.13
OS and version: Windows 10
Your launch.json (if dealing with debugger issues):

        {
        
            "name": "Attach (Remote Debug)",
            "type": "python",
            "request": "attach",
            "localRoot": "${workspaceRoot}",
            "remoteRoot": "${workspaceRoot}",
            "port": 4000,
            "secret": "my_secret",
            "host":"localhost"
        }

Your settings.json:

Logs

Output from Python output panel

None

Output from Console window (Help->Developer Tools menu)

index.js:22 [uncaught exception]: Error: TypeError: Cannot read property 'Threads' of undefined
    at PythonDebugger.threadsRequest (C:\Users\zeus\.vscode\extensions\donjayamanne.python-0.5.5\out\client\debugger\Main.js:321:27)
    at PythonDebugger.DebugSession.dispatchRequest (C:\Users\zeus\.vscode\extensions\donjayamanne.python-0.5.5\node_modules\vscode-debugadapter\lib\debugSession.js:421:22)
    at PythonDebugger.ProtocolServer._handleData (C:\Users\zeus\.vscode\extensions\donjayamanne.python-0.5.5\node_modules\vscode-debugadapter\lib\protocol.js:104:38)
    at Socket.<anonymous> (C:\Users\zeus\.vscode\extensions\donjayamanne.python-0.5.5\node_modules\vscode-debugadapter\lib\protocol.js:24:60)
    at emitOne (events.js:96:13)
    at Socket.emit (events.js:188:7)
    at readableAddChunk (_stream_readable.js:176:18)
    at Socket.Readable.push (_stream_readable.js:134:10)
    at Pipe.onread (net.js:543:20)onError @ index.js:22(anonymous function) @ index.js:91emitOne @ events.js:96emit @ events.js:188window.onerror @ C:\Program Files (x86)\Microsoft VS Code\resources\electron.asar\renderer\init.js:120i.globals.onerror @ errorTelemetry.ts:64
index.js:25 Error: TypeError: Cannot read property 'Threads' of undefined
    at PythonDebugger.threadsRequest (C:\Users\zeus\.vscode\extensions\donjayamanne.python-0.5.5\out\client\debugger\Main.js:321:27)
    at PythonDebugger.DebugSession.dispatchRequest (C:\Users\zeus\.vscode\extensions\donjayamanne.python-0.5.5\node_modules\vscode-debugadapter\lib\debugSession.js:421:22)
    at PythonDebugger.ProtocolServer._handleData (C:\Users\zeus\.vscode\extensions\donjayamanne.python-0.5.5\node_modules\vscode-debugadapter\lib\protocol.js:104:38)
    at Socket.<anonymous> (C:\Users\zeus\.vscode\extensions\donjayamanne.python-0.5.5\node_modules\vscode-debugadapter\lib\protocol.js:24:60)
    at emitOne (events.js:96:13)
    at Socket.emit (events.js:188:7)
    at readableAddChunk (_stream_readable.js:176:18)
    at Socket.Readable.push (_stream_readable.js:134:10)
    at Pipe.onread (net.js:543:20)
    at file:///C:/Program Files (x86)/Microsoft VS Code/resources/app/out/vs/workbench/electron-browser/workbench.main.js:90:21136
    at Object.v [as _notify] (file:///C:/Program Files (x86)/Microsoft VS Code/resources/app/out/vs/workbench/electron-browser/workbench.main.js:32:13263)
    at Object.enter (file:///C:/Program Files (x86)/Microsoft VS Code/resources/app/out/vs/workbench/electron-browser/workbench.main.js:32:16768)
    at _run (file:///C:/Program Files (x86)/Microsoft VS Code/resources/app/out/vs/workbench/electron-browser/workbench.main.js:32:18089)
    at _error (file:///C:/Program Files (x86)/Microsoft VS Code/resources/app/out/vs/workbench/electron-browser/workbench.main.js:32:17606)
    at file:///C:/Program Files (x86)/Microsoft VS Code/resources/app/out/vs/workbench/electron-browser/workbench.main.js:85:1178
    at _.e.dispatch (file:///C:/Program Files (x86)/Microsoft VS Code/resources/app/out/vs/workbench/electron-browser/workbench.main.js:85:2523)
    at _.e.handleData (file:///C:/Program Files (x86)/Microsoft VS Code/resources/app/out/vs/workbench/electron-browser/workbench.main.js:85:2035)
    at Socket.<anonymous> (file:///C:/Program Files (x86)/Microsoft VS Code/resources/app/out/vs/workbench/electron-browser/workbench.main.js:85:1038)
    at emitOne (events.js:96:13)
    at Socket.emit (events.js:188:7)

Actual behavior

Debug adapter process has terminated unexpectedly

Expected behavior

Attach to simple process

Steps to reproduce:

  • Simple program:
#!/usr/bin/env python
import ptvsd
ptvsd.enable_attach("my_secret", address=('0.0.0.0', 4000))
ptvsd.wait_for_attach()
t = 1+1
  • Run
  • Run Debug, failed

Other

Connected from MS VS 2015 successfully.
Can't connect from VSC with 'attach' option. 'Launch' works fine.

Copied from original issue: DonJayamanne/pythonVSCode#626

Debug alway hit a breakpoint on lib/python3.6/imp.py

Environment data

VS Code version: 1.18
Python Extension version: 0.8.0
Python Version: 3.6.0
OS and version: OsX 10.13.1

Every time I debug a file the debugger hit a breakpoint at env/asyncPython/lib/python3.6/imp.py
screen shot 2017-11-10 at 12 53 19 pm

Implement auto imports

One of the few missing features is to have auto imports.

Something like what was just released in vscode 1.18 for javascript would be great.

[Debugger] Cursor of type psycopg2.extras.DictCursor returns None when fetching

From @sevetseh28 on August 31, 2016 14:40

cur = conn.cursor(cursor_factory=psycopg2.extras.DictCursor)
cur.execute(sql_query)
row = cur.fetchone()

Doing that returns None even if there is one record in the query result. Tried running the exact same code and debugging it with PyCharm and I get the correct result in the row variable.
If I create the normal cursor

cur = conn.cursor()
cur.execute(sql_query)
row = cur.fetchone()

row is not None in the VS Code debugger, so there is clearly a bug with the DictCursor type.

Copied from original issue: DonJayamanne/pythonVSCode#279

Find and utilise WSL Python Environments

From @kuza55 on November 18, 2016 14:58

Since windows processes can now call bash.exe to call processes in the WSL subsystem, it would be nice if VS code could:

a) Be configured to utilise a python interpreter inside WSL through bash.exe
b) Automatically find WSL virtualenvs in the current project and let the user use them easily

Making the Jupyter integration work in this scenario would also be very cool.

Copied from original issue: DonJayamanne/pythonVSCode#534

Command select python interpreter doesn't list all of the installed python interpreters on system, including those on virtual environment

Environment data

VS Code version: 1.19.0-insider
Python Extension version: 0.8.0
Python Version: 2.7.12, 3.5.2, 3.6.3
OS and version: Ubuntu 16.04

Actual behavior

As I mention above, I have three python version installed on my computer, but the only python that shows up when running command python: select interpreter is python 2.7.12. See picture bellow.
Extension also will only list python 2.7.12 + the one that I already set on workspace configuration file (manually).

image

Expected behavior

It should list all three python version, including those that running on virtual environment

"Select interpreter" does not support direnv environments

Environment data

VS Code version: 1.18 insiders
Python Extension version: 0.8.0
Python Version: 3.6
OS and version: macOS 10.13.2

Actual behavior

Python binary (${workspaceRoot}/.direnv/python-3.6.3/bin/python) is not on the list.

Expected behavior

Python binary should be listed.

Steps to reproduce:

  • install and enable direnv (https://direnv.net/)
  • create an .envrc file with layout python3 or layout python as its contents
  • run direnv allow
  • launch Code
  • run the "Python: Select interpreter" command

Python: 'Start without debugging shortcutโ€™ has a problem.

From @weqopy on November 9, 2017 13:32

  • VSCode Version: 1.18
  • OS Version: macOS High Sierra 10.13.1

Steps to Reproduce:

  1. Set "stopOnEntry" to false in launch.json
  2. run python file with debug, it returns result fast, run it again, the result disappears and returns again
  3. but when use 'ctrl + F5' to run it without debug, it's not end in fact as these two screenshots show, and there will be no response when I try to run it again with or without debug.

2017-11-09 21 22 40

2017-11-09 21 22 49

4. click the debug in status bar and runs it, VS Code returns this:

2017-11-09 21 30 51

5. At last, I have to use cmd+Q to quit Code and restart it

Reproduces without extensions: Yes/No

Copied from original issue: microsoft/vscode#37946

Missing modules

Getting "ImportError: No module named 'pymongo'" after recent update. Is the extension suddenly defaulting to using venv? Why? And how do I get rid of that?

installing pep8 fails

Environment data

VS Code version:
Python Extension version:
Python Version:
OS and version:
ubuntu 17.10
anaconda python 3.6.3

Actual behavior

/home/yolen/Desktop/data-analysis/azureenv/bin/python -m pip install pep8
yolen@yolen-ThinkPad-X260:~/Desktop/data-analysis$ /home/yolen/Desktop/data-analysis/azureenv/bin/python -m pip install pep8
Traceback (most recent call last):
  File "/home/yolen/scicomp/anaconda3/lib/python3.6/runpy.py", line 183, in _run_module_as_main
    mod_name, mod_spec, code = _get_module_details(mod_name, _Error)
  File "/home/yolen/scicomp/anaconda3/lib/python3.6/runpy.py", line 142, in _get_module_details
    return _get_module_details(pkg_main_name, error)
  File "/home/yolen/scicomp/anaconda3/lib/python3.6/runpy.py", line 109, in _get_module_details
    __import__(pkg_name)
  File "/home/yolen/Desktop/data-analysis/azureenv/lib/python3.6/site-packages/pip/__init__.py", line 28, in <module>
    from pip.vcs import git, mercurial, subversion, bazaar  # noqa
  File "/home/yolen/Desktop/data-analysis/azureenv/lib/python3.6/site-packages/pip/vcs/mercurial.py", line 9, in <module>
    from pip.download import path_to_url
  File "/home/yolen/Desktop/data-analysis/azureenv/lib/python3.6/site-packages/pip/download.py", line 36, in <module>
    from pip.utils.glibc import libc_ver
  File "/home/yolen/Desktop/data-analysis/azureenv/lib/python3.6/site-packages/pip/utils/glibc.py", line 4, in <module>
    import ctypes
  File "/home/yolen/scicomp/anaconda3/lib/python3.6/ctypes/__init__.py", line 7, in <module>
    from _ctypes import Union, Structure, Array
ImportError: /home/yolen/Desktop/data-analysis/azureenv/lib/python3.6/lib-dynload/_ctypes.cpython-36m-x86_64-linux-gnu.so: undefined symbol: _PyUnicode_AsWideCharString
yolen@yolen-ThinkPad-X260:~/Desktop/data-analysis$ ^C
yolen@yolen-ThinkPad-X260:~/Desktop/data-analysis$

Expected behavior

Steps to reproduce:

Logs

Output from Python output panel

Output from Console window (Help->Developer Tools menu)

Use pylint for selected python version

Environment data

VS Code version: 1.18.0
Python Extension version: 0.8.0
Python Version: 2.7/3.6
OS and version: Windows 7 x64

Actual behavior

  1. Open python script for version 2.7 (e.g. print 'Hello, world!')
  2. Select python version 3.6
  3. Don't see parentheses missing error

Expected behavior

See errors for selected version of python

Steps to reproduce:

  • See Actual behavior

Logs

Output from Python output panel

##########Linting Output - pylint##########

No config file found, using default configuration

Output from Console window (Help->Developer Tools menu)

Function argument hint only shows one argument, expect whole signature (and optionally docstring)

Environment data

VS Code version: 1.18.0
Python Extension version: 0.8.0
Python Version: 2.7.14
OS and version: Linux, Gentoo

Actual behavior

When writing code, the popup when typing the opening bracket of a function only has one argument and no documentation information.

image

Expected behavior

It would be great to have the popup more like the hover window, so that I can see the whole signature and perhaps have an option to display the docstring too.

image

Steps to reproduce:

  • Open Python file.
  • Write a function name and an opening bracket

This has been brought up before in https://github.com/DonJayamanne/pythonVSCode/issues/598

Jump to failed tests

From @tillahoffmann on December 20, 2016 12:31

It would be great if it was possible to jump to the failing line in a test from the "Python Test Log" console in the IDE.

Copied from original issue: DonJayamanne/pythonVSCode#596

Python file does not get executed in Python terminal when the terminal is not clean

Environment data

VS Code version: 1.18.0
Python Extension version: 0.8.0
Python Version: 3.6
OS and version: Windows 10

Actual behavior

Python file does not get executed in Python terminal

Expected behavior

Python file gets executed in Python terminal

Steps to reproduce:

  • Run a python file in terminal using "Python: Run Python File in Terminal"
  • Write something in the terminal after the file executes
  • Run a python file in terminal again
  • Due to the text left in the terminal, the file won't get executed.

Logs

Output from Python console

T:\a>python t:/a/a.py
hello world!

T:\a>text_left_herepython t:/a/a.py
'text_left_herepython' is not recognized as an internal or external command,
operable program or batch file.

Usecase

This is a problem for me because I use a lot of key bindings, sometimes the terminal is in focus and my shortcuts are written in the terminal (for example ^A). I need the builtin terminal for a few commands. Unfortunately if you type in a chain command command1 && command2 the first command gets executed and the second one will be merged with python.

PS: One can easily delete python and the .py file, if "rm " is written in the Python terminal then "Python: Run Python File in Terminal" is called. (Don't Try This at Home)

VSCode Changelog links to old repo

Environment data

VS Code version: 1.18
Python Extension version: 0.8.0
Python Version: x
OS and version: Win 10 1703 x64

Actual behavior

Set to: https://github.com/DonJayamanne/pythonVSCode/issues/1188

Expected behavior

Upon clicking Fix docstring formatting #1188 in the extension changelog (in VSCode, after clicking Upgrade but before clicking Reload) Take me to issue in proper Repo.

Steps to reproduce:

  • Upgrade
  • Click on an issue.

Feature request: Add support to pydevd

On the old repo was an issue regarding a slow behavior of ptvsd, especially with remote debugging. I think was a pull request pending, by the way.

Can we expect support for other debuggers like pydevd? (Standard debugger on PyCharm, very fast)

Thank you, and congratulations on joining MS VSCode Team.

flake8 finds tons of syntax errors and undefined names in the extension's code

$ python2 -m flake8 . --count --select=E901,E999,F821,F822,F823 --show-source --statistics

  • 16 E999 SyntaxError: invalid syntax
  • 73 F821 undefined name 'kernel_manager'
  • 89

$ python3 -m flake8 . --count --select=E901,E999,F821,F822,F823 --show-source --statistics

  • 24 E999 SyntaxError: invalid syntax
  • 85 F821 undefined name 'kernel_manager'
  • 109

Autocompletion triggered inside strings and comments

Environment data

VS Code version: 1.18.0
Python Extension version:
Python Version: 0.8.0
OS and version: Ubuntu 16.04 based Linux and Windows 10

Actual behavior

vscode tries to provide auto complete suggestions inside python strings every time period is pressed. This doesn't happen in c/c++ files, don't know about other file types. Also comments doesn't seem to be affected.

Settings tweaks tested with no effect:

  • "editor.quickSuggestions": {"other": false, "comments": false, "strings": false}
  • "editor.wordBasedSuggestions": false

Period triggered suggestions are pretty messed up in general, e.g. typing 1. results in suggestion list and, if, in, is, not, or. Very useful.

Expected behavior

Strings shouldn't be treated as code in general. Let me write docstrings in peace.

Steps to reproduce:

  1. Create new file
  2. Select language mode: Python
  3. Type ".

Logs

Nothing related.

Performance of Code Completion for LARGE files

Environment data

VS Code version: 1.18.0
Python Extension version: 0.7.0
Python Version: 3.6.0
OS and version: Microsoft Windows [Version 10.0.15063]

Actual behavior

I've written a tool that given a tabular data structure with many thousands of columns creates a new Python class definition (into a .py file). The resulting Python file is used by data scientists to access the columns of the data structure in a programmatic way.

Each column results in generated code in this pattern currently:

@property
def color(self):
    """
    This is the documentation.
    This is the second line of documentation
    """
    return DataColumn(self, 'COLOR')

For generated files with hundreds of columns, the VS Code Python extension works spectacularly. However, for large files, it slows to a crawl. For example, one data structure results in a Python file with 40,000+ lines.

When using code completion in VS Code, it takes 20+ seconds to show the list of properties. Needless to say, that's too slow. And unfortunately, it's not a one time cost as every instantiation of the code completion feature causes the same delay.

I can adjust the output of the my code generation tool, but I don't know what I could do to reduce the parse time for code completion.

I did experiment and removed the documentation from the Python file and that had very little if any noticeable effect on the time taken to show matches.

Expected behavior

Fast code completion suggestion list (under 1 second).

Steps to reproduce:

Super large python file with class with thousands of properties is needed. I've created this public gist with an example.

Logs

Output from Python output panel
Empty.
Output from Console window (Help->Developer Tools menu)
Empty

No option to select Anaconda root

Environment data

VS Code version: 1.18.0
Python Extension version: 0.8.0
Python Version: Python 3.6.3 :: Anaconda, Inc.
OS and version: Mac OS 10.13.1

Actual behavior

Interpreter selection does not include the Anaconda root Python (located at ~/anaconda3/bin/python) when VSCode is launched from the Applications folder. It only includes the default Apple Python and the Anaconda conda environments (located at ~/anaconda3/envs//bin/python). Anaconda is not in my default PATH. If I launch VSCode from the command line with Anaconda in my PATH then it does appear in the list of interpreters.

Expected behavior

Root Anaconda Python should always be available to select from the interpreter selection menu

Steps to reproduce:

  • Do not have Anaconda Python in your default PATH
  • Launch VSCode normally from the Applications folder
  • Open Python interpreter selection menu by clicking on Python version at bottom left of window. Anaconda root will not appear in the list.

Logs

Output from Python output panel

----------Generating Tags----------
ctags --options=/Users/mfairley/.vscode/extensions/ms-python.python-0.8.0/resources/ctagOptions --languages=Python --exclude=**/site-packages/** -o /Users/mfairley/Source/cs238/.vscode/tags .
/Library/Developer/CommandLineTools/usr/bin/ctags: illegal option -- -
usage: ctags [-BFadtuwvx] [-f tagsfile] file ...

Linting with pylint failed.
You could either install the 'pylint' linter or turn it off in setings.json via "python.linting.pylintEnabled = false".
Error: Command failed: /usr/bin/python -m pylint --msg-template='{line},{column},{category},{msg_id}:{msg}' --reports=n --output-format=text /Users/mfairley/Source/cs238/p2/python/deep_learning.py
/usr/bin/python: No module named pylint

Output from Console window (Help->Developer Tools menu)

[Extension Host] Linter 'pylint' not installed.
t.log @ workbench.main.js:sourcemap:9
workbench.main.js:sourcemap:9 [Extension Host] (node:19853) DeprecationWarning: os.tmpDir() is deprecated. Use os.tmpdir() instead.
t.log @ workbench.main.js:sourcemap:9
t._logExtensionHostMessage @ workbench.main.js:sourcemap:9
(anonymous) @ workbench.main.js:sourcemap:9
emitTwo @ events.js:106
emit @ events.js:194
process.nextTick @ internal/child_process.js:766
_combinedTickCallback @ internal/process/next_tick.js:73
_tickCallback @ internal/process/next_tick.js:104

Path translation when using WSL bash in integrated terminal

Environment data

VS Code version: 1.18.0
Python Extension version: 0.8.0
Python Version: 3.6.3
OS and version: Windows 10 v1709 build 16299.19

Actual behavior

/usr/bin/python3 d:/Web/test.py

Expected behavior

/usr/bin/python3 /mnt/d/Web/test.py

Steps to reproduce:

  • In settings.json, add WSL and set python path to the one installed on WSL
  • "terminal.integrated.shell.windows": "C:\\WINDOWS\\System32\\bash.exe"
  • "python.pythonPath": "/usr/bin/python3"
  • Run Python File in Terminal

Logs

Output from Python output panel

/usr/bin/python3: can't open file 'd:/Web/test.py': [Errno 2] No such file or directory

Feature request: (line) profiler

From @vidartf on December 15, 2016 12:25

Add a profiler, preferably a line profiler which can overlay its output on top of source (in own view, or on top of existing source?).

Copied from original issue: DonJayamanne/pythonVSCode#580

Feature suggestion: inline coverage reporting

From @sfermigier on January 16, 2017 11:28

Issue #183 being now closed, here's an independent issue for a feature suggestion that I find really important: inline reports for coverage.py results (or pytest --cov, etc.).

Copied from original issue: DonJayamanne/pythonVSCode#647

Can't stop linter

Environment data

VS Code version: 1.19 Insider
Python Extension version: 0.8.0
Python Version: 3.6.1
OS and version: Windows 10 1709

Actual behavior

Do nothing.

Expected behavior

When I push Disable Linter, stop linter and write disable option to settings.json

Steps to reproduce:

  • create python file.
  • save file.

operationimage

ctag with space in path

Environment data

VS Code version: Code 1.18.0 (dcee2202709a4f223185514b9275aa4229841aa7, 2017-11-08T12:44:48.751Z)
Python Extension version: 0.8
Python Version: 2.17.2
OS and version: Ubuntu 16.04
$ ctags --version
Exuberant Ctags 5.9~svn20110310, Copyright (C) 1996-2009 Darren Hiebert
Addresses: [email protected], http://ctags.sourceforge.net
Optional compiled features: +wildcards, +regex

Actual behavior

Where project have space in path tags file in .vscode folder is not generate. visual studio code does not indicate a problem.

Windows (10) have similar problem.

Expected behavior

generate ctags when space is inside project path

Steps to reproduce:

code "/home/user/Desktop/repos/test space"

Test solution

when I in console write (relative path):

$ ctags --options=/home/user/.vscode/extensions/ms-python.python-0.8.0/resources/ctagOptions --languages=Python --exclude=**/site-packages/** -o ./.vscode/tags . 

then tags file is generate.

Logs

Output from Python output panel

ctags --options=/home/user/.vscode/extensions/ms-python.python-0.8.0/resources/ctagOptions --languages=Python --exclude=**/site-packages/** -o ./.vscode/tags .
ctags: cannot open tag file : No such file or directory

Output from Console window (Help->Developer Tools menu)
``

Always getting a "Debug adapter process has terminated unexpectedly" error when using "console" option

Environment data

VS Code version: 1.18.0
Python Extension version: 0.8.0
Python Version: 3.6.3
OS and version: Windows 10, build 15063.674

Actual behavior

Whenever I finish debugging, I always get a "Debug adapter process has terminated unexpectedly" error if I have a "console" option enabled in my launch.json (I get the error with both external terminal and integrated terminal).

Expected behavior

When I finish debugging, I don't want the error to appear.

Steps to reproduce:

-Create a launch.json with the "console": "externalTerminal".
-Create a Hello World program and debug it

Logs

Output from Python output panel

Output from Console window (Help->Developer Tools menu)

/C:/Program Files/Microsoft VS Code/resources/app/out/vs/workbench/workbench.main.js:9 [Extension Host] activating extension
/C:/Program Files/Microsoft VS Code/resources/app/out/vs/workbench/workbench.main.js:9 Debug adapter process has terminated unexpectedly
e.doShow @ /C:/Program Files/Microsoft VS Code/resources/app/out/vs/workbench/workbench.main.js:9
messageService.ts:126 Debug adapter process has terminated unexpectedly
e.doShow @ messageService.ts:126
e.show @ messageService.ts:105
_.onServerExit @ rawDebugSession.ts:535
(anonymous) @ rawDebugSession.ts:449
emitTwo @ events.js:111
emit @ events.js:194
__dirname.ChildProcess._handle.onexit @ internal/child_process.js:215
console.ts:123 [Extension Host] (node:55272) DeprecationWarning: os.tmpDir() is deprecated. Use os.tmpdir() instead.
t.log @ console.ts:123
t._logExtensionHostMessage @ extensionHost.ts:377
(anonymous) @ extensionHost.ts:202
emitTwo @ events.js:106
emit @ events.js:194
process.nextTick @ internal/child_process.js:766
_combinedTickCallback @ internal/process/next_tick.js:73
_tickCallback @ internal/process/next_tick.js:104

Autocomplete for modules on PYTHONPATH

Environment data

VS Code version: October 2018
Python Extension version: 0.8.0
Python Version: 2.7
OS and version: Ubuntu 16.04 macOS Sierra

Problem

My PYTHONPATH gets augmented by my development workspace when I compile the workspace. This means that python modules not in a standard location are still found by python. However, they don't seem to be picked up by the autocomplete capability. I cannot set an explicit path using python.autoComplete.extraPaths because the path changes.

Is PYTHONPATH not used as a lookup for autocomplete?

Any suggestions on how to address this?

An example PYTHONPATH I end up with is: /Users/ablakey/ros_catkin_ws/install_isolated/lib/python2.7/site-packages:/Users/ablakey/ws/devel/lib/python2.7/site-packages

Thank you!

Python extension activates on any debug

Environment data

VS Code version: 1.18.0
Python Extension version: 0.8.0
Python 2 Version: 2.7.14
Python 3 Version: 3.6.2
OS and version: Fedora 26 x86_64

Actual behavior

The extension always starts when debugging any kind of project.

Expected behavior

The extension probably shouldn't start when debugging projects that do not contain any python code.

Steps to reproduce:

  • Open a non-python project with a launch.json file
  • Start a debugging session with F5

From what I see in package.json's activation events, it looks like it's supposed to activate on any debugging session. However I don't see the point, as it only slows down debugging other projects.

I know I can just disable the extension for non-python projects, but that activation event still seems a bit overkill. Is there a reason for not using "workspaceContains:**/*.py" (and a few others for other extensions) instead ?

linting.lintOnTextChange does not work + doc bug

Environment data

VS Code version: 1.18.0, 1.17.2
Python Extension version: 0.8.0
Python Version: 2.7.14
OS and version: Fedora 26 (4.13.11-200.fc26.x86_64), GNOME Shell 3.24.3

Actual behavior

Nothing happens after, e.g., exceeding a line

Expected behavior

The line exceeding 80 chars gets underlined after a while

Steps to reproduce:

  • Example: create a line with >80 characters

Logs

Output from Python output panel

Output from Console window (Help->Developer Tools menu)

file:///usr/share/code/resources/app/out/vs/workbench/workbench.main.js [Extension Host] (node:23105)
DeprecationWarning: os.tmpDir() is deprecated. Use os.tmpdir() instead.
raw.marked.js:15 [Violation] Added non-passive event listener to a scroll-blocking 'touchstart' event. Consider marking event handler as 'passive' to make the page more responsive.
raw.marked.js:15 [Violation] Added non-passive event listener to a scroll-blocking 'touchmove' event. Consider marking event handler as 'passive' to make the page more responsive.

Additional info:

Config:

    "python.linting.pep8Enabled": true,
    "python.linting.flake8Enabled": true,
    "python.linting.pylintEnabled": false,
    "python.linting.lintOnTextChange": true,
    "python.linting.lintOnSave": false

If I turn lintOnSave to true (which is the default, there's a bug in the docs - https://code.visualstudio.com/docs/python/linting), the issues in source code get properly marked on file save.

Not working Ctrl+F5 for a second time

Nothing happened when you run simple hello world script for a second time without debugging.


  • VSCode Version: Code 1.18.0 (dcee2202709a4f223185514b9275aa4229841aa7, 2017-11-08T21:19:36.079Z)
  • OS Version: Windows_NT ia32 10.0.16299
  • Extensions: python|ms-|0.8.0

#region Support

I know it's not usual in the Python environment, but adding support for regions, which are in turn supported by VSCode since 1.17[1], would be a really nice feature. Often I work with large classes which have a lot of methods, which are grouped already, but being able to completely fold all regions I'm not working on right now would make for a smoother editing experience I think.

[1] https://code.visualstudio.com/updates/v1_17#_folding-regions

Doesn't seem to honor Python settings

I have VS Code 1.18.0, Python extension 0.8.0, published by Microsoft.

I have the setting "python.linting.enabled": false,, but linting is still active.
image

"Rename Symbol" often fails to rename when using Rope

Environment data

VS Code version: 1.18.0
Python Extension version: 0.8.0
Python Version: 3.5.3 Anaconda 4.0.0
OS and version: Widows 10 Professional

Actual behavior

"Symbol Rename" for a Python symbol fails to rename in about 50% of cases. The symbol remains as its old name and is not renamed

Expected behavior

Rename to rename symbols everytime.

Steps to reproduce:

  • Select symbol (e.g. "node"), choose "Rename Symbol" from context menu
  • Enter new symbol name (e.g. "node2")
    image
  • Press Enter
    Symbol may not be renamed

Logs

Output from Python output panel
No output

Output from ```Console window``` (Help->Developer Tools menu)
No output

Recommend Projects

  • React photo React

    A declarative, efficient, and flexible JavaScript library for building user interfaces.

  • Vue.js photo Vue.js

    ๐Ÿ–– Vue.js is a progressive, incrementally-adoptable JavaScript framework for building UI on the web.

  • Typescript photo Typescript

    TypeScript is a superset of JavaScript that compiles to clean JavaScript output.

  • TensorFlow photo TensorFlow

    An Open Source Machine Learning Framework for Everyone

  • Django photo Django

    The Web framework for perfectionists with deadlines.

  • D3 photo D3

    Bring data to life with SVG, Canvas and HTML. ๐Ÿ“Š๐Ÿ“ˆ๐ŸŽ‰

Recommend Topics

  • javascript

    JavaScript (JS) is a lightweight interpreted programming language with first-class functions.

  • web

    Some thing interesting about web. New door for the world.

  • server

    A server is a program made to process requests and deliver data to clients.

  • Machine learning

    Machine learning is a way of modeling and interpreting data that allows a piece of software to respond intelligently.

  • Game

    Some thing interesting about game, make everyone happy.

Recommend Org

  • Facebook photo Facebook

    We are working to build community through open source technology. NB: members must have two-factor auth.

  • Microsoft photo Microsoft

    Open source projects and samples from Microsoft.

  • Google photo Google

    Google โค๏ธ Open Source for everyone.

  • D3 photo D3

    Data-Driven Documents codes.