Coder Social home page Coder Social logo

ggstance's Introduction

Lifecycle: superseded R-CMD-check

ggstance

Important: This package has been superseded by ggplot2 3.3.0, which now has full native support for horizontality. The ggstance package will continue to be maintained for some time, but please consider switching to ggplot2.

Installation

Get the development version from Github with:

# install.packages("devtools")
devtools::install_github("lionel-/ggstance")

Horizontal geoms

While coord_flip() can only flip a plot as a whole, ggstance provides flipped versions of Geoms, Stats and Positions. This makes it easier to build horizontal layer or use vertical positioning (e.g. vertical dodging). Also, horizontal Geoms draw horizontal legend keys to keep the appearance of your plots consistent.

Horizontal Geoms:

  • geom_barh()
  • geom_colh()
  • geom_histogramh()
  • geom_linerangeh()
  • geom_pointrangeh()
  • geom_errorbarh()
  • geom_crossbarh()
  • geom_boxploth()
  • geom_violinh()

Horizontal Stats:

  • stat_binh()
  • stat_boxploth()
  • stat_counth()
  • stat_xdensity()
  • stat_summaryh()

Vertical Positions:

  • position_dodgev()
  • position_dodge2v()
  • position_nudgev()
  • position_fillv()
  • position_stackv()
  • position_jitterdodgev()

Examples

Basics

To create a horizontal layer in ggplot2 with coord_flip(), you have to supply aesthetics as if they were to be drawn vertically:

library("ggplot2")

# Vertical
ggplot(mpg, aes(class, hwy, fill = factor(cyl))) +
  geom_boxplot()

# Horizontal with coord_flip()
ggplot(mpg, aes(class, hwy, fill = factor(cyl))) +
  geom_boxplot() +
  coord_flip()

In ggstance, you supply aesthetics in their natural order:

library("ggstance")

# Horizontal with ggstance
ggplot(mpg, aes(hwy, class, fill = factor(cyl))) +
  geom_boxploth()

Horizontal boxplot

Facetting with Free Scales

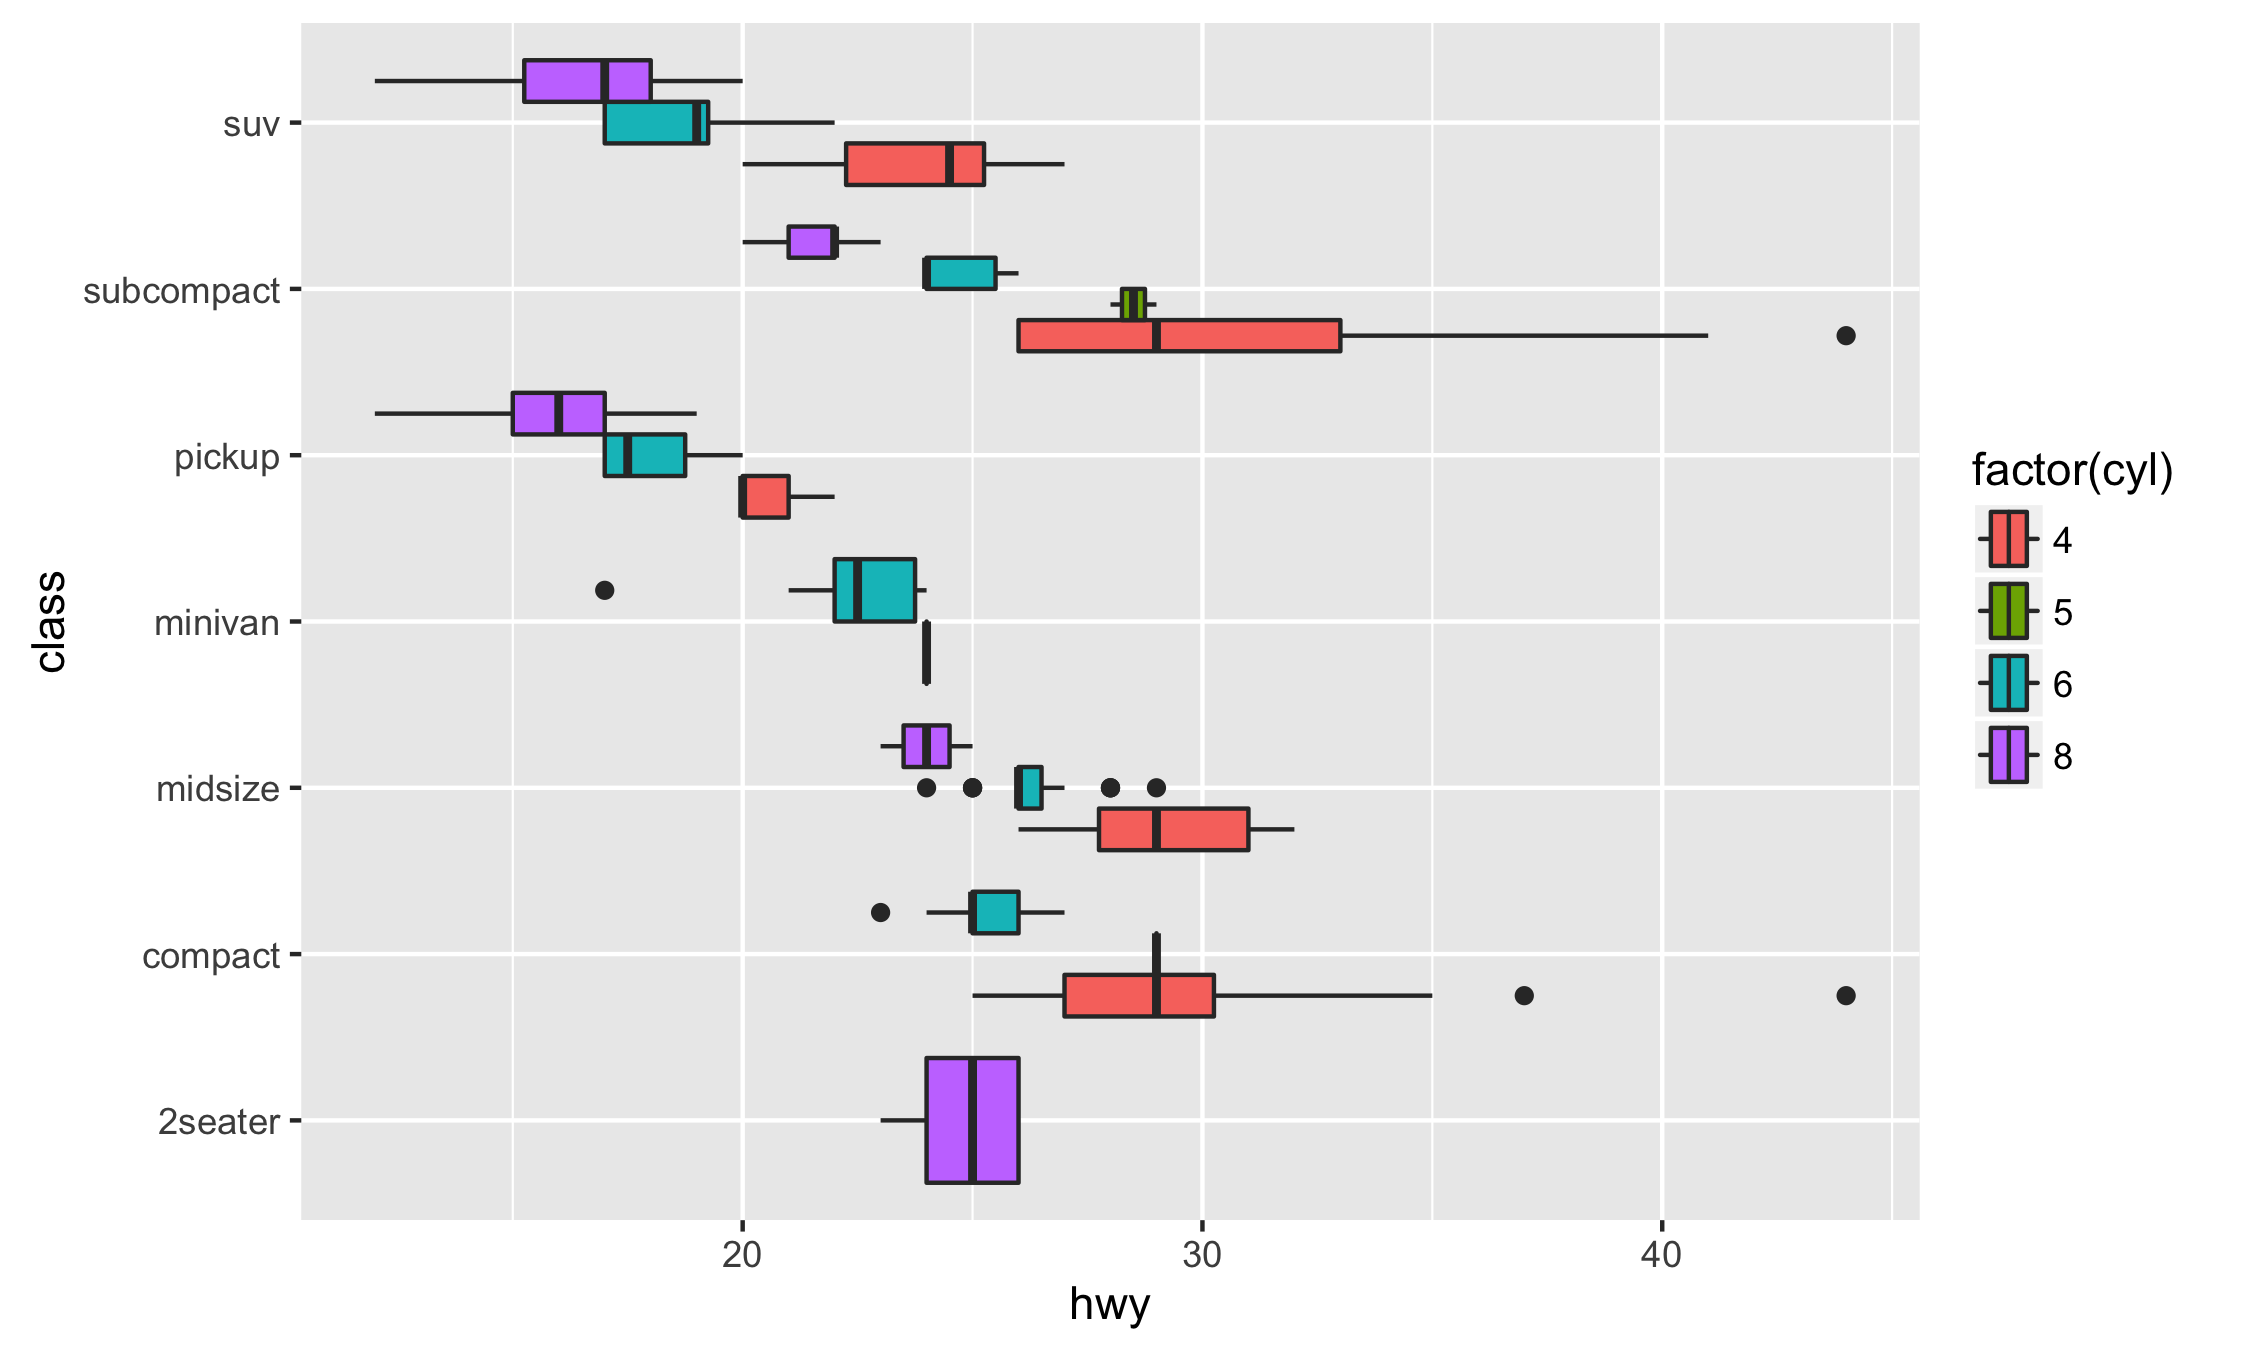
Some plots are hard to produce with coord_flip(). One case is facetting with free scales. Here is an example from @smouksassi:

library("ggplot2")
library("ggstance")

df <- data.frame(
  Group = factor(rep(1:3, each = 4), labels = c("Drug A", "Drug B", "Control")),
  Subject = factor(rep(1:6, each = 2), labels = c("A", "B", "C", "D", "E", "F")),
  Result = rnorm(12)
)

vertical <- ggplot(df, aes(Subject, Result))+
  geom_boxplot(aes(fill = Group))+
  facet_grid(. ~ Group, scales = "free_x")
vertical

How do we flip this plot? With coord_flip(), the free scales are not flipped correctly:

vertical + coord_flip()
vertical + facet_grid(Group ~ ., scales = "free_x") + coord_flip()

On the other hand a ggstance horizontal layer will work properly:

horizontal <- ggplot(df, aes(Result, Subject))+
  geom_boxploth(aes(fill = Group))+
  facet_grid(Group ~ ., scales = "free_y")
horizontal

Horizontal free-scales facetting

Using vertical positions

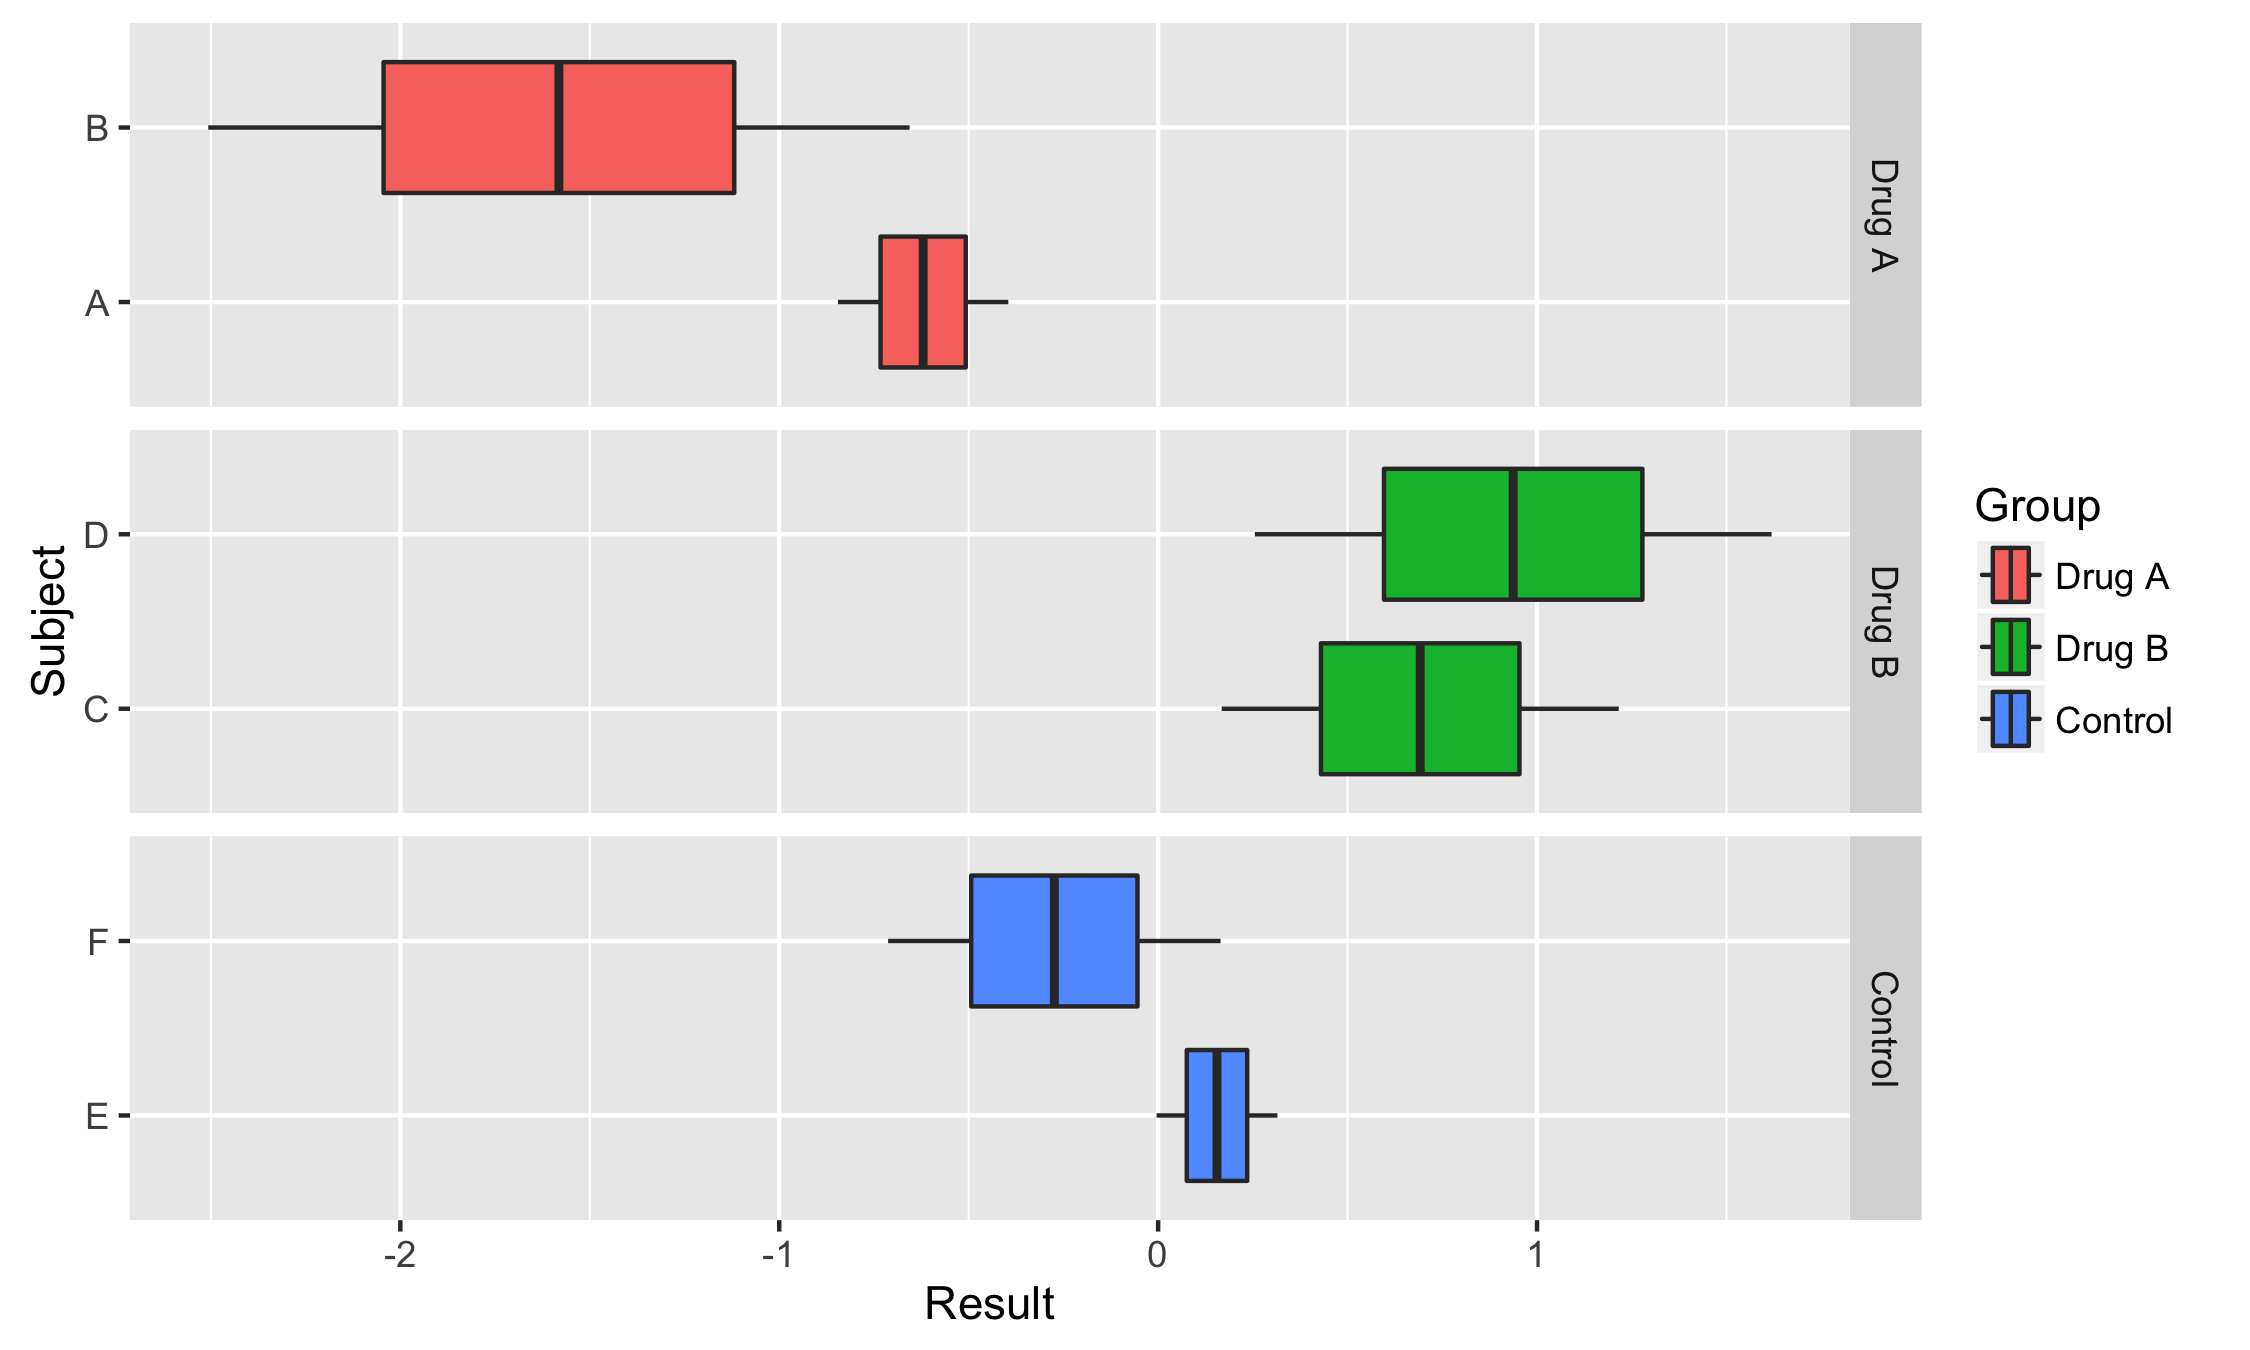
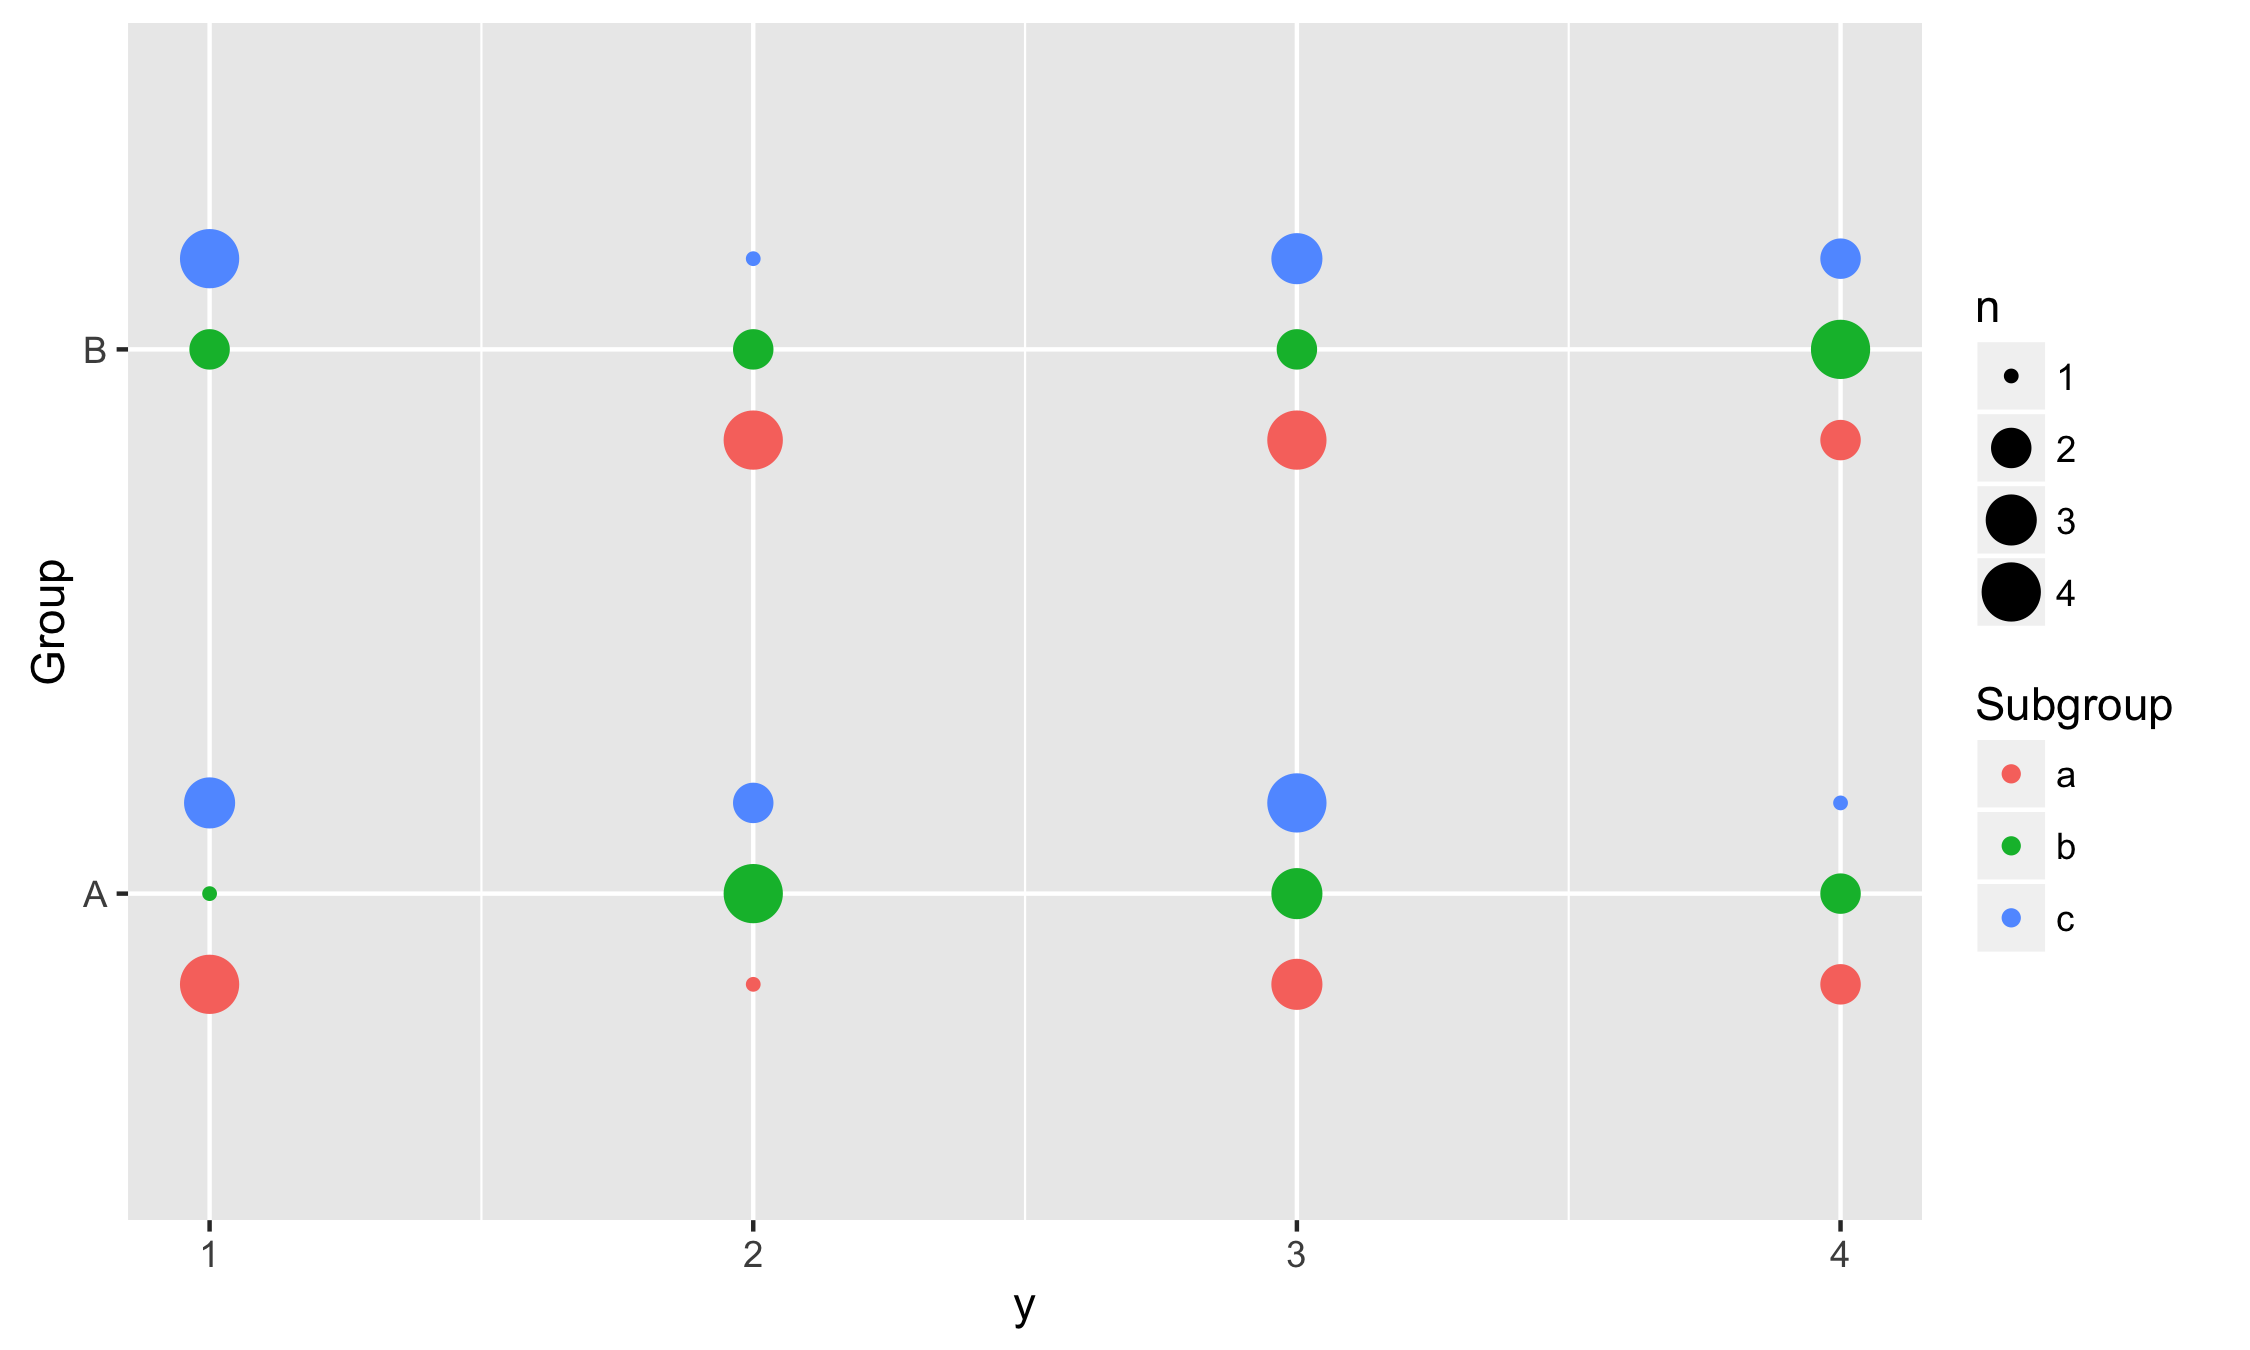
In this example we use vertical dodging to align measurements within subgroups.

data <- expand.grid(
  Group = c("A", "B"),
  Subgroup = c("a", "b", "c"),
  y = 1:10
)
data$y <- sample(1:4, replace = TRUE, size = nrow(data))

ggplot(data, aes(y, Group, colour = Subgroup)) +
  stat_sum(position = position_dodgev(height = 0.5))

Vertical positions

ggstance's People

Contributors

erocoar avatar friep avatar iamamutt avatar lionel- avatar michaelchirico avatar paleolimbot avatar rjbgoudie avatar sowla avatar thomasp85 avatar

Stargazers

 avatar  avatar  avatar  avatar  avatar  avatar  avatar  avatar  avatar  avatar  avatar  avatar  avatar  avatar  avatar  avatar  avatar  avatar  avatar  avatar  avatar  avatar  avatar  avatar  avatar  avatar  avatar  avatar  avatar  avatar  avatar  avatar  avatar  avatar  avatar  avatar  avatar  avatar  avatar  avatar  avatar  avatar  avatar  avatar  avatar  avatar  avatar  avatar  avatar  avatar  avatar  avatar  avatar  avatar  avatar  avatar  avatar  avatar  avatar  avatar  avatar  avatar  avatar  avatar  avatar  avatar  avatar  avatar  avatar  avatar  avatar  avatar  avatar  avatar  avatar  avatar  avatar  avatar  avatar  avatar  avatar  avatar  avatar  avatar  avatar  avatar  avatar  avatar  avatar  avatar  avatar  avatar  avatar  avatar  avatar  avatar  avatar  avatar  avatar  avatar

Watchers

 avatar  avatar  avatar  avatar  avatar  avatar  avatar  avatar  avatar  avatar

ggstance's Issues

question, not issue

I am using a modified version of the following command:

p + geom_facet(panel = "SNP", data = snp_data, geom = geom_point,
mapping=aes(x = pos, color = location), shape = '|')

in which I have added a fill by factor option:

p + geom_facet(panel = "vir_genes", data = vir_data4.2.2, geom = geom_point, mapping=aes(x = position, color=genes))

I would love to be able to specify a custom color palette. Let us say, I have 27 levels of the factor and I would like to pass the option viridis(27) to be used.
I have unsuccessfully tried different options. if you have any suggestion, that would be awesome!

thank you

x y axis issue

According to YuLab-SMU/ggtree#96.

I think ggstance has an issue of calculating x-y coordinates.

Here is a very simple example:

library(ggplot2)
library(ggstance)

set.seed(123)
d =data.frame(id=rep(1:10, each=20), val=as.vector(sapply(1:30, function(i) rnorm(20, mean=i))))
ggplot(d)+ geom_boxploth(aes(x=val, y=id, group=id))

screen shot 2017-03-09 at 5 55 28 pm

In this example, y coordinates should range from 1 to 10, but in the above plot, we can find that it range from 0 to 30 which should be the range of x coordinates.

It works fine if y is categorical variable.

## this code works
ggplot(d)+ geom_boxploth(aes(x=val, y=factor(id), group=id))

Order of items in legend

conflicts with order in which geoms are put by position_dodgev().

In the plot I would expect the fill color to go from red to green to blue in the plot, corresponding to the legend.

library(tidyverse)
library(ggstance)
#> 
#> Attaching package: 'ggstance'
#> The following objects are masked from 'package:ggplot2':
#> 
#>     geom_errorbarh, GeomErrorbarh

mpg %>% 
  ggplot(aes(x = cty, y = class, fill = drv)) +
  geom_boxploth()

Created on 2018-05-19 by the reprex package (v0.2.0).

Modify bars in `geom_pointrangeh`

Thank you for the great package! The functions are very useful, especially the geom_pointrangeh, for my data visualization tasks. A question about it, though: how can I modify the interval bars (such as increasing the width or changing the color)? I saw you defined the arguments of the points and bars together with the panel_scale argument in the function. But is there any way I can define the parameters of the bars independently?

Broken 'geom_barh' or stupid user?

Consider the following:

ggplot2::ggplot(ggplot2::mpg, ggplot2::aes(class)) + ggplot2::geom_bar()

This yields
rplot

However

ggplot2::ggplot(ggplot2::mpg, ggplot2::aes(class)) + ggstance::geom_barh()

produces the (broken!?)
rplot01
Where am I getting this wrong?

Is it possible to achieve a histogram with a horizontal boxplot in the ggplot2 3.3.0?

I found that you suggest to switch to ggplot2 for horizontal figures and that the ggstance may be retired one day.
I have a concrete case that I'm not sure if it's possible to achieve with ggplot2.

I need a histogram with a boxplot below. It's not about just "coord_flip". I don't want to flip everything (both histogram + boxplot), but only the boxplot.

Using your precious package it's easy to achieve this way:

g <- ggplot(....) + 
    geom_histogram(aes(y = ..count..)) +
    facet_grid(A ~ B)

# automated searching for a good position for the boxplot
gb <- ggplot2::ggplot_build(g)
boxplot_pos <- 0.1*max(gb$data[[1]]$count)

g + ggstance::geom_boxploth(aes(y = -boxplot_pos), width = boxplot_pos, color = "slateblue", lwd = .8, alpha = .2, outlier.color = NA, coef = 1) 

with the following result:

obraz

Can I achieve the same in ggplot2?
If it's not possible, kindly please consider not retiring ggstance yet. Histogram without a boxplot is so poor...

Please note, that the boxplot is an integral part of the histogram now. It works with faceting. I already saw solutions with combined separate graphs.
https://stackoverflow.com/questions/4551582/combination-boxplot-and-histogram-using-ggplot2

But this doesn't work with faceting and looks ugly. It seems that only your package can do that without much efforts, combining graphs and writing kilobytes of code. Actually, I could even skip the automated positioning and fix the "boxplot_pos" manually, making it even simpler. For this very reasons please at least keep this package active on the CRAN.

functionality missing from ggplot2?

as discussed here, there still seem to be a few pieces of ggstance functionality that don't exist (yet?) in ggplot2

  • vertical dodging (position_dodgev)
  • horizontal orientation of line segments in legends (geom_pointrangeh vs. geom_pointrange(xmin=..., xmax= ...)

Perhaps this is better for the ggplot2 issues list, but can you shed any light on whether (1) these are already implemented in some way in ggplot2 but I'm missing them or (2) there are plans to migrate this functionality to ggplot2 ?

ggstance error with height argument (All height aesthetics in ggplot no longer work if ggstance is loaded)

As height is an argument in ggstance (for example in position_dodgev), this stops all height arguments in ggplot2. This means if say you want to adjust the tick mark height on the end of error bars (using geom_errorbarh) then the hight creates an error of : Warning: Ignoring unknown parameters: height. All height aesthics in ggplots do not work if ggstance is installed so other plots in the same script no longer work, not just in the same plot.

legend title NA induced by geom_boxploth

data(diamonds)
geom_boxploth(data=diamonds,aes(y=-0.5,x=carat,fill=cut))+
geom_density(aes(x=carat,y=..density..)) + facet_grid(cut~.)

does the job BUT (the order is reversed)

ggplot(data=diamonds) +
geom_density(aes(x=carat,y=..density..)) +
geom_boxploth(data=diamonds,aes(y=-0.5,x=carat,fill=cut))+
facet_grid(cut~.)

produces a legend title "NA"


packageVersion("ggplot2")
[1] ‘2.1.0’
packageVersion("ggstance")
[1] ‘0.2.9000’
R.version.string
[1] "R version 3.3.1 (2016-06-21)"

Error using new ggplot2 dev version and ggstance

Hi!

I just updated ggplot2 to the newest github version and GeomBarh doesn't work anymore. I already tried reinstalling ggplot2 but that doesn't solve the problem.

Error: GeomBarh was built with an incompatible version of ggproto.
Please reinstall the package that provides this extension.

I am using:
"R version 3.3.1 (2016-06-21)"
ggstance_0.2.9000 ggplot2_2.1.0.9001

facetting with free axes

From @smouksassi

require(gghorizon)
require(ggplot2)

set <- factor(rep(1:3, each=50), labels=c("DRUG A","DRUG B","Vehicle"))
subject <- factor(rep(1:6, each=25),
                 labels=c("A","B","C","D","E","F"))
result <- rnorm(150)
test <- data.frame(set, subject, result)

p <- ggplot(test, aes(subject, result))+
  geom_boxplot()+
  facet_grid(. ~ set)
p

p1 <- ggplot(test, aes(subject, result))+
  geom_boxplot()+
  facet_grid(. ~ set, space="free",
                             scales="free_x")

p1 # works but  how to we flip this plot ?

p1 +coord_flip() # wrong output incorrect y axis labels

#trying the new geom geom_boxploth

p2 <- ggplot(test, aes( result,subject))+
  geom_boxploth()+
  facet_grid(set ~.)

p2 # ptoduce the plot but let us try freeing the y axis


p3 <- ggplot(test, aes( result,subject))+
  geom_boxploth()+
  facet_grid(set ~.,scales="free_y")

p3
#Error in panel$y_scales[[this_panel$SCALE_Y]] : subscript out of bounds

Misleading error messages for missing aesthetics

For any of geom_linerangeh, geom_pointrangeh, geom_crossbarh, geom_errorbarh, the error for missing aesthetics still report the required aesthetics for the vertical versions.

ggplot(mtcars) + geom_linerangeh()

Error: geom_linerangeh requires the following missing aesthetics: x, ymin, ymax

Even though it needs y, xmin and xmax.

This may be confusing for users that are changing an existing call to a horizontal one, where they already are supplying x, ymin and ymax.

differences between Geomerrorbarh in ggplot2 and ggstance

Since both packages export geom_errrorbarh(), it would be nice if the documentation to clarify how they differ. Looking through the code, I see that ggplot2 uses height and ggstance uses width in the set up data. Are there any other differences?

Is there any reason not to have these be identical?

document aesthetics?

I like that ggplot2 lists the aesthetics available and shows which are required. Could that eventually be added to the documentation in ggstance? Does @hadley have a way of auto-generating that documentation?

position_dodge now works for geom_barh

> d = data.frame(x=abs(rnorm(10)), y = rep(letters[1:5], each=2), z = rep(LETTERS[1:2], 5))
> d
            x y z
1  1.83756973 a A
2  0.28959034 a B
3  0.89232598 b A
4  0.14638835 b B
5  0.71655395 c A
6  0.05709567 c B
7  1.39511741 d A
8  0.59473623 d B
9  0.69056438 e A
10 0.23408219 e B
> ggplot(d, aes(x, y)) + geom_barh(aes(fill=z), stat='identity') -> p1
> ggplot(d, aes(x, y)) + geom_barh(aes(fill=z), stat='identity', position='dodge') -> p2
> ggtree::multiplot(p1, p2, ncol=2)
Warning message:
position_dodge requires non-overlapping x intervals

screen shot 2016-10-24 at 2 11 20 pm

Would it be possible to add an hjust argument to position_stackv to automate text label positioning in stacked horiztonal bar plots?

Here's a reprex:

Summarize data for plot:

library(tidyverse)
library(ggstance)

dat = mtcars %>% group_by(vs, carb, am) %>% 
  tally %>% 
  mutate(pct=n/sum(n))

In the plot below, we use position=position_stack(vjust=0.5) to center the labels within each section of the stacked bars, and we use scales="free_x", space="free_x" to avoid blank spaces for empty x-axis levels.

ggplot(dat, aes(x=factor(carb), y=pct, fill=factor(am))) +
  geom_bar(stat='identity') + 
  geom_text(aes(label=sprintf("%1.1f", pct*100)), colour="white", position=position_stack(vjust=0.5)) +
  scale_y_continuous(labels=percent) +
  facet_grid(. ~ vs,  scales="free_x",  space="free_x")

If I want this to be a horizontal bar plot, the natural approach would be to add coord_flip, as in the code below. However, with coord_flip, scales="free_x", space="free_x" no longer removes the space for the empty levels.

ggplot(dat, aes(x=factor(carb), y=pct, fill=factor(am))) +
  geom_bar(stat='identity') + 
  geom_text(aes(label=sprintf("%1.1f", pct*100)), colour="white", position=position_stack(vjust=0.5)) +
  scale_y_continuous(labels=percent) +
  facet_grid(. ~ vs, scales="free_x", space="free_x") +
  coord_flip()

An alternative would be to use geom_barh from ggstance as in the code below. However, position=position_stackv(hjust=0.5) doesn't work, because position_stackv doesn't take an hjust argument. It would be nice to have the hjust argument available so that the text labels can be centered within each bar portion.

ggplot(dat, aes(x=pct, y=factor(carb), fill=factor(am))) +
  geom_barh(stat='identity') + 
  geom_text(aes(label=sprintf("%1.1f", pct*100)), colour="white", position=position_stackv(hjust=0.5)) +
  scale_x_continuous(labels=percent) +
  facet_grid(vs ~ ., scales="free_y", space="free_y")

I realize I can set the label x-values when I summarize the data, as in the code below, but it would be nice to just be able to do position=position_stackv(hjust=0.5) just as we can do position=position_stack(vjust=0.5) in the vertical bar plot.

dat = mtcars %>% group_by(vs, carb, am) %>% 
  tally %>% 
  mutate(pct = n/sum(n)) %>% 
  arrange(desc(am), pct) %>% 
  mutate(xval = cumsum(pct) - 0.5*pct)

ggplot(dat, aes(x=pct, y=factor(carb), fill=factor(am))) +
  geom_barh(stat='identity') + 
  geom_text(aes(label=sprintf("%1.1f", pct*100), x=xval), colour="white") +
  scale_x_continuous(labels=percent) +
  facet_grid(vs ~ ., scales="free_y", space="free_y")

Revdepcheck failure with upcoming ggplot2 version

Hi Lionel,

We have been preparing a new release of ggplot2 and during a reverse dependency check, it appeared as if ggstance might become broken.

I'm using 'appeared' here, because I couldn't locally reproduce the failing checks. Everything might be just fine, but I wanted to let you know anyway, so it wouldn't be a surprise down the road.

If you want to test the code changes with the release candidate, you can install it with the code below:

remotes::install_github("tidyverse/ggplot2", ref = remotes::github_pull("5592"))

The release of ggplot2 3.5.0 is scheduled for the 12th of February. The progress of the release can be tracked in tidyverse/ggplot2#5588.

Update vdiffr test cases for new ggplot2 release

I can't bring myself to post a templated-issue here given that you wrote vdiffr and you're an author on ggplot2. However, this is just a reminder that ggplot 3.2.0 will induce visual changes and may result in you needing to update your visual test cases for ggstance. Cheers!

Feature request: CRAN release

ggstance seems like a very useful package, and it would be nice if it was available as a package on CRAN. It would make the package visible to a wider audience and make it more accessible (for example, some companies have policy of only allowing CRAN packages). So here’s a ‘feature request’ for a CRAN release. :)

Should stat_counth() be exported?

It appears that others like stat_boxploth() are exported, but stat_counth() is not.

> apropos("stat_.*h$")
[1]  "stat_binh"     "stat_boxploth" "stat_smooth"   "stat_summaryh"

Error when using geom_pointrangeh and trying to set custom x axis

example and data frame taken from ggplot2 geom_pointrange help
It seems that we cannot use custom x axis ticks ?

df <- data.frame(
  trt = factor(c(1, 1, 2, 2)),
  resp = c(1, 5, 3, 4),
  group = factor(c(1, 2, 1, 2)),
  upper = c(1.1, 5.3, 3.3, 4.2),
  lower = c(0.8, 4.6, 2.4, 3.6),
  ref= c(3,3,3,3),
  lowerref =c(2.9,2.9,2.9,2.9),
    upperref= c(3.2,3.2,3.2,3.2)
)

p <- ggplot(df, aes(trt, resp, colour = group))
p + geom_pointrange(aes(ymin = lower, ymax = upper))+
    geom_pointrange(aes(ymin=lowerref,ymax=upperref,y=ref),col="black")+
  scale_y_continuous(breaks = c(1,2,3,4,5),
                     labels = c("1/1", "2/1", "3/1", "4/1", "5/1"))

ggplot(df, aes(resp, trt, colour = group))+
  geom_pointrangeh(aes(xmin = lower, xmax = upper))+
  scale_x_continuous(breaks = c(1,2,3,4,5),
                     labels = c("1/1", "2/1", "3/1", "4/1", `"5/1"))
Scale for 'x' is already present. Adding another scale for 'x', which will replace the
existing scale.
Scale for 'x' is already present. Adding another scale for 'x', which will replace the
existing scale.
Error: Discrete value supplied to continuous scale

geom_violinh fails with warning to "Please use `to_lower_ascii()`" with newly-released ggplot2

If I install the development version most recent CRAN release of ggplot2, the following code generates a warning and does not draw the violin plot (it works fine if the current CRAN release version of ggplot2 is installed):

library(ggstance)
library(ggplot2)

ggplot(data.frame(x = rnorm(1000), y = "a"), aes(x, y)) +
  geom_violinh()
Warning message:
Computation failed in `stat_xdensity()`:
Please use `to_lower_ascii()`, which works fine in all locales.

I couldn't easily track down where this is coming from (because I don't see a call to tolower() anywhere?), but I assume it is related to this change in ggplot2: tidyverse/ggplot2#3011

geom_violin seems to still work:

library(ggplot2)
library(ggstance)

ggplot(data.frame(y = rnorm(1000), x = "a"), aes(x, y)) +
  geom_violin()

image

So I am assuming the issue is somewhere in ggstance.

sessionInfo() output is below.

R version 3.5.2 (2018-12-20)
Platform: x86_64-w64-mingw32/x64 (64-bit)
Running under: Windows >= 8 x64 (build 9200)

Matrix products: default

locale:
[1] LC_COLLATE=English_United States.1252  LC_CTYPE=English_United States.1252    LC_MONETARY=English_United States.1252
[4] LC_NUMERIC=C                           LC_TIME=English_United States.1252    

attached base packages:
[1] stats     graphics  grDevices utils     datasets  methods   base     

other attached packages:
[1] ggstance_0.3.1     ggplot2_3.1.0.9000

loaded via a namespace (and not attached):
 [1] Rcpp_1.0.1       withr_2.1.2      assertthat_0.2.1 crayon_1.3.4     dplyr_0.8.0.1    R6_2.4.0         grid_3.5.2      
 [8] gtable_0.2.0     magrittr_1.5     scales_1.0.0     pillar_1.3.1     rlang_0.3.2      lazyeval_0.2.2   rstudioapi_0.10 
[15] labeling_0.3     tools_3.5.2      glue_1.3.1       purrr_0.3.2      munsell_0.5.0    yaml_2.2.0       compiler_3.5.2  
[22] pkgconfig_2.0.2  colorspace_1.4-1 tidyselect_0.2.5 tibble_2.1.1 

Warning: Ignoring unknown parameters: height

R version 3.6.1 (2019-07-05)
Platform: x86_64-w64-mingw32/x64 (64-bit)
Running under: Windows 7 x64 (build 7601) Service Pack 1

Matrix products: default

locale:
[1] LC_COLLATE=Estonian_Estonia.1257 LC_CTYPE=Estonian_Estonia.1257 LC_MONETARY=Estonian_Estonia.1257
[4] LC_NUMERIC=C LC_TIME=Estonian_Estonia.1257

attached base packages:
[1] stats graphics grDevices utils datasets methods base

other attached packages:
[1] tidyr_1.0.0 cowplot_0.9.4 dplyr_0.8.3 plyr_1.8.4 reshape2_1.4.3
[6] ggthemes_4.1.1 ggplotify_0.0.4 ggstance_0.3.1 ggtree_2.1.1 tibble_2.1.3
[11] UsingR_2.0-6 Hmisc_4.2-0 ggplot2_3.2.1 Formula_1.2-3 survival_2.44-1.1
[16] lattice_0.20-38 HistData_0.8-4 MASS_7.3-51.4 phytools_0.6-99 maps_3.3.0
[21] RColorBrewer_1.1-2 tidytree_0.2.9 treeio_1.11.0 ape_5.3 patchwork_0.0.1.9000

loaded via a namespace (and not attached):
[1] nlme_3.1-140 fs_1.3.1 usethis_1.5.0 devtools_2.0.2
[5] rprojroot_1.3-2 numDeriv_2016.8-1 tools_3.6.1 backports_1.1.5
[9] R6_2.4.1 rpart_4.1-15 lazyeval_0.2.2 colorspace_1.4-1
[13] nnet_7.3-12 withr_2.1.2 tidyselect_0.2.5 gridExtra_2.3
[17] prettyunits_1.0.2 mnormt_1.5-5 processx_3.3.1 phangorn_2.5.3
[21] curl_3.3 compiler_3.6.1 cli_1.1.0 htmlTable_1.13.1
[25] animation_2.6 expm_0.999-4 desc_1.2.0 labeling_0.3
[29] scales_1.0.0 checkmate_1.9.3 quadprog_1.5-7 callr_3.2.0
[33] stringr_1.4.0 digest_0.6.22 foreign_0.8-71 base64enc_0.1-3
[37] pkgconfig_2.0.3 htmltools_0.3.6 sessioninfo_1.1.1 plotrix_3.7-5
[41] htmlwidgets_1.3 rlang_0.4.1 rstudioapi_0.10 gridGraphics_0.4-0
[45] combinat_0.0-8 jsonlite_1.6 gtools_3.8.1 acepack_1.4.1
[49] magrittr_1.5 Matrix_1.2-17 Rcpp_1.0.3 munsell_0.5.0
[53] lifecycle_0.1.0 scatterplot3d_0.3-41 stringi_1.4.3 yaml_2.2.0
[57] clusterGeneration_1.3.4 pkgbuild_1.0.3 grid_3.6.1 parallel_3.6.1
[61] crayon_1.3.4 splines_3.6.1 zeallot_0.1.0 knitr_1.22
[65] ps_1.3.0 pillar_1.4.2 igraph_1.2.4.1 pkgload_1.0.2
[69] fastmatch_1.1-0 glue_1.3.1 latticeExtra_0.6-28 data.table_1.12.2
[73] remotes_2.1.0 BiocManager_1.30.10 vctrs_0.2.0 testthat_2.1.1
[77] gtable_0.3.0 purrr_0.3.3 assertthat_0.2.1 xfun_0.6
[81] coda_0.19-2 rvcheck_0.1.6 memoise_1.1.0 cluster_2.0.9

Feature request: stat_summary with ggstance

It looks like you can't use stat_summary with ggstance (please correct me if I'm wrong about this). For example, say I want to use a different function to generate the values for a boxplot. Then I would use stat_summary to create the boxplot. But with geom=boxploth, this throws an error (see reproducible examples below). I'm guessing this is because fun.data returns y values, but ggstance is expecting them to be x values. If it's possible, it would be nice to be able to use stat_summary with ggstance geoms.

library(ggstance)

# Function to use boxplot.stats to set the box-and-whisker locations  
mybxp = function(x) {
  bxp = boxplot.stats(x)[["stats"]]
  names(bxp) = c("ymin","lower", "middle","upper","ymax")
  return(bxp)
}

# Works
ggplot(mtcars, aes(x=mpg, y=factor(cyl))) +
  geom_boxploth()

# Works
ggplot(mtcars, aes(x=factor(cyl), y=mpg)) +
  stat_summary(fun.data=mybxp, geom="boxplot")

# Error
ggplot(mtcars, aes(x=mpg, y=factor(cyl))) +
  stat_summary(fun.data=mybxp, geom="boxploth")

Error in $<-.data.frame(*tmp*, "xmin", value = numeric(0)) :
replacement has 0 rows, data has 27
In addition: Warning messages:
1: In min(x, na.rm = na.rm) :
no non-missing arguments to min; returning Inf
2: In max(x, na.rm = na.rm) :
no non-missing arguments to max; returning -Inf
3: In min(diff(sort(x))) : no non-missing arguments to min; returning Inf

Recommend Projects

  • React photo React

    A declarative, efficient, and flexible JavaScript library for building user interfaces.

  • Vue.js photo Vue.js

    🖖 Vue.js is a progressive, incrementally-adoptable JavaScript framework for building UI on the web.

  • Typescript photo Typescript

    TypeScript is a superset of JavaScript that compiles to clean JavaScript output.

  • TensorFlow photo TensorFlow

    An Open Source Machine Learning Framework for Everyone

  • Django photo Django

    The Web framework for perfectionists with deadlines.

  • D3 photo D3

    Bring data to life with SVG, Canvas and HTML. 📊📈🎉

Recommend Topics

  • javascript

    JavaScript (JS) is a lightweight interpreted programming language with first-class functions.

  • web

    Some thing interesting about web. New door for the world.

  • server

    A server is a program made to process requests and deliver data to clients.

  • Machine learning

    Machine learning is a way of modeling and interpreting data that allows a piece of software to respond intelligently.

  • Game

    Some thing interesting about game, make everyone happy.

Recommend Org

  • Facebook photo Facebook

    We are working to build community through open source technology. NB: members must have two-factor auth.

  • Microsoft photo Microsoft

    Open source projects and samples from Microsoft.

  • Google photo Google

    Google ❤️ Open Source for everyone.

  • D3 photo D3

    Data-Driven Documents codes.