![]()
LineUp is an interactive technique designed to create, visualize and explore rankings of items based on a set of heterogeneous attributes.
- scalable (~1M rows)
- heterogenous attribute types (string, numerical, categorical, boolean, date)
- composite column types (weighted sum, min, max, mean, median, impose, nested, ...)
- array (multi value) and map column types (strings, stringMap, numbers, numberMap, ...)
- filtering capabilities
- hierarchical sorting (sort by more than one sorting criteria)
- hierarchical grouping (split rows in multiple separate groups)
- group aggregations (show a whole group as a single group row)
- numerous visualizations for summaries, cells, and group aggregations
- side panel for easy filtering and column management
- React, Angular, Vue.js, Polymer, RShiny, Juypter, ObservableHQ, and Power BI wrapper
- Demo Application with CSV import and export capabilities
- API Documentation based on generated TypeDoc documenation
Installation
npm install lineupjs<link href="https://unpkg.com/lineupjs/build/LineUpJS.css" rel="stylesheet" />
<script src="https://unpkg.com/lineupjs/build/LineUpJS.js"></script>Minimal Usage Example
// generate some data
const arr = [];
const cats = ['c1', 'c2', 'c3'];
for (let i = 0; i < 100; ++i) {
  arr.push({
    a: Math.random() * 10,
    d: 'Row ' + i,
    cat: cats[Math.floor(Math.random() * 3)],
    cat2: cats[Math.floor(Math.random() * 3)],
  });
}
const lineup = LineUpJS.asLineUp(document.body, arr);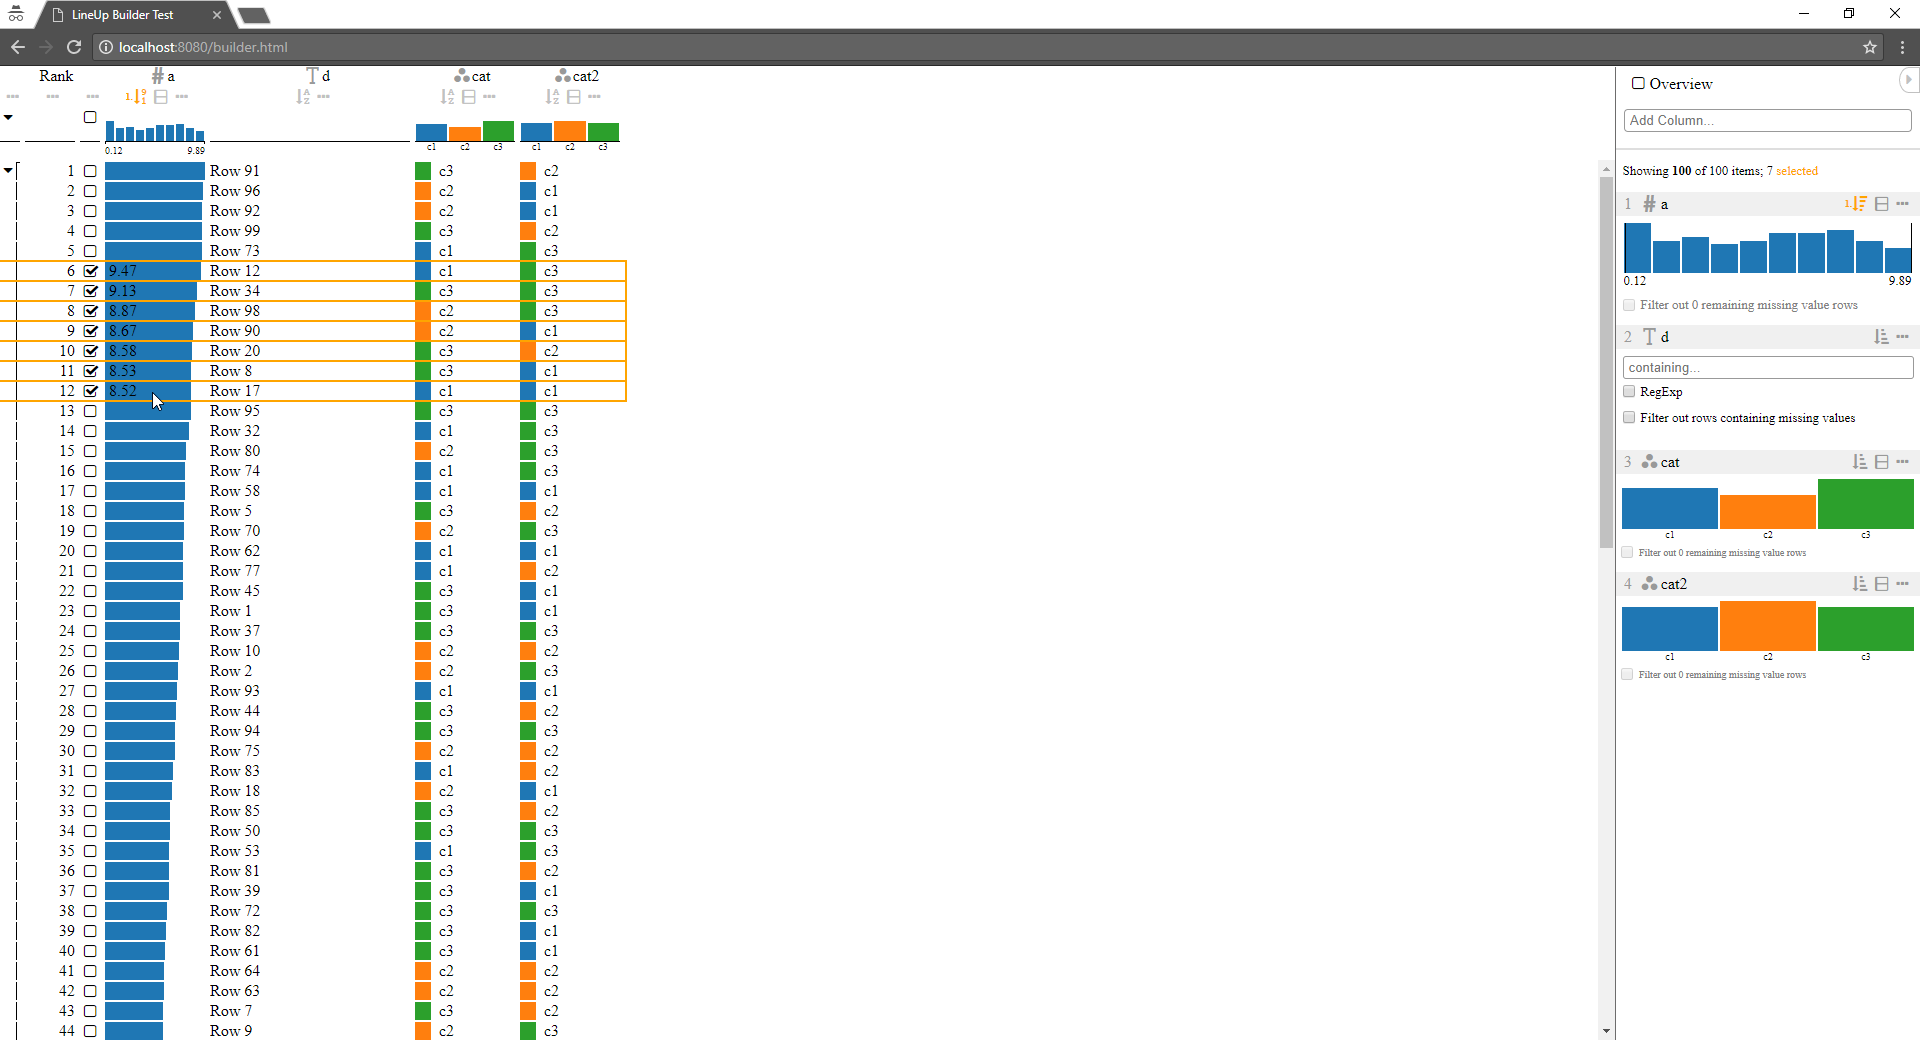
Advanced Usage Example
// arr from before
const builder = LineUpJS.builder(arr);

// manually define columns
builder
  .column(LineUpJS.buildStringColumn('d').label('Label').width(100))
  .column(LineUpJS.buildCategoricalColumn('cat', cats).color('green'))
  .column(LineUpJS.buildCategoricalColumn('cat2', cats).color('blue'))
  .column(LineUpJS.buildNumberColumn('a', [0, 10]).color('blue'));

// and two rankings
const ranking = LineUpJS.buildRanking()
  .supportTypes()
  .allColumns() // add all columns
  .impose('a+cat', 'a', 'cat2'); // create composite column
  .groupBy('cat')
  .sortBy('a', 'desc')


builder
  .defaultRanking()
  .ranking(ranking);

const lineup = builder.build(document.body);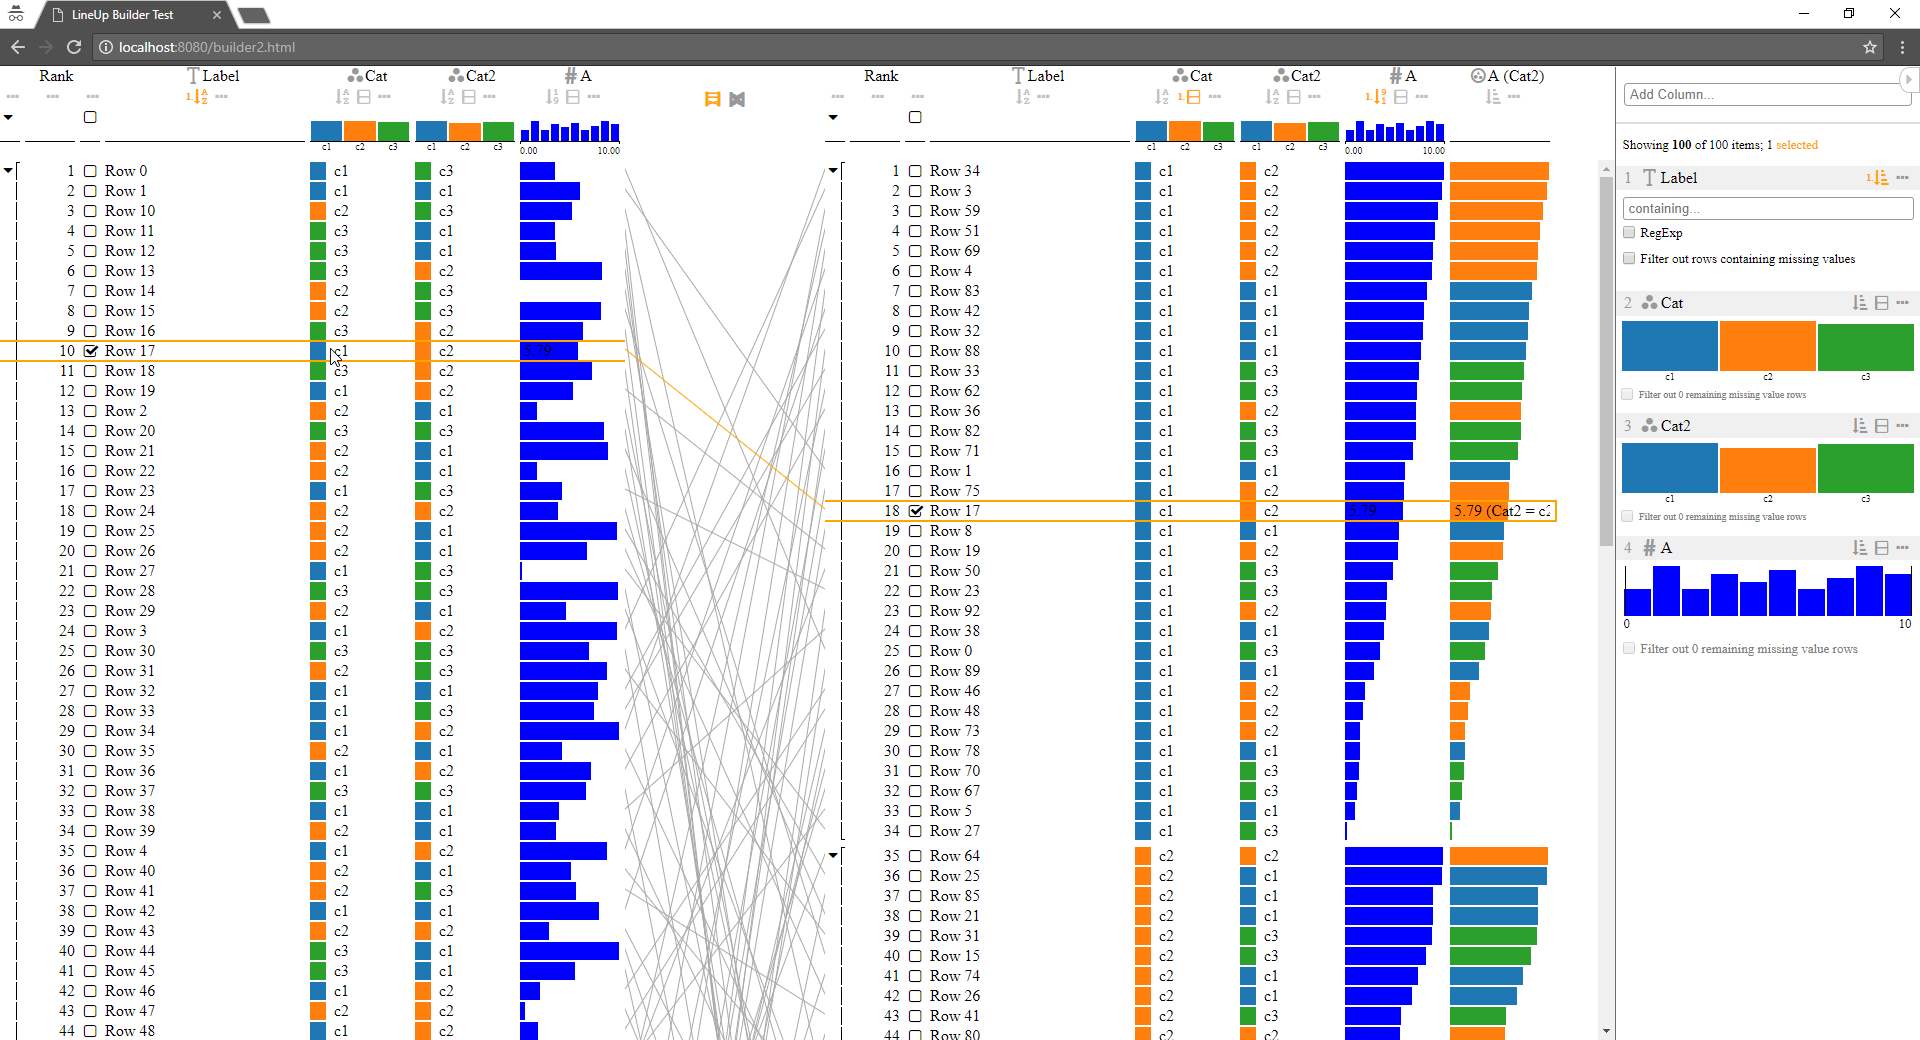
- Chrome 64+ (best performance)
- Firefox 57+
- Edge 16+
A demo application is located at lineup_app. It support CSV Import, CSV Export, JSON Export, CodePen Export, nad local data management.
The application is deployed at https://lineup.js.org/app
LineUp is implemented in clean TypeScript in an object oriented manner. A fully generated API documentation based on TypeDoc is available at https://lineup.js.org/main/docs
LineUp can be build manually or using via the builder design pattern (see Advanced Usage Example). The builder design pattern in the more common way.
The simplest methods to create a new instance are:
- asLineUp returning a ready to use LineUp instance
asLineUp(node: HTMLElement, data: any[], ...columns: string[]): LineUp
- asTaggle returning a ready to use Taggle instance
asTaggle(node: HTMLElement, data: any[], ...columns: string[]): Taggle
- builder returning a new DataBuilder
builder(arr: any[]): DataBuilder`
The DataBuilder allows on the one hand to specify the individual columns more specificly and the creation of custom rankings.
Builder factory functions for creating column descriptions include:
- buildStringColumn returning a new StringColumnBuilder
buildStringColumn(column: string): StringColumnBuilder
- buildNumberColumn returning a new NumberColumnBuilder
buildNumberColumn(column: string, domain?: [number, number]): NumberColumnBuilder
- buildCategoricalColumn returning a new CategoricalColumnBuilder
buildCategoricalColumn(column: string, categories?: (string | Partial<ICategory>)[]): CategoricalColumnBuilder
- buildHierarchicalColumn returning a new HierarchyColumnBuilder
buildHierarchicalColumn(column: string, hierarchy?: IPartialCategoryNode): HierarchyColumnBuilder
- buildDateColumn returning a new DateColumnBuilder
buildDateColumn(column: string): DateColumnBuilder
- buildActionsColumn returning a new ActionsColumnBuilder
buildActionsColumn(): ActionsColumnBuilder
In order to build custom rankings within the DataBuilder the buildRanking returning a new RankingBuilder is used.
buildRanking(): RankingBuilderThe relevant classes for creating a LineUp instance manually are LineUp, Taggle, and LocalDataProvider. A LocalDataProvider is an sub class of ADataProvider implementing the data model management based on a local JavaScript array. LineUp and Taggle are the visual interfaces to the LocalDataProvider.
The classes can be instantiated either using the factory pattern or via their regular class constructors:
createLineUp(container: HTMLElement, data: ADataProvider, config?: Partial<ILineUpOptions>): LineUp

createTaggle(container: HTMLElement, data: ADataProvider, config?: Partial<ITaggleOptions>): Taggle

createLocalDataProvider(data: any[], columns: IColumnDesc[], options?: Partial<ILocalDataProviderOptions>): LocalDataProvider
new LineUp(node: HTMLElement, data: DataProvider, options?: Partial<ILineUpOptions>): LineUp
new Taggle(node: HTMLElement, data: DataProvider, options?: Partial<ITaggleOptions>): Taggle
new LocalDataProvider(data: any[], columns?: IColumnDesc[], options?: Partial<ILocalDataProviderOptions & IDataProviderOptions>): LocalDataProviderBoth LineUp and Taggle are sub classes of ALineUp. The most important functions of this class include:
getHighlight(): number/setHighlight(dataIndex: number): voidto get and set the highlighted row identified by its index in the data. If none is highlighted-1is returned.getSelection(): number[]/setSelection(dataIndices: number[]): voidto get and set the selected rows identified by their indices in the dataon(type: string, listener: IEventListener | null): thisto listen to highlight and selection events. LineUp.js event mechanism is based on d3 dispatch, thus instead of anoffmethodnullis passed to disable listening to the event. The following events are sent out:
A React wrapper is located at lineupjsx.
Installation
npm install --save lineupjsx<link href="https://unpkg.com/lineupjsx/build/LineUpJSx.css" rel="stylesheet" />
<script src="https://unpkg.com/lineupjsx/build/LineUpJSx.js"></script>Minimal Usage Example
// generate some data
const arr = [];
const cats = ['c1', 'c2', 'c3'];
for (let i = 0; i < 100; ++i) {
  arr.push({
    a: Math.random() * 10,
    d: 'Row ' + i,
    cat: cats[Math.floor(Math.random() * 3)],
    cat2: cats[Math.floor(Math.random() * 3)],
  });
}<LineUp data={arr} />Result is same as the builder minimal example
Advanced Usage Example
// arr from before
<LineUp data={arr} defaultRanking>
  <LineUpStringColumnDesc column="d" label="Label" width={100} />
  <LineUpCategoricalColumnDesc column="cat" categories={cats} color="green" />
  <LineUpCategoricalColumnDesc column="cat2" categories={cats} color="blue" />
  <LineUpNumberColumnDesc column="a" domain={[0, 10]} color="blue" />

  <LineUpRanking groupBy="cat" sortBy="a:desc">
    <LineUpSupportColumn type="*" />
    <LineUpColumn column="*" />
    <LineUpImposeColumn label="a+cat" column="a" categeoricalColumn="cat2" />
  </LineUpRanking>
</LineUp>Result is same as the builder advanced example
An Angular wrapper is located at nglineup.
Installation
npm install --save nglineupMinimal Usage Example
app.module.ts:
import { BrowserModule } from '@angular/platform-browser';
import { NgModule } from '@angular/core';
import { LineUpModule } from '../lib/lineup.module';

import { AppComponent } from './app.component.1';

@NgModule({
  declarations: [AppComponent],
  imports: [BrowserModule, LineUpModule],
  providers: [],
  bootstrap: [AppComponent],
})
export class AppModule {}app.component.ts:
import { Component } from '@angular/core';

@Component({
  selector: 'app-root',
  templateUrl: './app.component.html',
})
export class AppComponent {
  readonly data = <any[]>[];

  readonly cats = ['c1', 'c2', 'c3'];

  constructor() {
    const cats = this.cats;
    for (let i = 0; i < 100; ++i) {
      this.data.push({
        a: Math.random() * 10,
        d: 'Row ' + i,
        cat: cats[Math.floor(Math.random() * 3)],
        cat2: cats[Math.floor(Math.random() * 3)],
      });
    }
  }
}app.component.html:
<lineup-lineup [data]="data"></lineup-lineup>Result is same as the builder minimal example
Advanced Usage Example
app.component.html:
<lineup-lineup [data]="data" [defaultRanking]="true" style="height: 800px;">
  <lineup-string-column-desc column="d" label="Label" [width]="100"></lineup-string-column-desc>
  <lineup-categorical-column-desc column="cat" [categories]="cats" color="green"></lineup-categorical-column-desc>
  <lineup-categorical-column-desc column="cat2" [categories]="cats" color="blue"></lineup-categorical-column-desc>
  <lineup-number-column-desc column="a" [domain]="[0, 10]" color="blue"></lineup-number-column-desc>

  <lineup-ranking groupBy="cat" sortBy="a:desc">
    <lineup-support-column type="*"></lineup-support-column>
    <lineup-column column="*"></lineup-column>
    <lineup-impose-column label="a+cat" column="a" categoricalColumn="cat2"></lineup-impose-column>
  </lineup-ranking>
</lineup-lineup>Result is same as the builder advanced example
A Vue.js wrapper is located at vue-lineup.
Installation
npm install --save vue-lineupMinimal Usage Example
const cats = ['c1', 'c2', 'c3'];
const data = [];
for (let i = 0; i < 100; ++i) {
  data.push({
    a: Math.random() * 10,
    d: 'Row ' + i,
    cat: cats[Math.floor(Math.random() * 3)],
    cat2: cats[Math.floor(Math.random() * 3)],
  });
}

// enable plugin to register components
Vue.use(VueLineUp);

const app = new Vue({
  el: '#app',
  template: `<LineUp v-bind:data="data" />`,
  data: {
    cats,
    data,
  },
});Result is same as the builder minimal example
Advanced Usage Example
const app = new Vue({
  el: '#app',
  template: `<LineUp v-bind:data="data" defaultRanking="true" style="height: 800px">
    <LineUpStringColumnDesc column="d" label="Label" v-bind:width="100" />
    <LineUpCategoricalColumnDesc column="cat" v-bind:categories="cats" color="green" />
    <LineUpCategoricalColumnDesc column="cat2" v-bind:categories="cats" color="blue" />
    <LineUpNumberColumnDesc column="a" v-bind:domain="[0, 10]" color="blue" />
    <LineUpRanking groupBy="cat" sortBy="a:desc">
      <LineUpSupportColumn type="*" />
      <LineUpColumn column="*" />
    </LineUpRanking>
  </LineUp>`,
  data: {
    cats,
    data,
  },
});Result is same as the builder advanced example
A Polymer 2.0 web component wrapper is located at lineup-element.
Installation
bower install https://github.com/lineupjs/lineup-element<link rel="import" href="bower_components/lineup-element/lineup-element.html" />Minimal Usage Example
// generate some data
const arr = [];
const cats = ['c1', 'c2', 'c3'];
for (let i = 0; i < 100; ++i) {
  arr.push({
    a: Math.random() * 10,
    d: 'Row ' + i,
    cat: cats[Math.floor(Math.random() * 3)],
    cat2: cats[Math.floor(Math.random() * 3)]
  })
}
conat data = { arr, cats };<lineup-element data="[[data.arr]]"></lineup-element>TODO CodePen
Result is same as the builder minimal example
Advanced Usage Example
// arr from before
<lineup-element data="[[data.arr]]" side-panel side-panel-collapsed default-ranking="true">
  <lineup-string-desc column="d" label="Label" width="100"></lineup-string-desc>
  <lineup-categorical-desc column="cat" categories="[[cats]]" color="green"></lineup-categorical-desc>
  <lineup-categorical-desc column="cat2" categories="[[cats]]" color="blue"></lineup-categorical-desc>
  <lineup-number-desc column="a" domain="[0, 10]" color="blue"></lineup-number-desc>
  <lineup-ranking group-by="cat" sort-by="a:desc">
    <lineup-support-column type="*"></lineup-support-column>
    <lineup-column column="*"></lineup-column>
  </lineup-ranking>
</lineup-element>
TODO CodePen
Result is same as the builder advanced example
A HTMLWidget wrapper for R is located at lineup_htmlwidget. It can be used within standalone R Shiny apps or R Markdown files. Integrated plotting does not work due to an outdated integrated Webkit version in RStudio. Crosstalk is supported for synching selections and filtering among widgets.
Installation
devtools::install_github("rstudio/crosstalk")
devtools::install_github("lineupjs/lineup_htmlwidget")
library(lineupjs)
Examples
lineup(iris)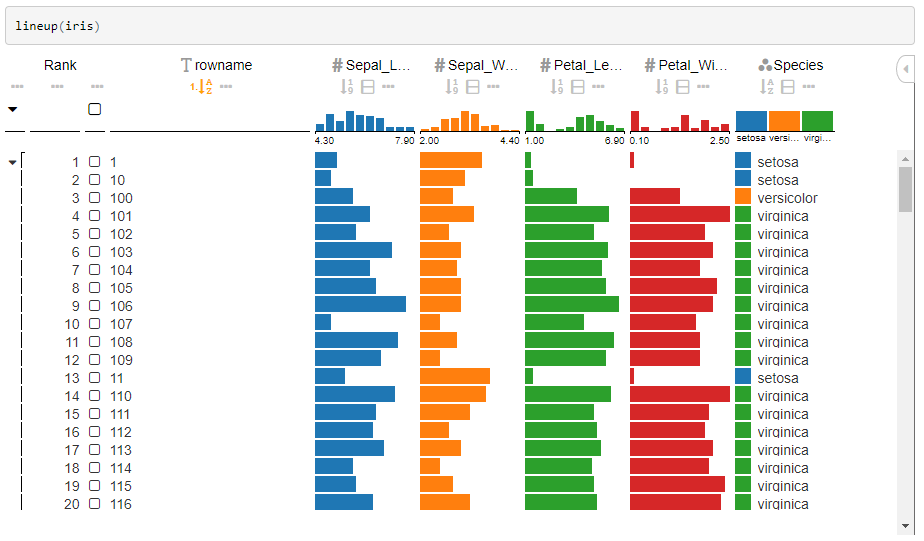
A Jupyter Widget wrapper for Python is located at lineup_widget.
Installation
pip install -e git+https://github.com/lineupjs/lineup_widget.git#egg=lineup_widget
jupyter nbextension enable --py [--sys-prefix|--user|--system] lineup_widget
Or, if you use jupyterlab:
pip install -e git+https://github.com/lineupjs/lineup_widget.git#egg=lineup_widget
jupyter labextension install @jupyter-widgets/jupyterlab-manager
Examples
import lineup_widget
import pandas as pd
import numpy as np

df = pd.DataFrame(np.random.randint(0,100,size=(100, 4)), columns=list('ABCD'))

w = lineup_widget.LineUpWidget(df)
w.on_selection_changed(lambda selection: print(selection))
w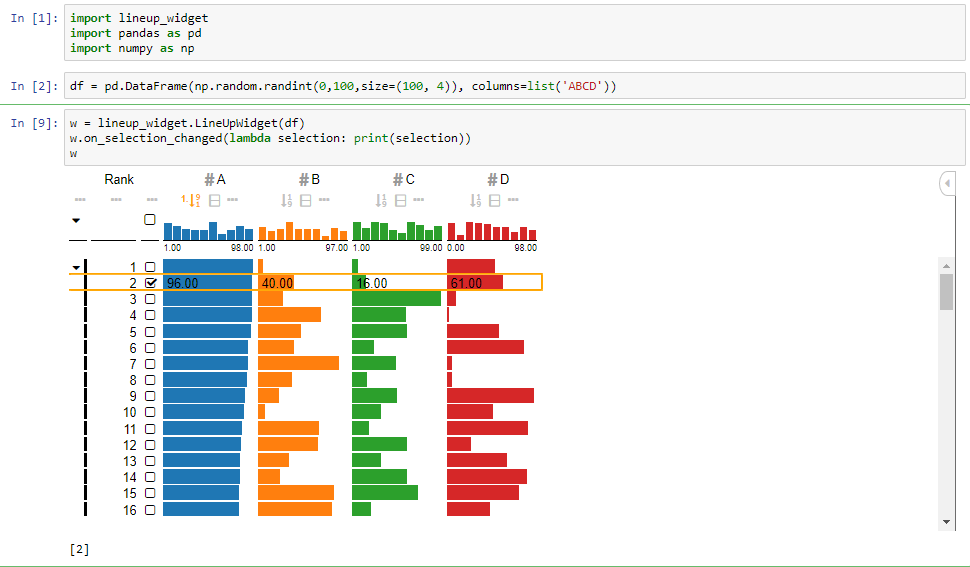
from __future__ import print_function
from ipywidgets import interact, interactive, interact_manual

def selection_changed(selection):
    return df.iloc[selection]

interact(selection_changed, selection=lineup_widget.LineUpWidget(df));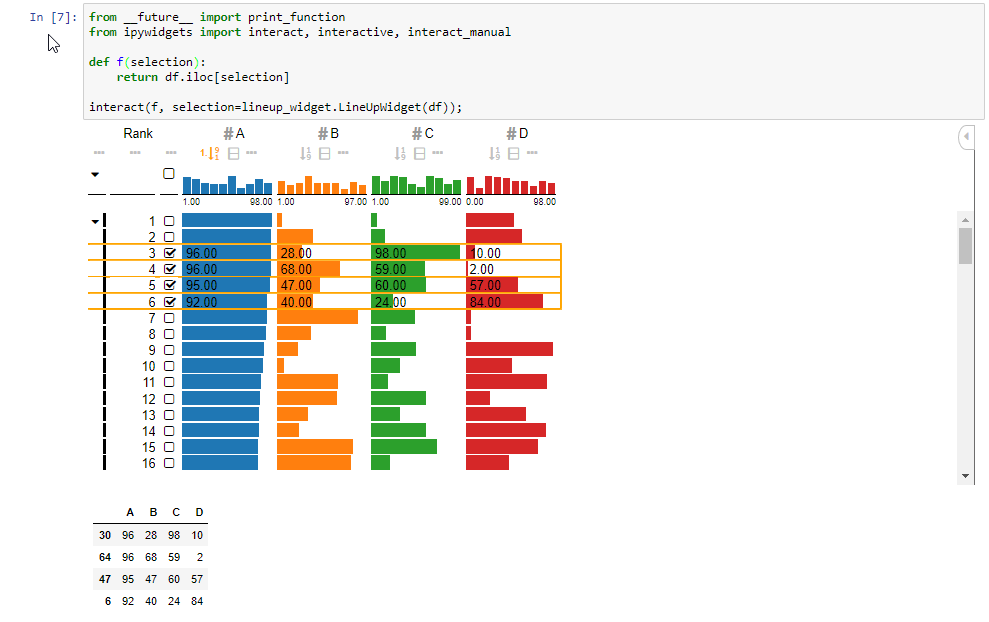
A ObservableHQ wrapper is located at lineup-js-observable.
data = {
  const arr = [];
  const cats = ['c1', 'c2', 'c3'];
  for (let i = 0; i < 100; ++i) {
    arr.push({
      a: Math.random() * 10,
      d: 'Row ' + i,
      cat: cats[Math.floor(Math.random() * 3)],
      cat2: cats[Math.floor(Math.random() * 3)]
    })
  }
  return arr;
}
import { asLineUp } from '@sgratzl/lineup-js-observable-library';viewof selection = asLineUp(arr)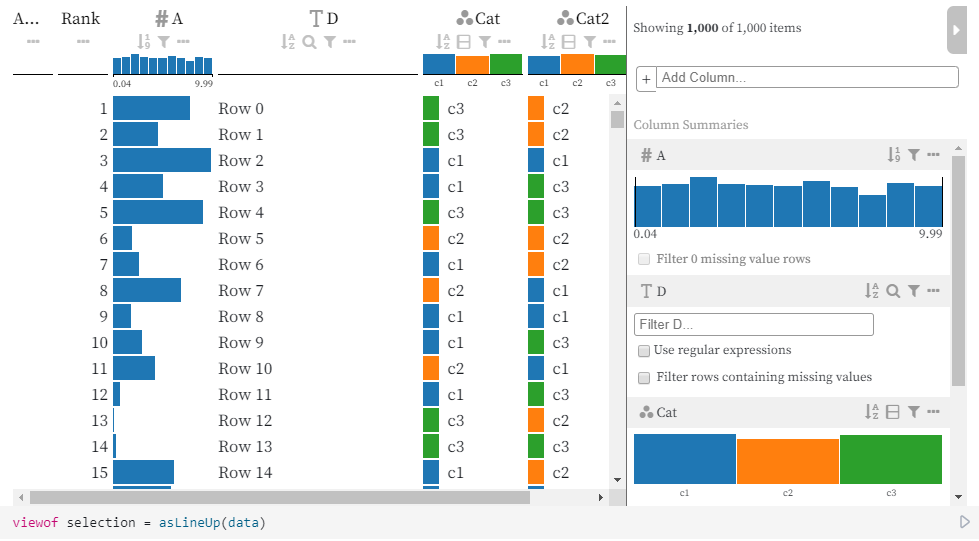
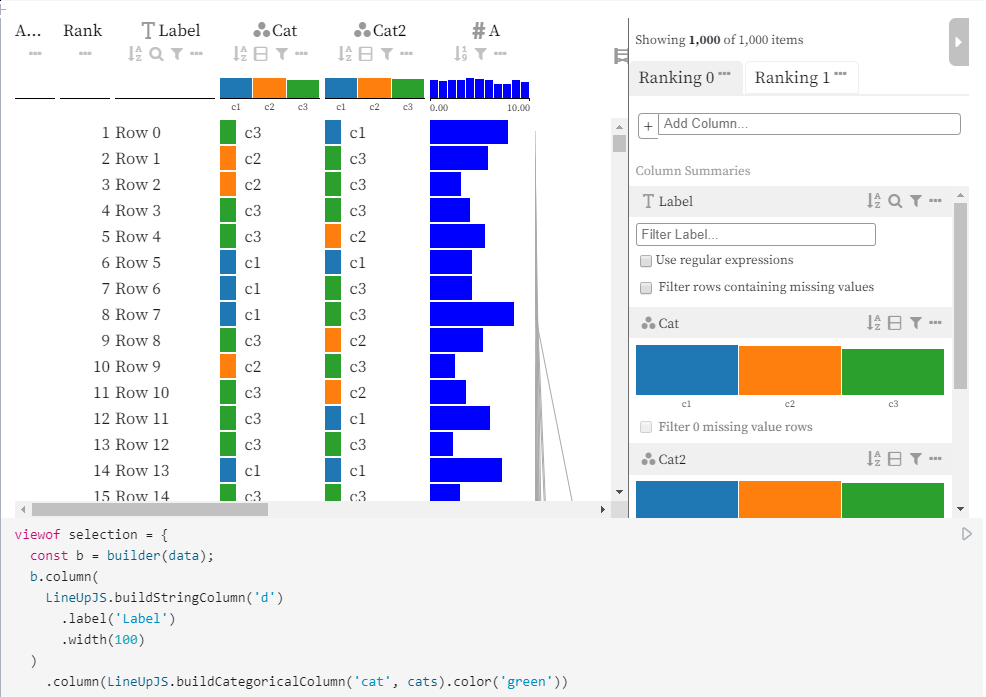
// arr from before
viewof selection = {
  const b = builder(data);
  b.column(
    LineUpJS.buildStringColumn('d')
      .label('Label')
      .width(100)
  )
    .column(LineUpJS.buildCategoricalColumn('cat', cats).color('green'))
    .column(LineUpJS.buildCategoricalColumn('cat2', cats).color('blue'))
    .column(LineUpJS.buildNumberColumn('a', [0, 10]).color('blue'));

  // and two rankings
  const ranking = LineUpJS.buildRanking()
    .supportTypes()
    .allColumns() // add all columns
    .impose('a+cat', 'a', 'cat2') // create composite column
    .groupBy('cat')
    .sortBy('a', 'desc');

  b.defaultRanking().ranking(ranking);
  return b.build();
}
A PowerBI Visual wrapper is located at lineup_powerbi.
Installation
TODO
Examples
TODO
See API documentation and Develop API documentation
See Demos, Develop Demos, and R Demos
LineUp: Visual Analysis of Multi-Attribute Rankings Paper Paper Website
Samuel Gratzl, Alexander Lex, Nils Gehlenborg, Hanspeter Pfister, and Marc Streit
IEEE Transactions on Visualization and Computer Graphics (InfoVis '13), 19(12), pp. 2277–2286, doi:10.1109/TVCG.2013.173, 2013.
🏆 IEEE VIS InfoVis 2013 Best Paper Award
Taggle: Scalable Visualization of Tabular Data through Aggregation Paper Preprint Paper Website
Katarina Furmanova, Samuel Gratzl, Holger Stitz, Thomas Zichner, Miroslava Jaresova, Martin Ennemoser, Alexander Lex, and Marc Streit
Information Visualization, 19(2): 114-136, doi:10.1177/1473871619878085, 2019.
LineUp.js depends on
- LineUpEngine table rendering engine
- D3 utilities: scales, format, dragging
- Popper.js dialogs
Development Dependencies
Webpack is used as build tool. LineUp itself is written in TypeScript and SASS.
Installation
The setup requires Node.js v16 or higher.
git clone https://github.com/lineupjs/lineupjs.git -b develop
cd lineupjs
npm i -g yarn
yarn install
yarn sdks vscodeyarn start
yarn run clean
yarn run compile
yarn test
yarn run lint
yarn run fix
yarn run build
yarn run docsRun E2E Tests
via cypress.io
Variant 1: with prebuilt LineUp
yarn run compile
yarn run build
yarn run cy:compile
yarn run cy:open
Variant 2: with webpack-dev-server
first shell:
yarn startsecond shell:
yarn run cy:compile
yarn run cy:start- Samuel Gratzl (@sgratzl)
- Holger Stitz (@thinkh)
- The Caleydo Team (@caleydo)
- datavisyn GmbH (@datavisyn)
 This repository was created as part of the The Caleydo Project.


![dependabot[bot] avatar](https://avatars.githubusercontent.com/in/29110?v=4 "dependabot[bot]")