Coder Social home page Coder Social logo

kroitor / asciichart Goto Github PK

View Code? Open in Web Editor NEW
1.8K 33.0 95.0 264 KB

Nice-looking lightweight console ASCII line charts ╭┈╯ for NodeJS, browsers and terminal, no dependencies

License: MIT License

JavaScript 33.71% HTML 22.71% Python 43.58%
console-log console js ascii chart plot graph nodejs text-chart ascii-chart

asciichart's Introduction

asciichart

npm PyPI Travis Coverage Status license

Console ASCII line charts in pure Javascript (for NodeJS and browsers) with no dependencies.

Console ASCII Line charts in pure Javascript (for NodeJS and browsers)

Usage

NodeJS

npm install asciichart
var asciichart = require ('asciichart')
var s0 = new Array (120)
for (var i = 0; i < s0.length; i++)
    s0[i] = 15 * Math.sin (i * ((Math.PI * 4) / s0.length))
console.log (asciichart.plot (s0))

Browsers

<!DOCTYPE html>
<html>
    <head>
        <meta http-equiv="Content-Type" content="text/html; charset=utf-8">
        <meta charset="UTF-8">
        <title>asciichart</title>
        <script src="asciichart.js"></script>
        <script type="text/javascript">
            var s0 = new Array (120)
            for (var i = 0; i < s0.length; i++)
                s0[i] = 15 * Math.sin (i * ((Math.PI * 4) / s0.length))
            console.log (asciichart.plot (s0))
        </script>
    </head>
    <body>
    </body>
</html>

Options

The width of the chart will always equal the length of data series. The height and range are determined automatically.

var s0 = new Array (120)
for (var i = 0; i < s0.length; i++)
    s0[i] = 15 * Math.sin (i * ((Math.PI * 4) / s0.length))
console.log (asciichart.plot (s0))

Console ASCII Line charts in pure Javascript (for NodeJS and browsers)

The output can be configured by passing a second parameter to the plot (series, config) function. The following options are supported:

var config = {

    offset:  3,          // axis offset from the left (min 2)
    padding: '       ',  // padding string for label formatting (can be overridden)
    height:  10,         // any height you want

    // the label format function applies default padding
    format:  function (x, i) { return (padding + x.toFixed (2)).slice (-padding.length) }
}

Scale To Desired Height

Console ASCII Line charts in pure Javascript (for NodeJS and browsers)

var s = []
for (var i = 0; i < 120; i++)
    s[i] = 15 * Math.cos (i * ((Math.PI * 8) / 120)) // values range from -15 to +15
console.log (asciichart.plot (s, { height: 6 }))     // this rescales the graph to ±3 lines

Console ASCII Line charts in pure Javascript (for NodeJS and browsers)

Auto-range

var s2 = new Array (120)
s2[0] = Math.round (Math.random () * 15)
for (i = 1; i < s2.length; i++)
    s2[i] = s2[i - 1] + Math.round (Math.random () * (Math.random () > 0.5 ? 2 : -2))
console.log (asciichart.plot (s2))

Console ASCII Line charts in pure Javascript (for NodeJS and browsers)

Multiple Series

var s2 = new Array (120)
s2[0] = Math.round (Math.random () * 15)
for (i = 1; i < s2.length; i++)
    s2[i] = s2[i - 1] + Math.round (Math.random () * (Math.random () > 0.5 ? 2 : -2))

var s3 = new Array (120)
s3[0] = Math.round (Math.random () * 15)
for (i = 1; i < s3.length; i++)
    s3[i] = s3[i - 1] + Math.round (Math.random () * (Math.random () > 0.5 ? 2 : -2))

console.log (asciichart.plot ([ s2, s3 ]))

Console ASCII Line charts in pure Javascript (for NodeJS and browsers)

Colors

var arr1 = new Array (120)
arr1[0] = Math.round (Math.random () * 15)
for (i = 1; i < arr1.length; i++)
    arr1[i] = arr1[i - 1] + Math.round (Math.random () * (Math.random () > 0.5 ? 2 : -2))

var arr2 = new Array (120)
arr2[0] = Math.round (Math.random () * 15)
for (i = 1; i < arr2.length; i++)
    arr2[i] = arr2[i - 1] + Math.round (Math.random () * (Math.random () > 0.5 ? 2 : -2))

var arr3 = new Array (120)
arr3[0] = Math.round (Math.random () * 15)
for (i = 1; i < arr3.length; i++)
    arr3[i] = arr3[i - 1] + Math.round (Math.random () * (Math.random () > 0.5 ? 2 : -2))

var arr4 = new Array (120)
arr4[0] = Math.round (Math.random () * 15)
for (i = 1; i < arr4.length; i++)
    arr4[i] = arr4[i - 1] + Math.round (Math.random () * (Math.random () > 0.5 ? 2 : -2))

var config = {
    colors: [
        asciichart.blue,
        asciichart.green,
        asciichart.default, // default color
        undefined, // equivalent to default
    ]
}

console.log (asciichart.plot([ arr1, arr2, arr3, arr4 ], config))

Console ASCII Line charts in pure Javascript (for NodeJS and browsers)

See Also

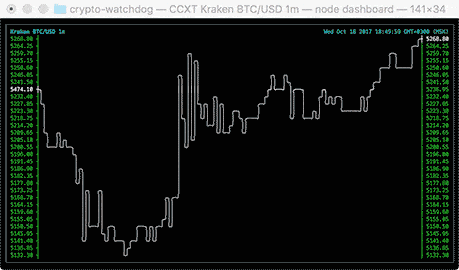
A util by madnight for drawing Bitcoin/Ether/altcoin charts in command-line console: bitcoin-chart-cli.

bitcoin-chart-cli

Ports

Special thx to all who helped port it to other languages, great stuff!

Future work (coming soon, hopefully)

  • levels and points on the graph!
  • even better value formatting and auto-scaling!

preview

asciichart's People

Contributors

0xflotus avatar annacrombie avatar asukaminato0721 avatar bessarabov avatar blmayer avatar cclauss avatar civitasv avatar csenshi avatar dependabot[bot] avatar jamesgpearce avatar kroitor avatar nathanbaulch avatar neighthan avatar nicolassoemer avatar orhanbalci avatar pkazmier avatar pokutuna avatar snobu avatar xpl avatar yehushuabendavid avatar

Stargazers

 avatar  avatar  avatar  avatar  avatar  avatar  avatar  avatar  avatar  avatar  avatar  avatar  avatar  avatar  avatar  avatar  avatar  avatar  avatar  avatar  avatar  avatar  avatar  avatar  avatar  avatar  avatar  avatar  avatar  avatar  avatar  avatar  avatar  avatar  avatar  avatar  avatar  avatar  avatar  avatar  avatar  avatar  avatar  avatar  avatar  avatar  avatar  avatar  avatar  avatar  avatar  avatar  avatar  avatar  avatar  avatar  avatar  avatar  avatar  avatar  avatar  avatar  avatar  avatar  avatar  avatar  avatar  avatar  avatar  avatar  avatar  avatar  avatar  avatar  avatar  avatar  avatar  avatar  avatar  avatar  avatar  avatar  avatar  avatar  avatar  avatar  avatar  avatar  avatar  avatar  avatar  avatar  avatar  avatar  avatar  avatar  avatar  avatar  avatar  avatar

Watchers

 avatar  avatar  avatar  avatar  avatar  avatar  avatar  avatar  avatar  avatar  avatar  avatar  avatar  avatar  avatar  avatar  avatar  avatar  avatar  avatar  avatar  avatar  avatar  avatar  avatar  avatar  avatar  avatar  avatar  avatar  avatar  avatar  avatar

asciichart's Issues

Height cannot be exactly configured

Though there is a height parameter for the plotting function, this only roughly controls the height. It would be nicer to be able to exactly set the height. This is even more of an issue because the height isn't always off of the requested height by the same value, so it's not trivial to correct for this. Here are a couple of examples:

Requested height: 9; actual height: 10

$ pplot 1 10 --height 9
   10.00  ┤╭ 
    9.00  ┤│ 
    8.00  ┤│ 
    7.00  ┤│ 
    6.00  ┤│ 
    5.00  ┤│ 
    4.00  ┤│ 
    3.00  ┤│ 
    2.00  ┤│ 
    1.00  ┼╯ 

Requested height: 8; actual height: 10

$ pplot 1 10 --height 8
   10.00  ┼╭ 
    9.00  ┤│ 
    8.00  ┤│ 
    7.00  ┤│ 
    6.00  ┤│ 
    5.00  ┤│ 
    4.00  ┤│ 
    3.00  ┤│ 
    2.00  ┤╯ 
    1.00  ┼  

The issue is with the floor and ceil operators that are used in computing the actual number of rows.

Here's a quick fix for this in the Python version:

    target_height = cfg['height'] if 'height' in cfg else interval
    actual_height = float("inf")

    i = 0
    while actual_height > target_height:
        ratio = (target_height - i) / interval
        min2 = floor(minimum * ratio)
        max2 = ceil(maximum * ratio)
        actual_height = max2 - min2 + 1
        i += 1

    assert actual_height == target_height

I just keep decreasing the height value used by 1 until the actual height matches the target height. This has always given me an actual height that's exactly the target height in the quick tests I've done, but there's probably a better way to do this. I also considered decreasing max2 or increasing min2 by 1 directly, but then we'd also need to set a new value for ratio, at least to keep the current behavior, and I'm not sure what the appropriate way to do that would be.

Small values all turns into 0s

reproducing:

const chart = require("asciichart")

const data = [
    [0, 0.1, 0.2, 0.3]
]
console.log('raw')
console.log(chart.plot(data))
console.log('turn into percents')
console.log(chart.plot(data.map(s=>s.map(v=>v*100 |0))))

output:
image

hm, bit steep

suggestion/request: setting the step size (or better automatic detection)

Translate into haxe

Haxe is a ECMAScript implementation transpiled into a variety of languages including python, C++ and Java. I guess porting the lib into haxe should allow it to be used from them all.

Max/min values not reached

Depending on the height set for a chart (even if the y-axis labels are exactly the same), the appropriate values are not always reached (at least when these are the max / min values; I haven't tested enough to check others yet). E.g., using the Python version, everything looks fine in this first plot:

$ pplot 1 10 --height 9
   10.00  ┤╭ 
    9.00  ┤│ 
    8.00  ┤│ 
    7.00  ┤│ 
    6.00  ┤│ 
    5.00  ┤│ 
    4.00  ┤│ 
    3.00  ┤│ 
    2.00  ┤│ 
    1.00  ┼╯ 

but if we change the height to 8, even though we still achieve exactly the first and last values on the y-axis, it's shown that the first point is 2 instead of 1:

$ pplot 1 10 --height 8
   10.00  ┼╭ 
    9.00  ┤│ 
    8.00  ┤│ 
    7.00  ┤│ 
    6.00  ┤│ 
    5.00  ┤│ 
    4.00  ┤│ 
    3.00  ┤│ 
    2.00  ┤╯ 
    1.00  ┼  

If we increase the height, then we don't reach the max value anymore:

$ pplot 1 10 --height 10
   10.00  ┤  
    9.18  ┤╭ 
    8.36  ┤│ 
    7.55  ┤│ 
    6.73  ┤│ 
    5.91  ┤│ 
    5.09  ┤│ 
    4.27  ┤│ 
    3.45  ┤│ 
    2.64  ┤│ 
    1.82  ┤│ 
    1.00  ┼╯ 

Failure with very long series

Since version 1.5.10 the following fails:

asciiplot([1.]*1000, 80, 15)

With the following error:

ValueError: The truth value of an array with more than one element is ambiguous. Use a.any() or a.all()

Python crashes on empty charts

Trying to chart with an empty list shouldn't crash.

import asciichartpy

asciichartpy.plot([])

Causes this:

Traceback (most recent call last):
  File "terminal_chart.py", line 18, in <module>
    print(asciichartpy.plot(losses, chart_config))
  File "/Users/lib/python3.7/site-packages/asciichartpy/__init__.py", line 25, in plot
    ratio = height / interval
ZeroDivisionError: float division by zero

Way of labeling x axis

Hey!

I think it would be really awesome to be able to label the x axis. Are there any plans of supporting this?

.

Wow u too good...this is very nice

[Python] height off-by-one bug?

This looks like an off-by-one bug for height — can you confirm?

In [9]: print(asciichartpy.plot([0, 0, 1, 2], {'height': 1}))
    2.00  ┼  ╭ 
    0.00  ┼──╯ 

In [10]: print(asciichartpy.plot([0, 0, 1, 2], {'height': 2}))
    2.00  ┼  ╭ 
    1.00  ┤ ╭╯ 
    0.00  ┼─╯  

In [11]: print(asciichartpy.plot([0, 0, 1, 2], {'height': 5}))
    2.00  ┼  ╭ 
    1.60  ┤  │ 
    1.20  ┤  │ 
    0.80  ┤ ╭╯ 
    0.40  ┤ │  
    0.00  ┼─╯  

it is not ascii chart

characters from base ASCII table range from 0 to 127 and those from extended ASCII table are within 0 to 255.
the characters used in the project fall outside of either of the two ranges.

Live Updating

Hi man,

This is an awesome lib! I'm wondering if you could give some hints as to how you made the live-updating example work (looking to do it in python).

awesome live ascii chart

print out to png

Question:

Is there a python method to convert the final print out to png ?

Cannot plot a chart with a single repeating value (horizontal line)

When I try to plot a chart with an array of values such as [100, 100, 100], eg.

var asciichart = require('asciichart');
asciichart.plot([100, 100, 100], {
  height: 10,
});

I get the following error

/Users/pghalliday/projects/github/pghalliday/metriculator/node_modules/asciichart/asciichart.js:29
        let result = new Array (rows + 1) // empty space
                     ^

RangeError: Invalid array length
    at Object.exports.plot (/Users/pghalliday/projects/github/pghalliday/metriculator/node_modules/asciichart/asciichart.js:29:22)
    at Object.<anonymous> (/Users/pghalliday/projects/github/pghalliday/metriculator/test.js:2:12)
    at Module._compile (module.js:662:30)
    at Object.Module._extensions..js (module.js:673:10)
    at Module.load (module.js:575:32)
    at tryModuleLoad (module.js:515:12)
    at Function.Module._load (module.js:507:3)
    at Function.Module.runMain (module.js:703:10)
    at startup (bootstrap_node.js:193:16)
    at bootstrap_node.js:660:3

This seems to be due to the way the number of rows are calculated based on the range (which in this case I presume is calculated to zero). The same error occurs if I supply an empty array or an array with just 1 value. I think a possible fix would be to define a default range if one cannot be sensibly calculated. This should probably be added to the options in some way.

This impacts me as I'm starting with an empty chart and adding values over time. For now I have worked around it by ensuring that the range is non-zero before plotting. However this leads to an odd corner case where the last n entries for a chart that only plots n entries (due to screen width) are all equal (even if previous entries are not) then the chart cannot be updated.

Graph characters not clearing on row change (asciichartpy)?

I didn't seem to have this problem with a previous version, but since dropping in 1.5.12 (thank you for reimplementing the user specification of characters!), I've got this issue where the graph doesn't clear adjacent rows when it shifts; see screenshot.

asciichartpy bug

When the graph is at its max width and redrawing over a previous graph, it no longer clears these characters when scrolling. I looked at the commit history, and determined this bug is caused by commit e9adb0d, with the addition of the .rstrip() call; when I edited my init.py and removed .rstrip() the graph behaves as it used to.

Monospace formatting issues on web browsers

Am trying to render the raw output within

 tags.

Screen Shot 2019-10-14 at 5 37 56 PM

Have had this issue on Android and macOS firefox/chrome already. My Linux computer with Chrome seems okay.

Is there anything we can do about this? Thanks.

New features

I like this simple, easy to use package that I use for node statistic clis.
I'm missing some nice to have options though:

Multiple series
Ability to see more than one series on the same chart

Colors
Ability to affect colors to lines. npm's colors may be used there

Max width
Some charts can be way larger than a terminal. Detecting the terminal length and sub-setting the series sent may be a good way to tackle this issue

readme disagrees with license

The README says:

This code is absolutely free for any usage, you just do whatever the fuck you want.

Yet since 70179e1 this doesn't seem to be true anymore.

[Enhancement] Max width parameter

It would be nice to be able to specify the maximum width of a plot as well as the height. The width is determined by both the data given and the y axis (which depends on the format string used). Though this could be handled externally, by only passing in the appropriate amount of data, I think it might be nice to do this internally so that users don't have to factor in the offset + axis when determining how much data to pass in. I think the simplest approach would be to just keep the last n data points where n is the largest number such that the plot isn't too wide. One could also think of trying to plot every kth point where k is as small as possible such that the plot isn't too wide, but that's more complicated, so I wouldn't bother unless somebody cares enough to submit a PR for it. I can go ahead and do a PR for this in Python if you're interested.

Python

Python output looks terrible in a terminal, and there isn't any documentation on python support.

Also, I keep getting 0 division errors trying to plot floats.

Help?

broken chart with a big array

Im testing ascii chart with some long data array and when I console.log on terminal everything get broken, it doesnt look good

[ 968, 969, 968, 967, 967, 967, 967, 966, 966, 964, 964, 966, ... 21499 more items ]

Basically it start printing a lot of lines, this screenshot its only a snapshot of the long print
Screenshot 2019-11-13 at 15 25 58

The code im using is this. and the array result is the printed above.

const data = require('../data/1m/bitmex_BTCUSD_1m-15d.json');
const pricesData = data.map(tick => Math.round(tick.close));
console.log (asciichart.plot(pricesData));

Question - How to plot a live data stream

Hello,

First of all, thank you for your wonderful job. This is a very good library.

I am trying to graph a stream of data, can you help to point me in the right direction.

Thanks

Bricks/boxes instead of lines

Hello guys

Great project. This is not an issue is a question. I'm interested to use renko charts. Renko is a simple chart where if value increased on a specific amounts for example +20 it will create a upper box/brick and if after it it reduce to -20 the current value then it will show the brick/box down.

I wanted to know if there is a workaround to do it using this lib or if it could be easy to modify and some suggestions for me to do it. On other canvas based chart projects it can be done using range bars. Thanks.

Check the screenshot. And ignore the bars ar the bottom edge also ignore the lines/wicks coming out the bricks.
renko_example_gold_futures

Fixed y-axis

Hey, I extended this thing to allow a fixed y-axis, instead of computing the bounds automatically. Just add min- and max fields to the config object. The data will be clamped in case it goes out of bounds. Feel free to commit.


"use strict";

(function (exports) {

    exports.plot = function (series, cfg = undefined) {
        cfg         = (typeof cfg !== 'undefined') ? cfg : {}
        let min = cfg.min;
        let max = cfg.max;
        if (min === undefined || max === undefined) {
            min = series[0]
            max = series[0]
            for (let i = 1; i < series.length; i++) {
                min = Math.min (min, series[i])
                max = Math.max (max, series[i])
            }
        } else {
            // clamp values to min, max
            for (let i = 0; i < series.length; i++) {
                series[i] = Math.max(min, Math.min(max, series[i]))
            }
        }
        let range   = Math.abs (max - min)
        let offset  = (typeof cfg.offset  !== 'undefined') ? cfg.offset  : 3
        let padding = (typeof cfg.padding !== 'undefined') ? cfg.padding : '           '
        let height  = (typeof cfg.height  !== 'undefined') ? cfg.height  : range
        let ratio   = range !== 0 ? height / range : 1;
        let min2    = Math.round (min * ratio)
        let max2    = Math.round (max * ratio)
        let rows    = Math.abs (max2 - min2)
        let width   = series.length + offset
        let format  = (typeof cfg.format !== 'undefined') ? cfg.format : function (x) {
            return (padding + x.toFixed (2)).slice (-padding.length)
        }
        let result = new Array (rows + 1) // empty space
        for (let i = 0; i <= rows; i++) {
            result[i] = new Array (width)
            for (let j = 0; j < width; j++) {
                result[i][j] = ' '
            }
        }
        for (let y = min2; y <= max2; ++y) { // axis + labels
            let label = format (rows > 0 ? max - (y - min2) * range / rows : y, y - min2)
            result[y - min2][Math.max (offset - label.length, 0)] = label
            result[y - min2][offset - 1] = (y == 0) ? '┼' : '┤'
        }

        let y0 = Math.round (series[0] * ratio) - min2
        result[rows - y0][offset - 1] = '┼' // first value

        for (let x = 0; x < series.length - 1; x++) { // plot the line
            let y0 = Math.round((series[x + 0] * ratio) - min2)
            let y1 = Math.round((series[x + 1] * ratio) - min2)
            if (y0 == y1) {
                result[rows - y0][x + offset] = '─'
            } else {
                result[rows - y1][x + offset] = (y0 > y1) ? '╰' : '╭'
                result[rows - y0][x + offset] = (y0 > y1) ? '╮' : '╯'
                let from = Math.min (y0, y1)
                let to = Math.max (y0, y1)
                for (let y = from + 1; y < to; y++) {
                    result[rows - y][x + offset] = '│'
                }
            }
        }

        return result.map (function (x) { return x.join ('') }).join ('\n')
    }

}) (typeof exports === 'undefined' ? /* istanbul ignore next */ this['asciichart'] = {} : exports);

Node 10 error

$ node -v
v10.2.1

$ yarn add asciichart --dev
error [email protected]: The engine "node" is incompatible with this module. Expected version ">=4 <=9".
error Found incompatible module

Recommend Projects

  • React photo React

    A declarative, efficient, and flexible JavaScript library for building user interfaces.

  • Vue.js photo Vue.js

    🖖 Vue.js is a progressive, incrementally-adoptable JavaScript framework for building UI on the web.

  • Typescript photo Typescript

    TypeScript is a superset of JavaScript that compiles to clean JavaScript output.

  • TensorFlow photo TensorFlow

    An Open Source Machine Learning Framework for Everyone

  • Django photo Django

    The Web framework for perfectionists with deadlines.

  • D3 photo D3

    Bring data to life with SVG, Canvas and HTML. 📊📈🎉

Recommend Topics

  • javascript

    JavaScript (JS) is a lightweight interpreted programming language with first-class functions.

  • web

    Some thing interesting about web. New door for the world.

  • server

    A server is a program made to process requests and deliver data to clients.

  • Machine learning

    Machine learning is a way of modeling and interpreting data that allows a piece of software to respond intelligently.

  • Game

    Some thing interesting about game, make everyone happy.

Recommend Org

  • Facebook photo Facebook

    We are working to build community through open source technology. NB: members must have two-factor auth.

  • Microsoft photo Microsoft

    Open source projects and samples from Microsoft.

  • Google photo Google

    Google ❤️ Open Source for everyone.

  • D3 photo D3

    Data-Driven Documents codes.