Coder Social home page Coder Social logo

jupytercalpoly / jupyterlab-interactive-dashboard-editor Goto Github PK

View Code? Open in Web Editor NEW
213.0 9.0 26.0 108.7 MB

A drag-and-drop dashboard editor for JupyterLab

Home Page: https://github.com/jupytercalpoly/jupyterlab-interactive-dashboard-editor

License: BSD 3-Clause "New" or "Revised" License

JavaScript 0.54% TypeScript 88.21% CSS 9.47% Shell 0.18% Python 1.60%
jupyterlab dashboard notebook jupyter

jupyterlab-interactive-dashboard-editor's Introduction

jupyterlab-interactive-dashboard-editor

Github Actions Status Binder npm version Documentation Status

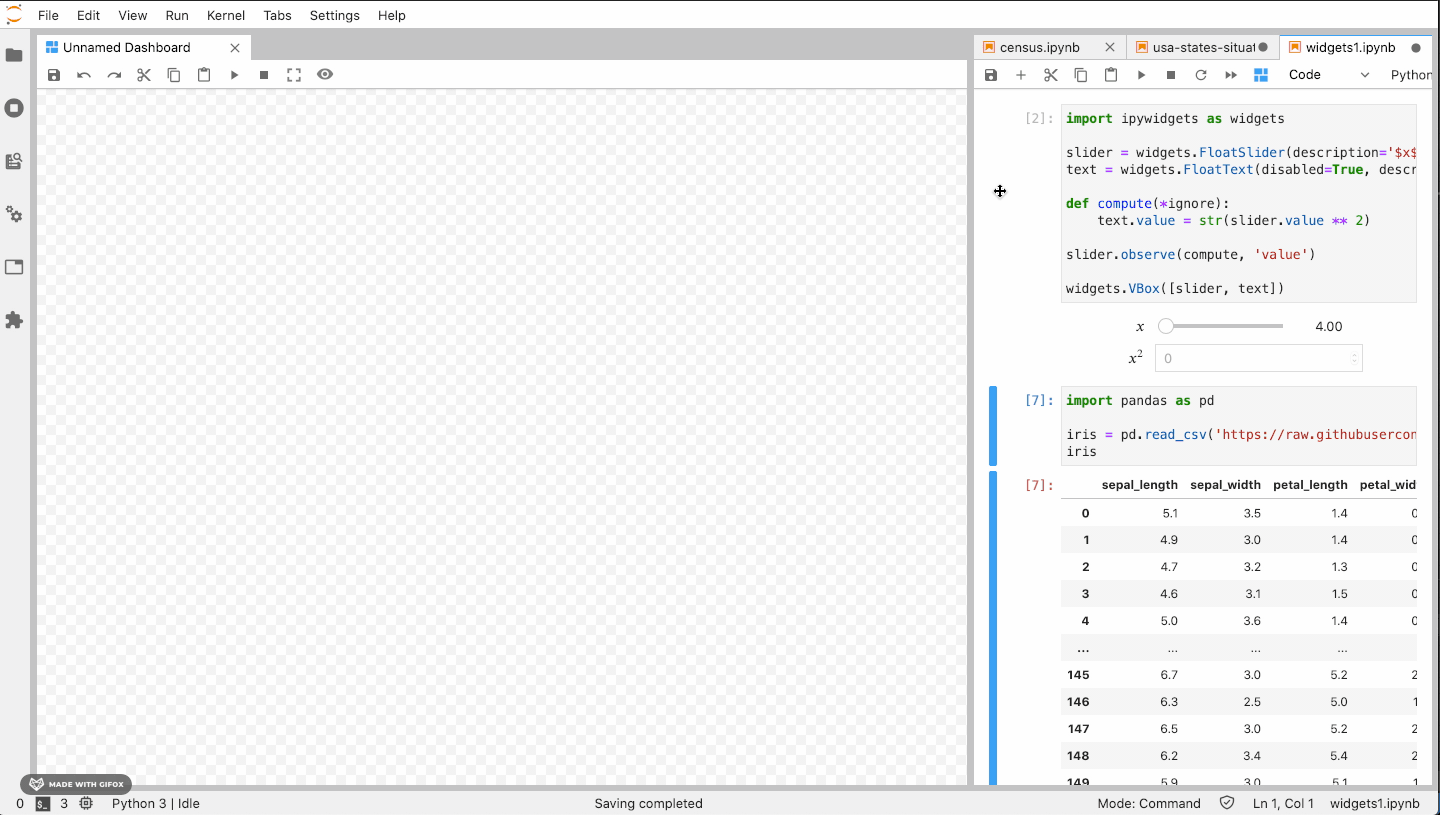
Interactively create and customize dashboards in JupyterLab

presto-overview

Additional Gifs

Click to expand Add and rearrange outputs on dashboards right from your notebook.

add-move-resize

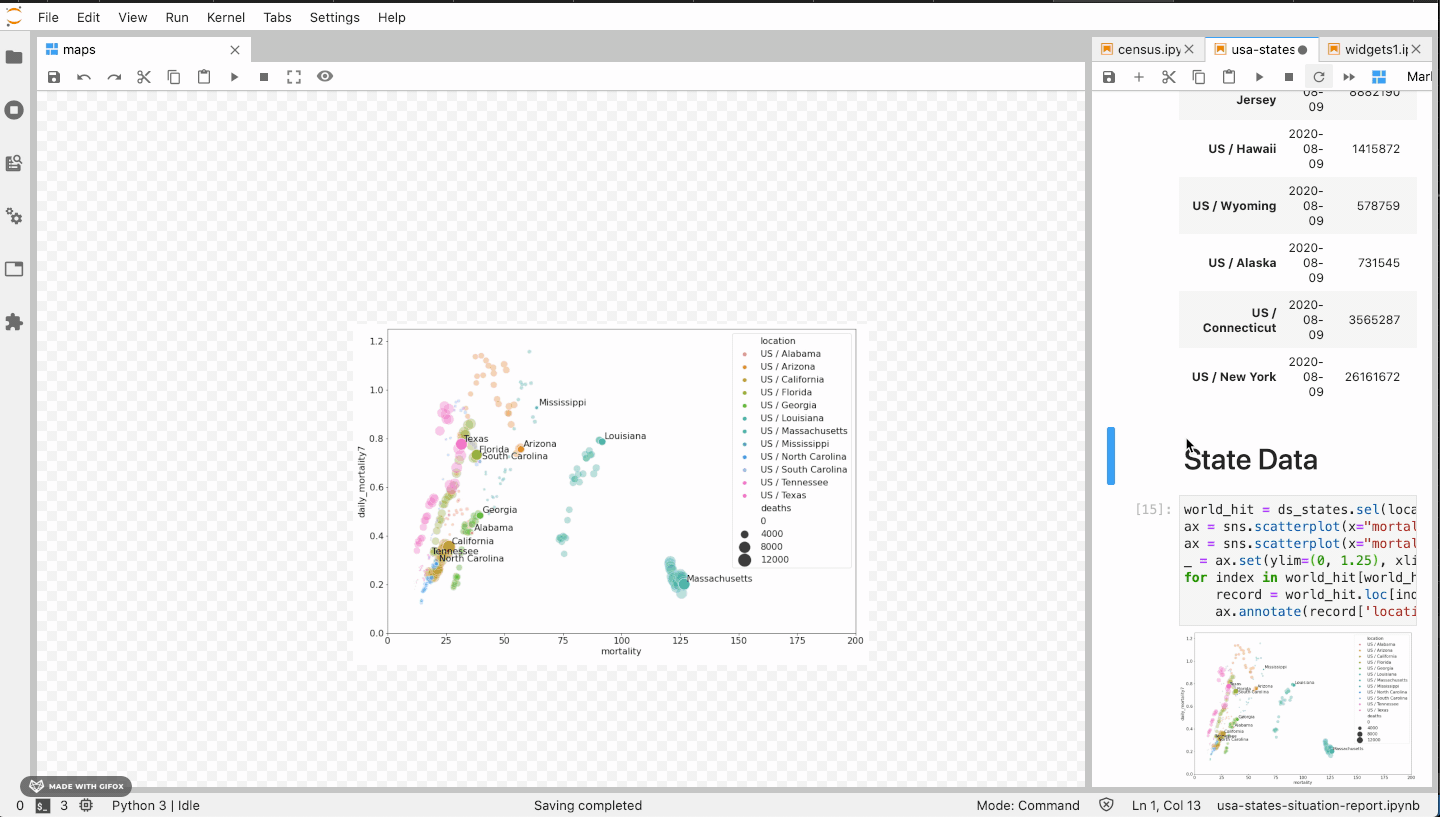
Add outputs from multiple notebooks.

add-multiple

See changes immediately.

see-changes

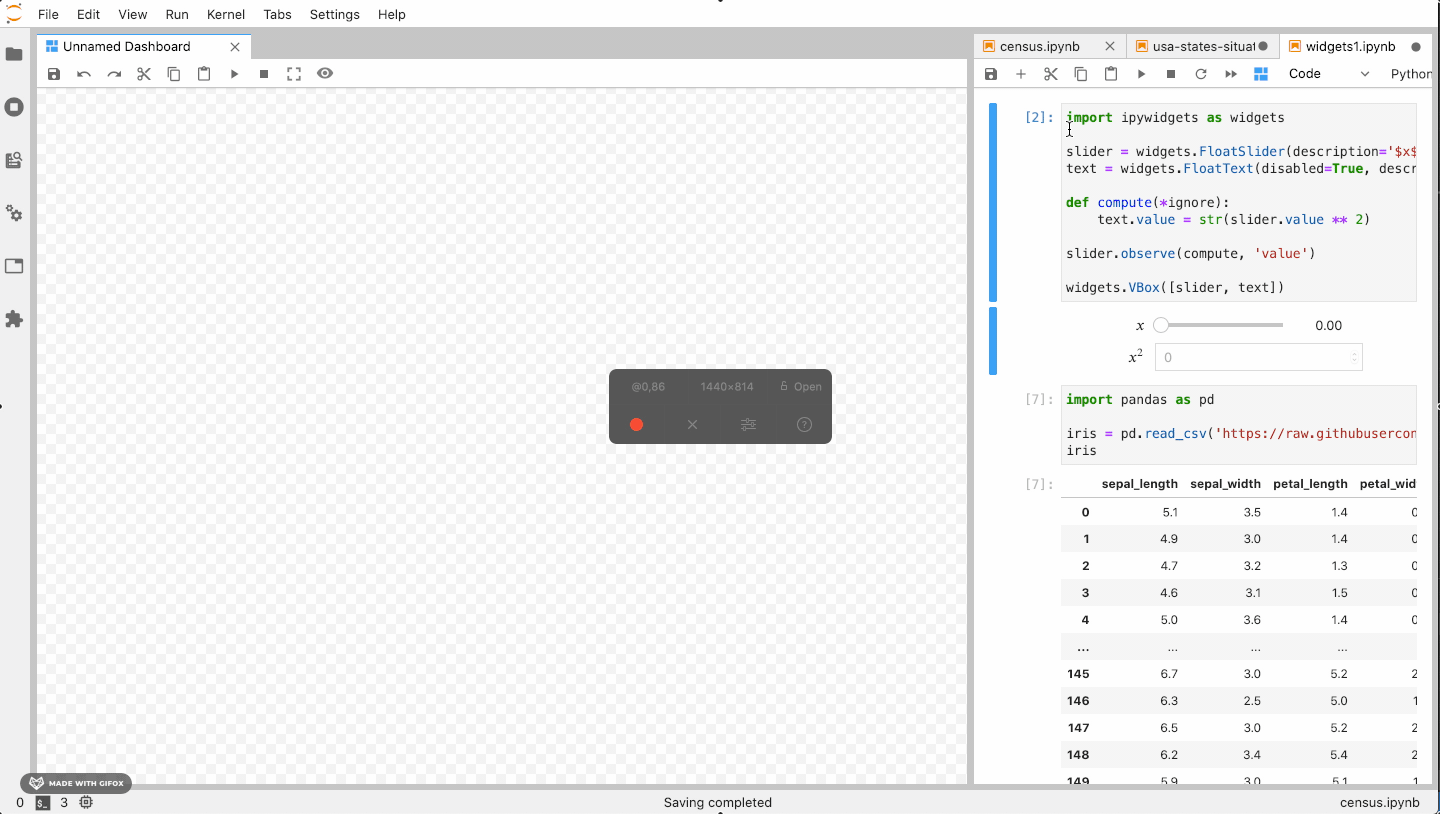
Preview your dashboard and interact with widgets in present mode.

present-mode

Undo and redo.

undo-redo

Add markdown too.

markdown-too

Save dashboards to file,
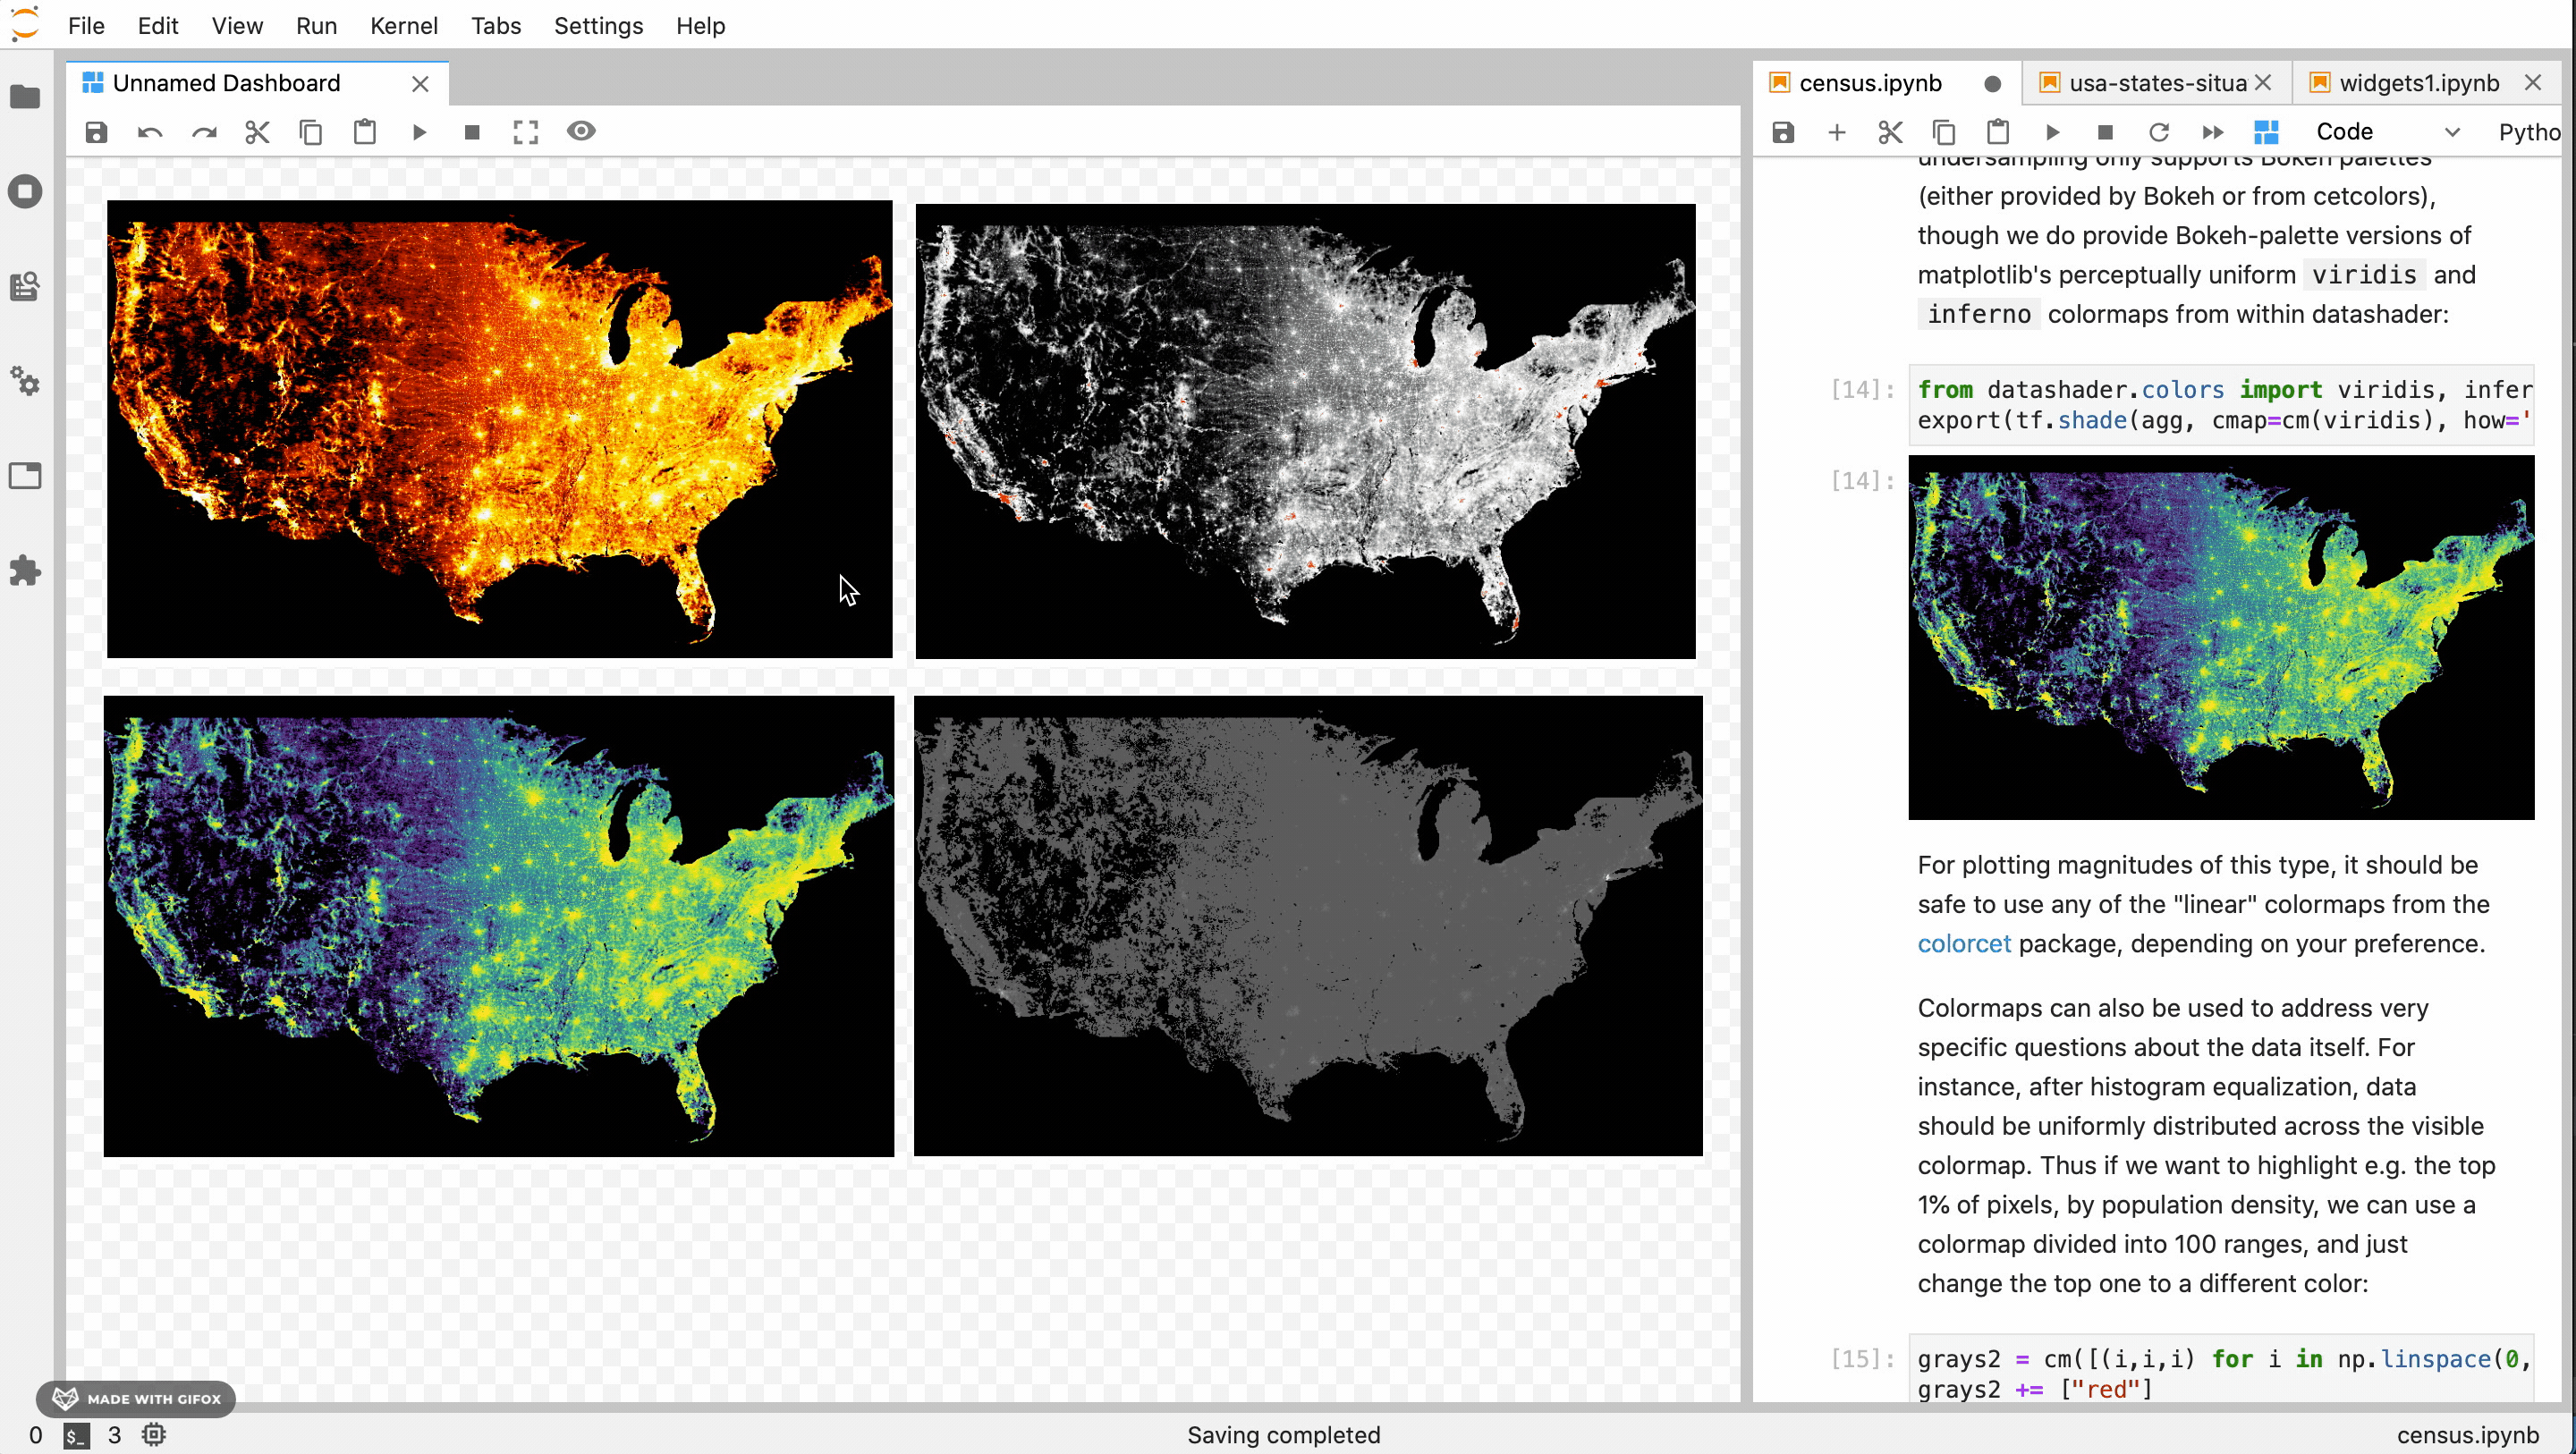
save-dashboard

Load them up,

load-dashboard

And edit them again!

edit-again

Requirements

  • JupyterLab >= 2.0

Install

For JupyterLab 3+:

pip install jupyterlab-interactive-dashboard-editor

For JupyterLab 2.x:

jupyter labextension install jupyterlab-interactive-dashboard-editor
jupyter lab build

Note: You will need NodeJS to install the extension for JupterLab 2.x.

Contributing

Development install

Note: You will need NodeJS to build the extension package.

The jlpm command is JupyterLab's pinned version of yarn that is installed with JupyterLab. You may use yarn or npm in lieu of jlpm below.

# Clone the repo to your local environment
# Change directory to the jupyterlab-interactive-dashboard-editor directory
# Install package in development mode
pip install -e .
# Link your development version of the extension with JupyterLab
jupyter labextension develop . --overwrite
# Rebuild extension Typescript source after making changes
jlpm run build

You can watch the source directory and run JupyterLab at the same time in different terminals to watch for changes in the extension's source and automatically rebuild the extension.

# Watch the source directory in one terminal, automatically rebuilding when needed
jlpm run watch
# Run JupyterLab in another terminal
jupyter lab

With the watch command running, every saved change will immediately be built locally and available in your running JupyterLab. Refresh JupyterLab to load the change in your browser (you may need to wait several seconds for the extension to be rebuilt).

By default, the jlpm run build command generates the source maps for this extension to make it easier to debug using the browser dev tools. To also generate source maps for the JupyterLab core extensions, you can run the following command:

jupyter lab build --minimize=False

Uninstall

For JupyterLab 3+:

pip uninstall -interactive-dashboard-editor

For JupyterLab 2.x:

jupyter labextension uninstall jupyterlab-interactive-dashboard-editor

jupyterlab-interactive-dashboard-editor's People

Contributors

cameron-toy avatar dependabot[bot] avatar hbcarlos avatar jess-x avatar jtpio avatar juliahuynh avatar krassowski avatar manics avatar

Stargazers

 avatar  avatar  avatar  avatar  avatar  avatar  avatar  avatar  avatar  avatar  avatar  avatar  avatar  avatar  avatar  avatar  avatar  avatar  avatar  avatar  avatar  avatar  avatar  avatar  avatar  avatar  avatar  avatar  avatar  avatar  avatar  avatar  avatar  avatar  avatar  avatar  avatar  avatar  avatar  avatar  avatar  avatar  avatar  avatar  avatar  avatar  avatar  avatar  avatar  avatar  avatar  avatar  avatar  avatar  avatar  avatar  avatar  avatar  avatar  avatar  avatar  avatar  avatar  avatar  avatar  avatar  avatar  avatar  avatar  avatar  avatar  avatar  avatar  avatar  avatar  avatar  avatar  avatar  avatar  avatar  avatar  avatar  avatar  avatar  avatar  avatar  avatar  avatar  avatar  avatar  avatar  avatar  avatar  avatar  avatar  avatar  avatar  avatar  avatar  avatar

Watchers

 avatar  avatar  avatar  avatar  avatar  avatar  avatar  avatar  avatar

jupyterlab-interactive-dashboard-editor's Issues

Use resize handles instead of current single drag icon

Problem

Current drag icon in the corner is hard to see and limits resizing to only one corner.
Screen Shot 2021-01-26 at 5 05 47 PM

Solution

Use resize handles on all corners.

  • 2px outline (fill: --jp-brand-color1)
  • 8px square handles
  • handle hover state fill: --jp-brand-color1
  • aspect ratio is constrained on default

resizeHandles

[BUG] Running markdown output in dashboard breaks output

Describe the bug

Running a markdown output already in a dashboard breaks that output, causing it to be blank.

To Reproduce

Create a dashboard, drag a markdown cell on to it, then re-run the cell.

Expected behavior

The output updates to reflect the output in the notebook.

Context

  • OS: macOS 10.15.5
  • Browser: Safari 13.1.1
  • JupyterLab Version: 2.1.4

Add documentation

Add "auto documentation" from docstrings, as well as a dedicated docs page to explain the software architecture, API, etc.

Re-link missing notebooks

Currently, loading a dashboard when a required notebook is missing causes the outputs from the missing notebook to be red, and attempting to load a cell that doesn't exist from a valid notebook causes the output to be yellow. This isn't very useful except to show that something is wrong, and doesn't offer any solutions.

A more useful solution would be to store the Base64 encoding of the output when the dashboard is saved (similar to how notebooks save the last output of each cell) so that the user can see a preview of the missing outputs. Also, dragging a notebook from the JupyterLab file browser on to a missing widget could re-link the notebook to the dashboard, updating its path.

Mock up:
Screen Shot 2020-09-21 at 4 11 26 PM

Icon for dashboard

Dashboards are currently displayed with the same icon as notebooks. I think it'd be good to have a unique icon to differentiate them.

I believe JupyterLab uses .svg files for icons.

Output as drag image

Is your feature request related to a problem? Please describe.

  • When dragging code cells and markdown cells from the notebooks to dashboards, the drag image is default to the code not the outputs of the cells

Describe the solution you'd like

  • Make drag image as the outputs image as the drag enter the dashboard area.

Make code more "Jupyter-like"

Follow recommended design and CSS patterns, add singleton interfaces, follow standard Jupyter documentation style. Make names more human-readable. Basically, make the code feel more familiar to Jupyter developers so it's easier to work on.

Installation Error

When I try to install, I'm getting bellow error

ERROR: Could not find a version that satisfies the requirement jupyterlab_interactive_dashboard_editor (from versions: none)
ERROR: No matching distribution found for jupyterlab_interactive_dashboard_editor

Below is my lab specs:
jupyter core : 4.7.1
jupyter-notebook : 6.2.0
qtconsole : not installed
ipython : 7.21.0
ipykernel : 5.5.0
jupyter client : 6.1.12
jupyter lab : 3.0.11
nbconvert : 6.0.7
ipywidgets : 7.6.3
nbformat : 5.1.2
traitlets : 5.0.5

and the pip version is 20.0.2

Please take a look this issue.

Pip install not working on windows

Describe the bug

A clear and concise description of what the bug is.
Unable to install the package

To Reproduce

Steps to reproduce the behavior:

pip install jupyterlab_interactive_dashboard_editor
ERROR: Could not find a version that satisfies the requirement jupyterlab_interactive_dashboard_editor (from versions: none)
ERROR: No matching distribution found for jupyterlab_interactive_dashboard_editor

Expected behavior

A clear and concise description of what you expected to happen.
Should get installed on windows with jupyter

Screenshots/gifs

If applicable, add screenshots/gifs to help explain your problem.

Context

  • OS: [e.g. macOS 10.15.5]: Windows 10
  • Browser [e.g. Safari 13.1.1]
  • JupyterLab Version [e.g. 2.1.4]: 2.2.6

Addition info

See widgets without having the notebook open

Description

As it is right now, we need to have the original notebook open to see the widgets. This is related to not having a kernel session open.

Solution

The solution adopted on Voila-gridstack consists of registering the dashboard widget in the document manager as if it were a new DocumentWidget for a notebook. This allows keeping track of the notebook state by using as a DocumentModel the NotebookModel which is the class that implements the state of a Notebook in JupyterLab.

This solution makes complicate to work with outputs from two notebooks in the same dashboard. Besides, when cloning an output from the notebook to the dashboard if this output has a widget, it's necessary to register this widget into the widget manager and treat it as a new widget.

Multi-select widgets

Shift/ctrl click or drag to select multiple widgets. Allows multiple widgets to be moved, deleted, or copied at once.

[BUG] Formatted text doesn't display properly in ipywidgets

Describe the bug

Formatted text (text contained in $) displays unformatted in ipywidgets on dashboards.

To Reproduce

Create a widget in JupyterLab using ipywidgets and the following code:

import ipywidgets as widgets

slider = widgets.FloatSlider(description='$x$', value=4)
text = widgets.FloatText(disabled=True, description='$x^2$')

def compute(*ignore):
    text.value = str(slider.value ** 2)

slider.observe(compute, 'value')

widgets.VBox([slider, text])

Then, add the widget to a dashboard.

Expected behavior

The displayed widget appears exactly as it does in the notebook.

Screenshots/gifs

Widget in notebook

Screen Shot 2020-10-01 at 5 27 07 PM

Widget in dashboard

Screen Shot 2020-10-01 at 5 26 45 PM

Context

  • OS: macOS 10.15.5
  • Browser: Safari 13.1.1
  • JupyterLab Version: 2.1.4

Explore one-to-many relationship with Voila template

Is your feature request related to a problem? Please describe.

From my understanding, Voila template has one-to-one relationship to notebook. Interactive-dashboard now has the ability to drag and drop outputs and markdown from multiple notebooks.

Describe the solution you'd like

Explore a one-to-many relationship with voila template

Additional context

The .dashboard file format now stores the widget info from multiple notebooks, and we are also planning to work on the relinking of missing notebook when opening a .dashboard file inside jupyterlab

Drag from notebook outputs

Is your feature request related to a problem? Please describe.

From user testing, the most intuitive way to interactive with outputs on notebooks is to drag directly the output cells to the dashboards.

Describe the solution you'd like

Make outputs cells draggable from the cell prompts

Improve overlap handling.

The Problem

Overlap handling isn't very good, and outright fails in certain cases.

Background

Currently, dashboards have rudimentary overlap detection and resolution for outputs. Placing one output on others will cause the other outputs to move up/down relative to the placed widget so they're no longer overlapping.

overlap

If placing a widget would cause the other widgets to move beyond the edge of the dashboard, the dashboard will be expanded to accommodate them. This is currently broken for the top edge, and causes a gap between the placed widget and the overlapping widgets.

top_edge

Another annoying issue arises when one wants to align two outputs horizontally in free mode. Here, a small overlap can cause a chain reaction of moves that can really mess up a layout.

Finally, the current algorithm compares the area covered by a widget to the area covered by every other widget every time a widget moves to find overlaps. This inefficiency causes slowdowns with large layouts

The Solution

An improved overlap handling algorithm that is:

  1. Intuitive. It should be obvious where outputs will move if there's an overlap, or at least some visual indication.
  2. Unobtrusive. Overlapping outputs should move a minimal amount and for small overlaps it should be difficult to tell anything has happened at all.
  3. Fast. Overlap resolution should happen instantly.

Additional notes: I think some amount of snap-to-edge should replace small overlaps, and that resizing shouldn't occur at any point as part of overlap handling. Also, I'm open to solutions that involve horizontal movement.

Some alternate algorithms are described here: https://mikekling.com/comparing-algorithms-for-dispersing-overlapping-rectangles/

Maintain widget opacity when selecting/dragging on canvas

Is your feature request related to a problem? Please describe.

  • When selecting and dragging a widget around on the canvas, the widget's opacity reduces.

Layer-1

Describe the solution you'd like

  • Maintaining the 100% opacity of widgets that are dragged around canvas will give the interface a more natural feel
  • Adding drop shadow (--jp-elevation-z1) will signify a higher elevation which ultimately signals to the user that the widgets are being "picked up"

Describe alternatives you've considered

See Material Design's standard for moving cards around: https://material.io/components/cards#behavior
material-design-moving-cards

Onboarding gifs/messages

Add some quick one-time onboarding gifs/messages to explain how to use the extension.

Examples:

  • Opening a dashboard for the first time displays a gif on the dashboard showing how to drag an output from a notebook on to the dashboard until the user adds an output.
  • Adding a second output displays a gif illustrating options for navigating the dashboard.
  • Dragging an output already on the dashboard the first time displays a gif showing how to switch between free/tile/present modes.

Remove unused code

Remove defunct/redundant code in button.ts, toolbar.ts, and other files.

Build table-of-contents-style panel to house notebook output cells

Problem

  • Having notebooks alongside dashboard editor creates a spatial problem
  • On smaller screens, dashboards can become hard to navigate and edit since the majority of the canvas is out of view

Screen-Recording-2020-11-19-at-5 06

Proposal

  • A table of contents style (ToC) panel that imports output and markdown cells (potentially code cells) from notebooks
  • ToC panel will house output cards that can be dragged onto the dashboard canvas
  • Full notebooks will not need to be in view in order to add outputs
  • To use outputs from different notebooks, click the drop down at the top to browse available notebooks
  • This solution will solve the workspace issue by taking up less space on the screen

Screen-Recording-2020-11-19-at-4 09

Screen Shot 2020-11-20 at 10 22 32 AM

notebook browser lo-fi prototype:

Screen Shot 2020-11-20 at 10 30 22 AM

Drag and hover output cells over dashboard editor tab to open

Problem

When in a notebook-only workspace, the user may not understand how to rearrange the layout in a side-by-side view (dashboard right alongside notebook). They may not know how to add outputs to their dashboards easily before rearranging workspace.

Solution

  • When in notebook-only view, drag and hover output cells over the dashboard tab to bring dashboard tab in view. The user will then be able to drop their outputs onto the dashboard.

  • When in dashboard-only view, add "workspace rearrange" button to automatically bring notebook and dashboard side-by-side.

Alternative solution

Automating a side-by-side view upon launch of a new dashboard or notebook.

Additional context

ezgif com-video-to-gif-2

Output not visible unless cell is re-run

2020-06-30 13 35 26

Recreating issue

Add an output to a dashboard, close the dashboard, then re-add the same output to a new dashboard. The output won't be visible until the cell is re-run.

Intended behavior

The output view on the dashboard is always identical to the output view in the notebook, even when newly added.

Additional information

This isn't an issue specific to dashboards. The same issue occurs with the "Create New View from Output" option in the code cell context menu.

Merge drag.ts changes into core

Merge changes from the modified drag.ts into core. The changes allow the drag image to be offset from the cursor.

Note: The existing drag.ts file in this repo shouldn't be merged just yet. The changes should be made more performative and the documentation needs to be updated.

[BUG] Undo doesn't work when switching from free to tile mode

Describe the bug

Switching from free to tile mode automatically moves/resizes outputs to fit the tile scale. These changes cannot be undone, even if the user switches back to free mode before undoing.

To Reproduce

Add an output to a dashboard in free mode. Switch to tile mode so the output resizes/moves to fit the tile scale. Switch back to free mode and attempt to undo.

Expected behavior

The outputs return to their original unaligned positions/sizes.

Screenshots/gifs

tilebug

Context

  • OS: macOS 10.15.5
  • Browser: Safari 13.1.1
  • JupyterLab Version: 2.1.4

installation issues on jupyter lab 3.2.8

Describe the bug

Can not move cell to dashboard so looked at installation. The dash menu looks different than the demo (copied below). The installed extension does not show jupyterlab-interactive-dashboard-editor but if you search for 'dash' in the extensions manager, this shows up as installed (image below) so some kind of bug in installation

image

image

Context

  • OS: Windows 11
  • Browser Edge
  • JupyterLab Version 3.2.8

Addition info

!pip freeze does not list this extension either even though it has been installed via pip

jupyter-client==7.1.1
jupyter-core==4.9.1
jupyter-server==1.13.3
jupyterlab==3.2.8
jupyterlab-pygments==0.1.2
jupyterlab-server==2.10.3
jupyterlab-widgets==1.0.2
kiwisolver==1.3.2
lckr-jupyterlab-variableinspector==3.0.9

Replace Dashboards Icon

Problem

Dashboards icon and Console icon are too similar in color. This can confuse the person who is using JupyterLab and cause a slip. The person wanting to create a dashboard may similar Console blue colored icon and click that instead of the Dashboard icon. The person may get frustrated with this slip.
Group 14
Group 15

Solution

I have iterated on multiple color combinations and styles. Without wanting to duplicate any colors on Jupyter's current design system, I used a teal color on the new icon and incorporated a slightly rounded corner radius to achieve an organic and soft look.

Original:

dashboard_icon_filled_v2

Redesign:

dashboard_icon_filled_teal

Mousing over dashboard tab shows information from last focused notebook

2020-06-30 12 01 16

Recreating issue

Create a dashboard from one or more notebooks and mouse over the dashboard's tab.

Intended behavior

Mousing over a dashboard tab displays information about the dashboard. Right-clicking the dashboard tab brings up a dashboard-tab-specific context menu.

Additional information

Parent class tags for the tab are lm-Widget p-Widget lm-TabBar p-TabBar lm-DockPanel-tabBar jp-Activity.

I tried finding where the mouse-over metadata was stored and how it's displayed but couldn't find it. Any information on that would be appreciated.

Improve navigation tools

Make the dashboard easier to navigate.

  • Pan by clicking and dragging on the dashboard.
  • Pan dashboard by dragging a widget near the edges.
  • Jump to edge of dashboard with shift and arrow keys.
  • Stretch goal of variable zoom

Dependencies for Binder instance

The binder currently doesn't allow viewing ipywidgets or running any of the cells in the demo. I think ipywidgets should be installed at a minimum, and probably enough data science libraries to run the census notebook.

Dashboard views aren't scrollable

2020-06-30 14 22 25

Dashboard view above, view from "Create New View for Output" below.

Recreating issue

Create a dashboard view that is too tall to fully display, then try scrolling.

Expected behavior

The dashboard scrolls like an output view.

Additional information

"Create New View for Output" views are scrollable. They create a ClonedOutputArea (extended from Panel) and put it in a MainAreaWidget. Dashboards are not scrollable, despite being extended from MainAreaWidget and DashboardWidgets being extended from Panel.

The difference might occur because Dashboard's content is a Panel that new DashboardWidgets are added to, instead of a single Panel widget that takes up the entire MainAreaWidget like in "Create New View for Output" view.

Interactive-dashboard + Voilà

Hi there!

This work is amazing, and I loved you demo at the meeting. Voilà co-author here. I would love to get in touch with you on integrating this as a Voilà template (like e.g. voilà-gridstack). Let me know if you would like to be in touch to discuss how we could collaborate on this!

Rendering LaTeX in .dash files.

JupyterLab markdown cells can render LaTeX when the user wraps text in $$ $$. No idea how complex it would be to integrate this into .dash files, but it would be pretty cool.

image

Support for JupyterLab 3.0

With JupyterLab 3.0 final now available, it would be nice to make the extension compatible with it.

Using the new distribution system would also make it easier to install with pip and conda.

Thanks!

Expose all current features

Certain features (like cropping a dashboard to the minimum size required to contain the outputs) are implemented but not accessible within JupyterLab. These features should be accessible and appropriately placed in the dashboard toolbar, JupyterLab toolbar, and context menus.

Placing widgets on other widgets doesn't work as expected.

Describe the bug

Placing a widget on another causes the placed widget to be placed oddly.

To Reproduce

Drag a dashboard output on top of another.

Expected behavior

The placed widget overlaps the underlying widget, moves the underlying widget to fit, or snaps to the outer edge of the underlying widget (still figuring out which is best).

Screenshots/gifs

2020-07-29 12 24 15

Context

  • OS: macOS 10.15.5
  • Browser: Safari 13.1.1
  • JupyterLab Version: 2.1.4

Addition info

The bug seems to be due to the offset position of the mouse event being from the underlying widget instead of the dashboard.

Canvas Redesign for better UX (WYSIWYG)

Is your feature request related to a problem? Please describe.

  • Current editing canvas is a high contrast checkered grid
  • Not representative of what the final dashboard outcome will look like.

Screen Shot 2020-10-23 at 10 13 48 AM

Describe the solution you'd like

  • Use a grid canvas with lower contrast to give the user a better preview of the final dashboard outcome

Canvas 1
Screen Shot 2020-10-23 at 10 13 25 AM

OR

Canvas 2
Screen Shot 2020-10-23 at 10 21 03 AM

Describe alternatives you've considered

  • Plain white canvas does not give clear indication that the user is in editing mode, therefore a grid would be helpful to show that editing mode is enabled

Gif on README

It would be great to have an animated GIF on the README to preview the developed features. As fallback, a text description on how to use would be an option.

I could build and try to discover, but the GIF/TXT would be more welcoming to me to take that step.

Consolidate utils files

Consolidate utils files (fsutils.ts, utils.ts, dbUtils.ts, widgetdragutils.ts) or move them into Private namespaces in the files that require them.

Toolbar redesign

Is your feature request related to a problem? Please describe.

Creating a better experience for creating dashboards by utilizing different toolbar "modes" depending on what the user selects.

Describe the solution you'd like

Interact mode

  • Remove all toolbar options, except for save. This will mitigate any confusion to users who will try to edit their dashboard while in Interact mode. Taking away the option to edit will signify that editing is not available in Interact mode.
  • Plain white canvas (Also, it would be a good idea to implement an option to change canvas colors while in edit mode) signifies a "preview" of what the dashboard will look like

Edit mode

  • Toolbar option will change depending on what the user clicks.
  • When clicking on an output: user can manually change dimensions by pixel, lock dimension/aspect ratio, and toggle floating for that specific output
  • When clicking on the canvas: user can save, redo, undo (nothing specific to a single output)
  • Editing grid-based canvas to signify editing (similar to Jupyter Notebook cell editor background color)

Additional context

Original

toolbar_og

Redesign (10/22/20)

toolbar_redesign

Editing is enabled while in present/interact mode

Describe the bug

When toggling "Present" mode, the outputs are still editable (cut, copy, and paste functions still work).

To Reproduce

Steps to reproduce the behavior:

Expected behavior

When in Present mode, none of the outputs should be moveable, removable, or resizable. The only thing that the user should be able to do is interact with the output.

Screenshots/gifs

ezgif com-video-to-gif

Context

  • OS: [e.g. macOS 10.15.5]
  • Browser [e.g. Safari 13.1.1]
  • JupyterLab Version [e.g. 2.1.4]

Recommend Projects

  • React photo React

    A declarative, efficient, and flexible JavaScript library for building user interfaces.

  • Vue.js photo Vue.js

    🖖 Vue.js is a progressive, incrementally-adoptable JavaScript framework for building UI on the web.

  • Typescript photo Typescript

    TypeScript is a superset of JavaScript that compiles to clean JavaScript output.

  • TensorFlow photo TensorFlow

    An Open Source Machine Learning Framework for Everyone

  • Django photo Django

    The Web framework for perfectionists with deadlines.

  • D3 photo D3

    Bring data to life with SVG, Canvas and HTML. 📊📈🎉

Recommend Topics

  • javascript

    JavaScript (JS) is a lightweight interpreted programming language with first-class functions.

  • web

    Some thing interesting about web. New door for the world.

  • server

    A server is a program made to process requests and deliver data to clients.

  • Machine learning

    Machine learning is a way of modeling and interpreting data that allows a piece of software to respond intelligently.

  • Game

    Some thing interesting about game, make everyone happy.

Recommend Org

  • Facebook photo Facebook

    We are working to build community through open source technology. NB: members must have two-factor auth.

  • Microsoft photo Microsoft

    Open source projects and samples from Microsoft.

  • Google photo Google

    Google ❤️ Open Source for everyone.

  • D3 photo D3

    Data-Driven Documents codes.