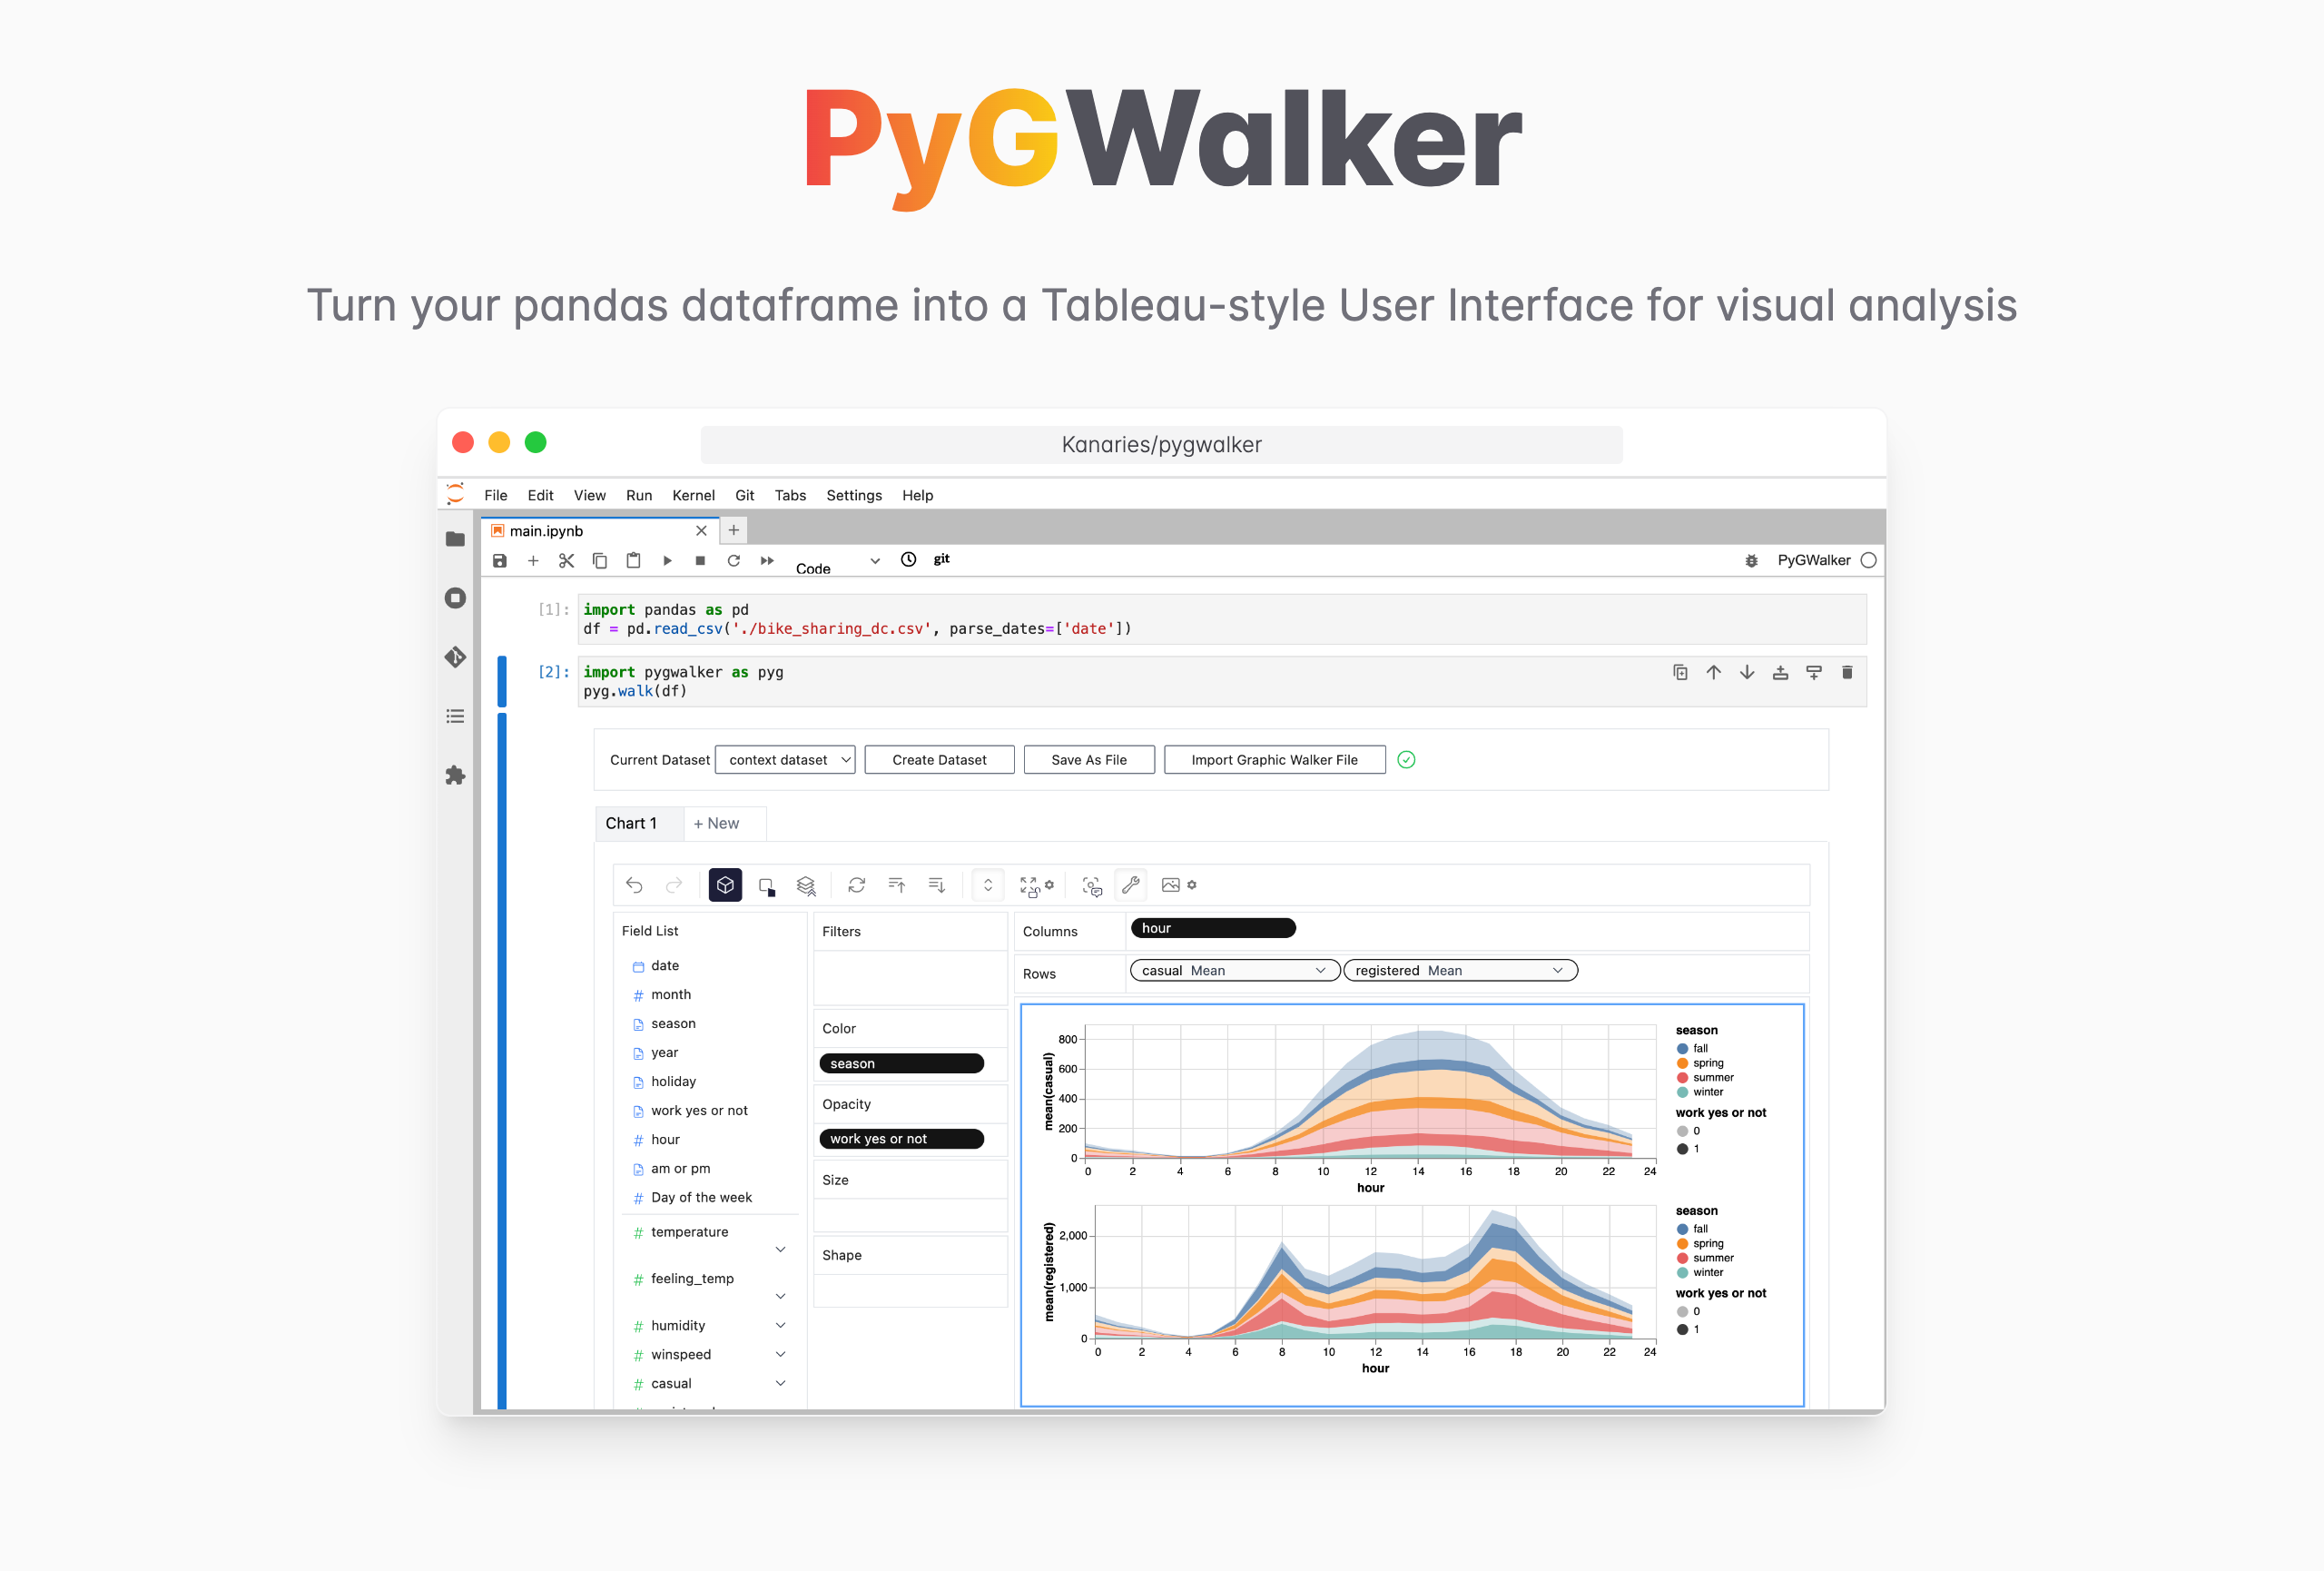

PyGWalker can simplify your Jupyter Notebook data analysis and data visualization workflow. By turning your pandas dataframe into a Tableau-style User Interface for visual exploration.
PyGWalker (pronounced like "Pig Walker", just for fun) is named as an abbreviation of "Python binding of Graphic Walker". It integrates Jupyter Notebook (or other jupyter-based notebooks) with Graphic Walker, a different type of open-source alternative to Tableau. It allows data scientists to analyze data and visualize patterns with simple drag-and-drop operations.
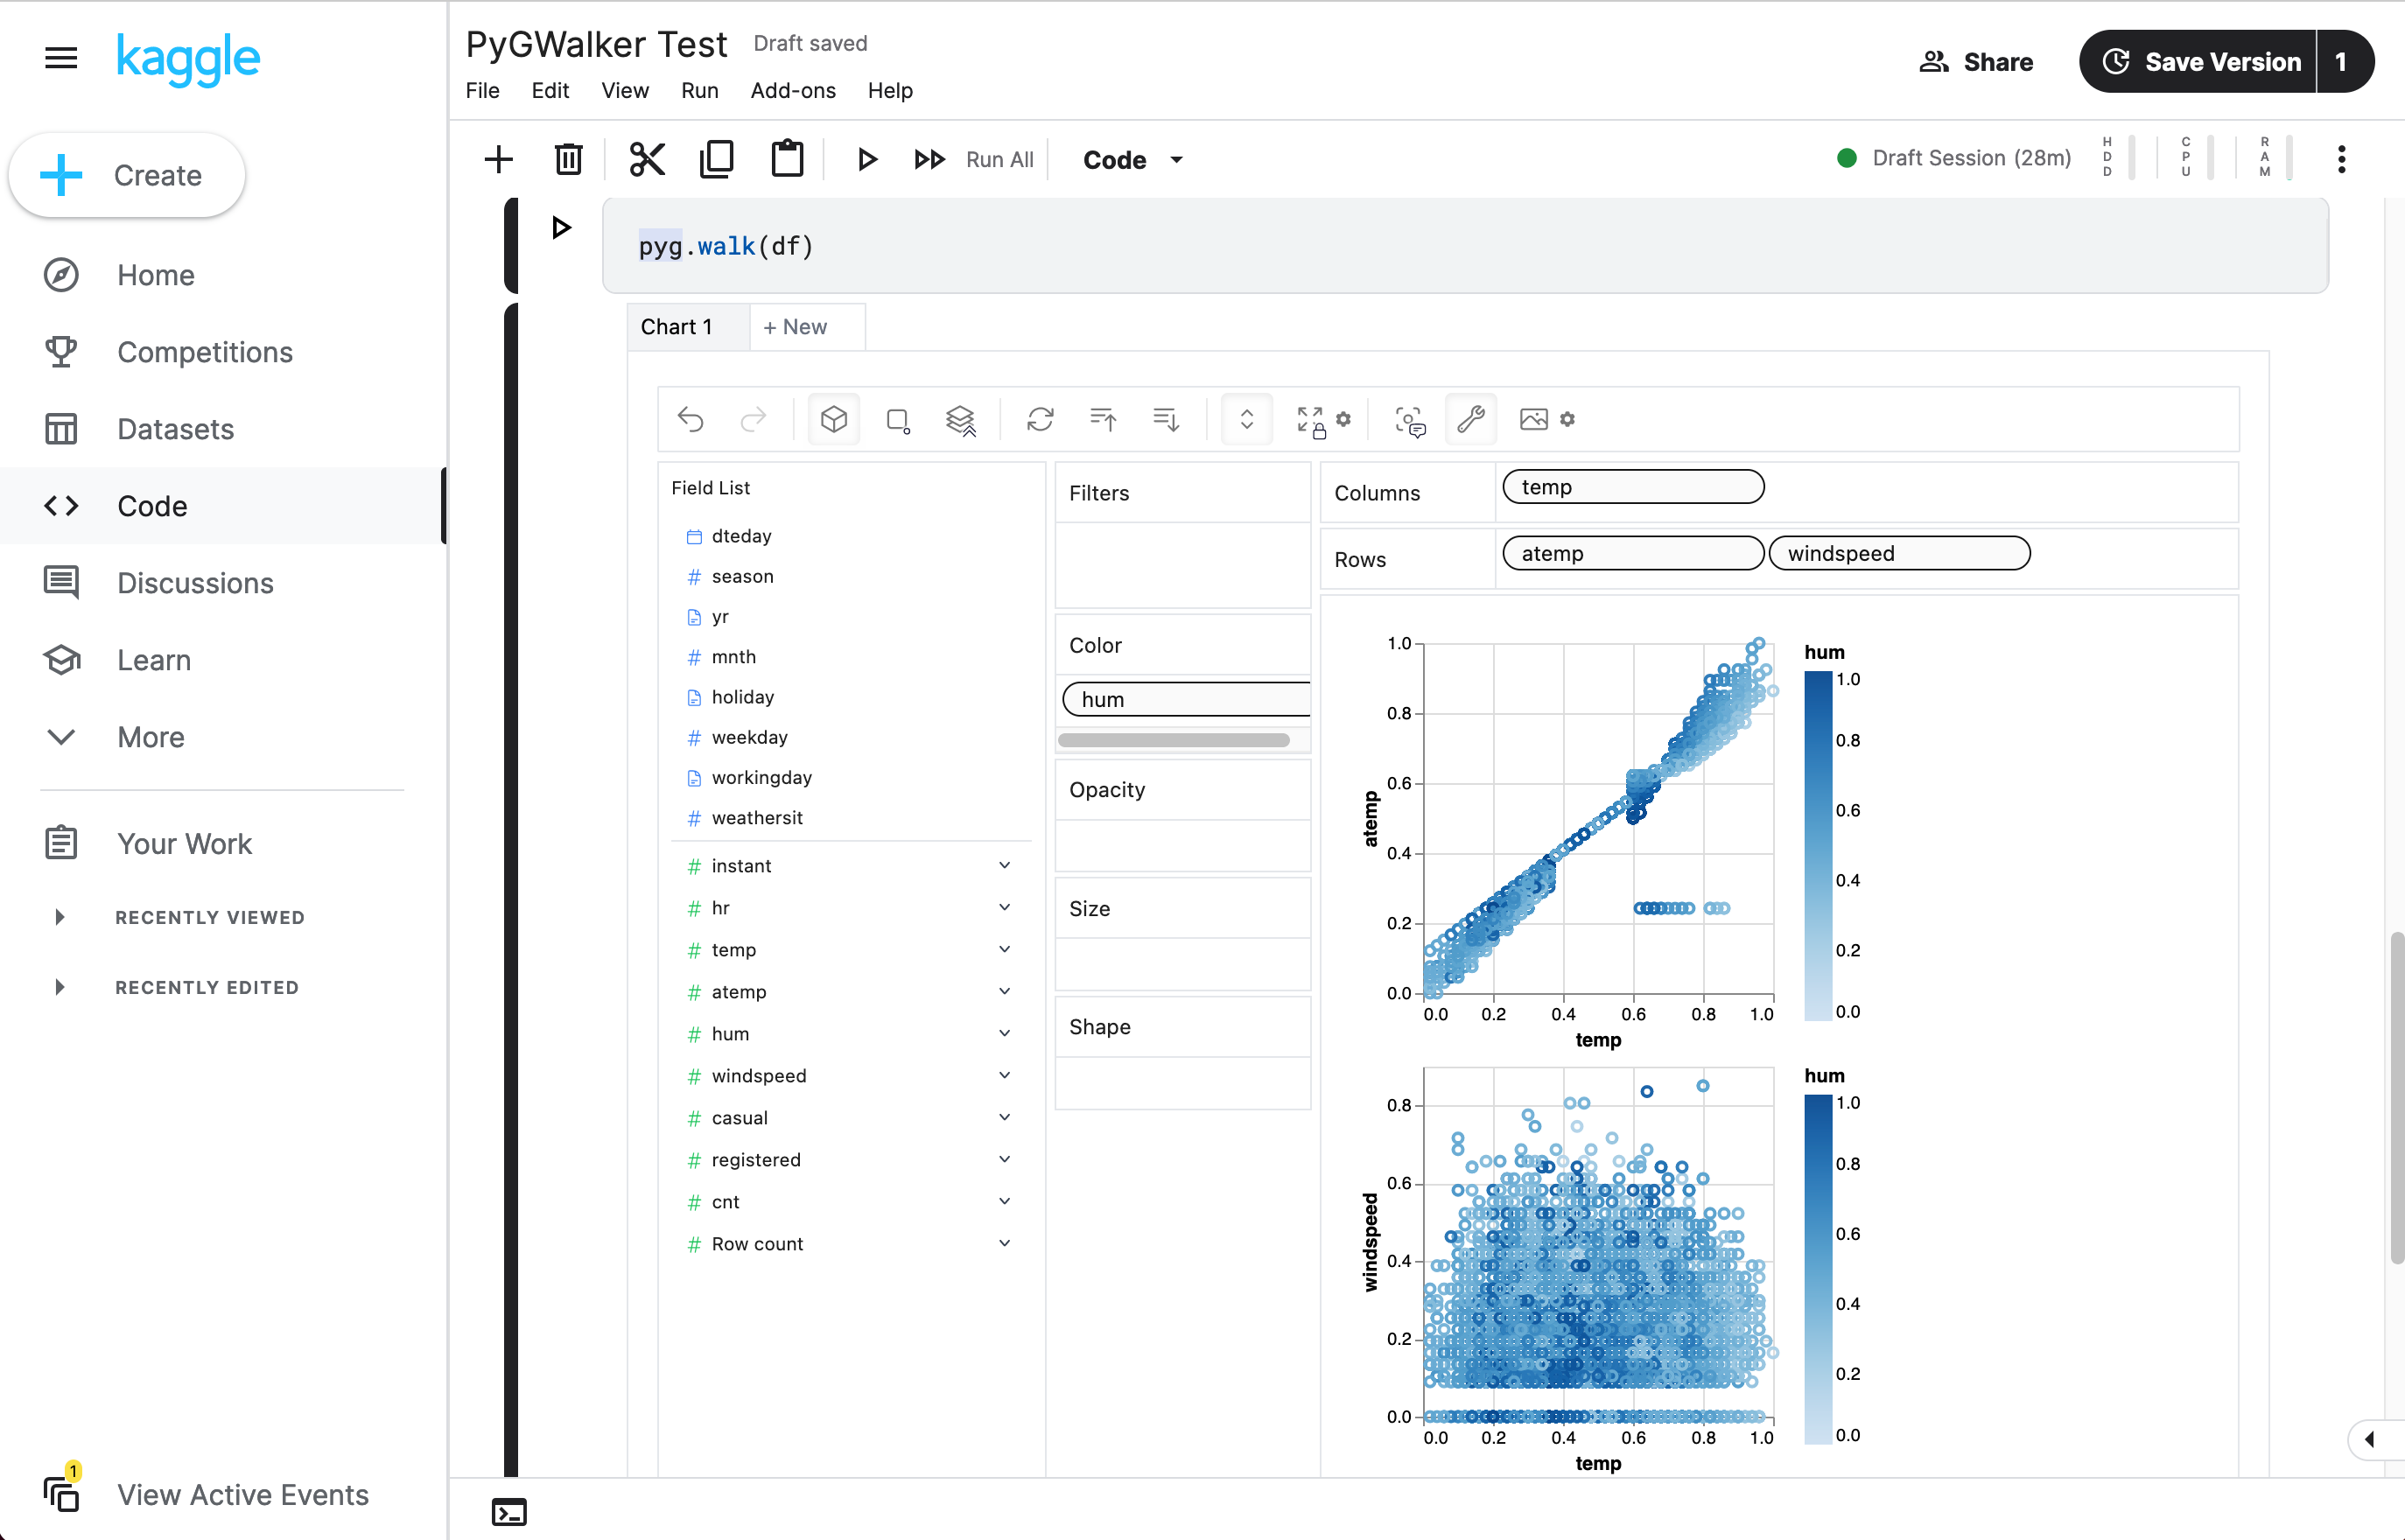
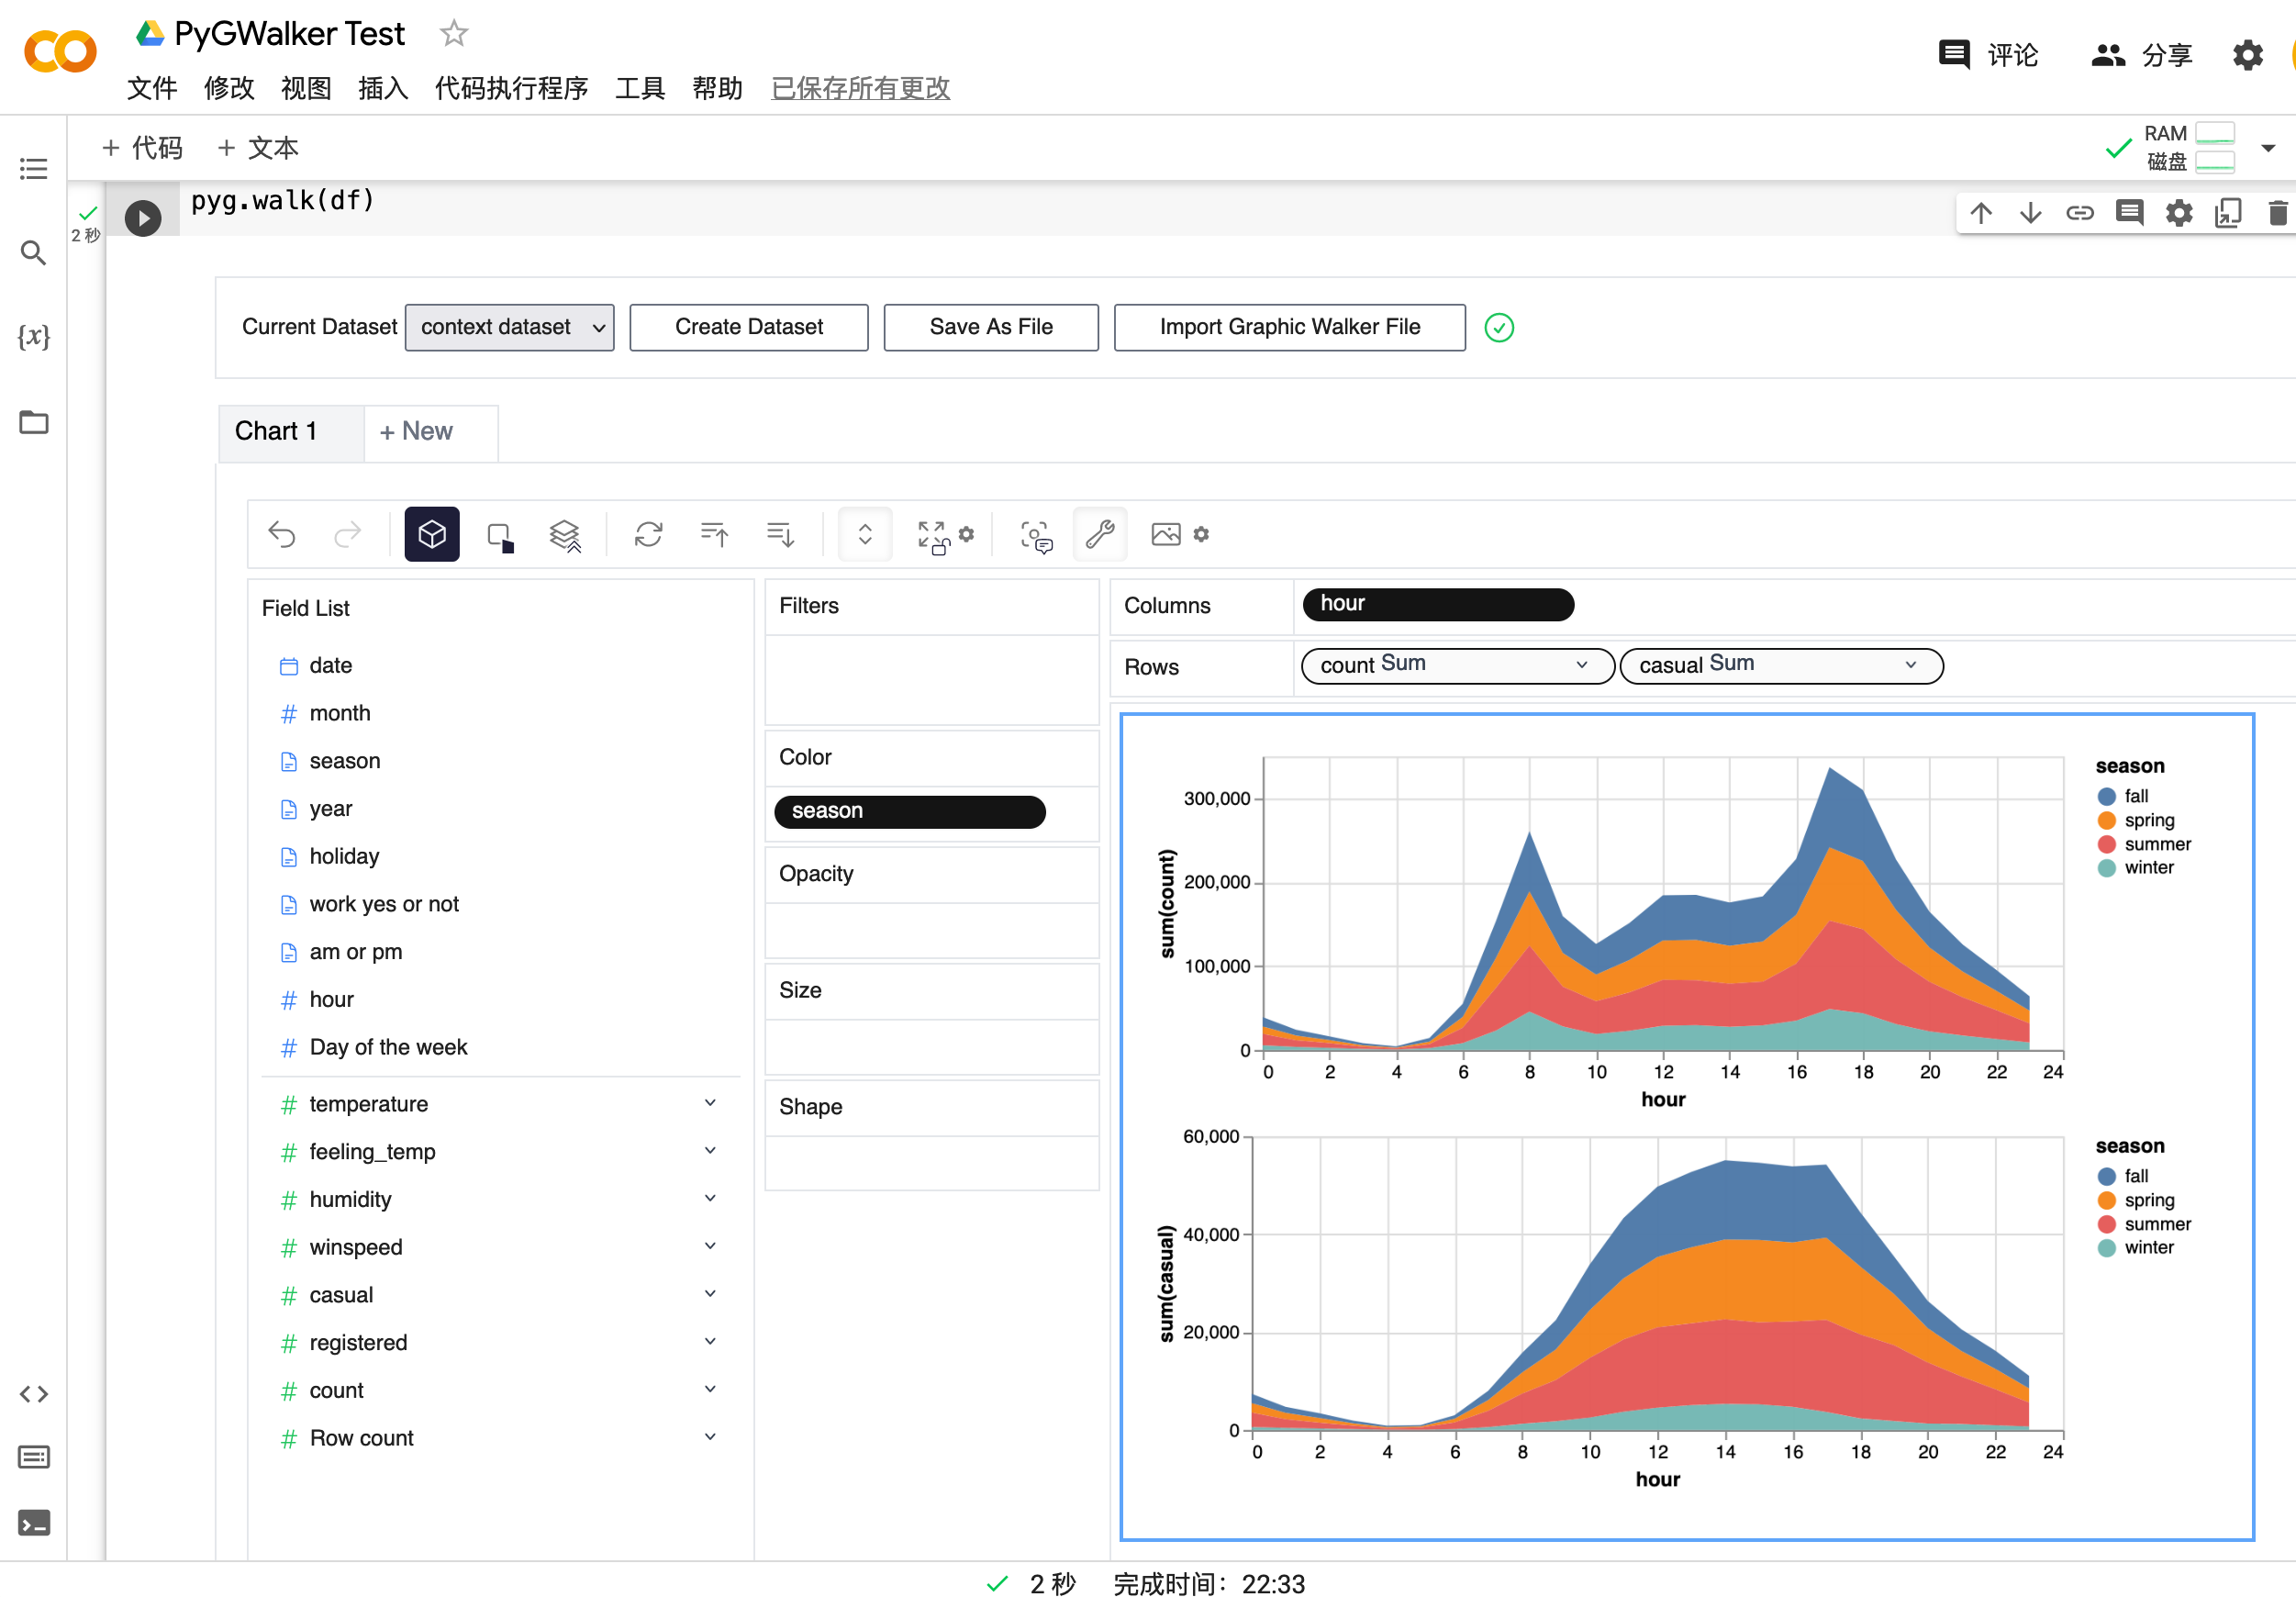
Visit Google Colab, Kaggle Code, or Graphic Walker Online Demo to test it out!
PyGWalker will add more support such as R in the future.
- Jupyter Notebook
- Google Colab
- Kaggle Code
- Jupyter Lab (WIP: There're still some tiny CSS issues)
- Databricks Notebook (Since version
0.1.4a0, needs more tests) - Jupyter Extension for Visual Studio Code (Since version
0.1.4a1, needs more tests) - ...feel free to raise an issue for more environments.
| Run in Kaggle | Run in Colab |
|---|---|
|
|
Before using pygwalker, make sure to install the packages through the command line using pip.
pip install pygwalkerImport pygwalker and pandas to your Jupyter Notebook to get started.
import pandas as pd
import pygwalker as pyg
You can use pygwalker without changing your existing workflow. For example, you can call up Graphic Walker with the dataframe loaded in this way:
df = pd.read_csv('./bike_sharing_dc.csv', parse_dates=['date'])
gwalker = pyg.walk(df)
You can even try it online, simply visiting , Google Colab or Kaggle Code.
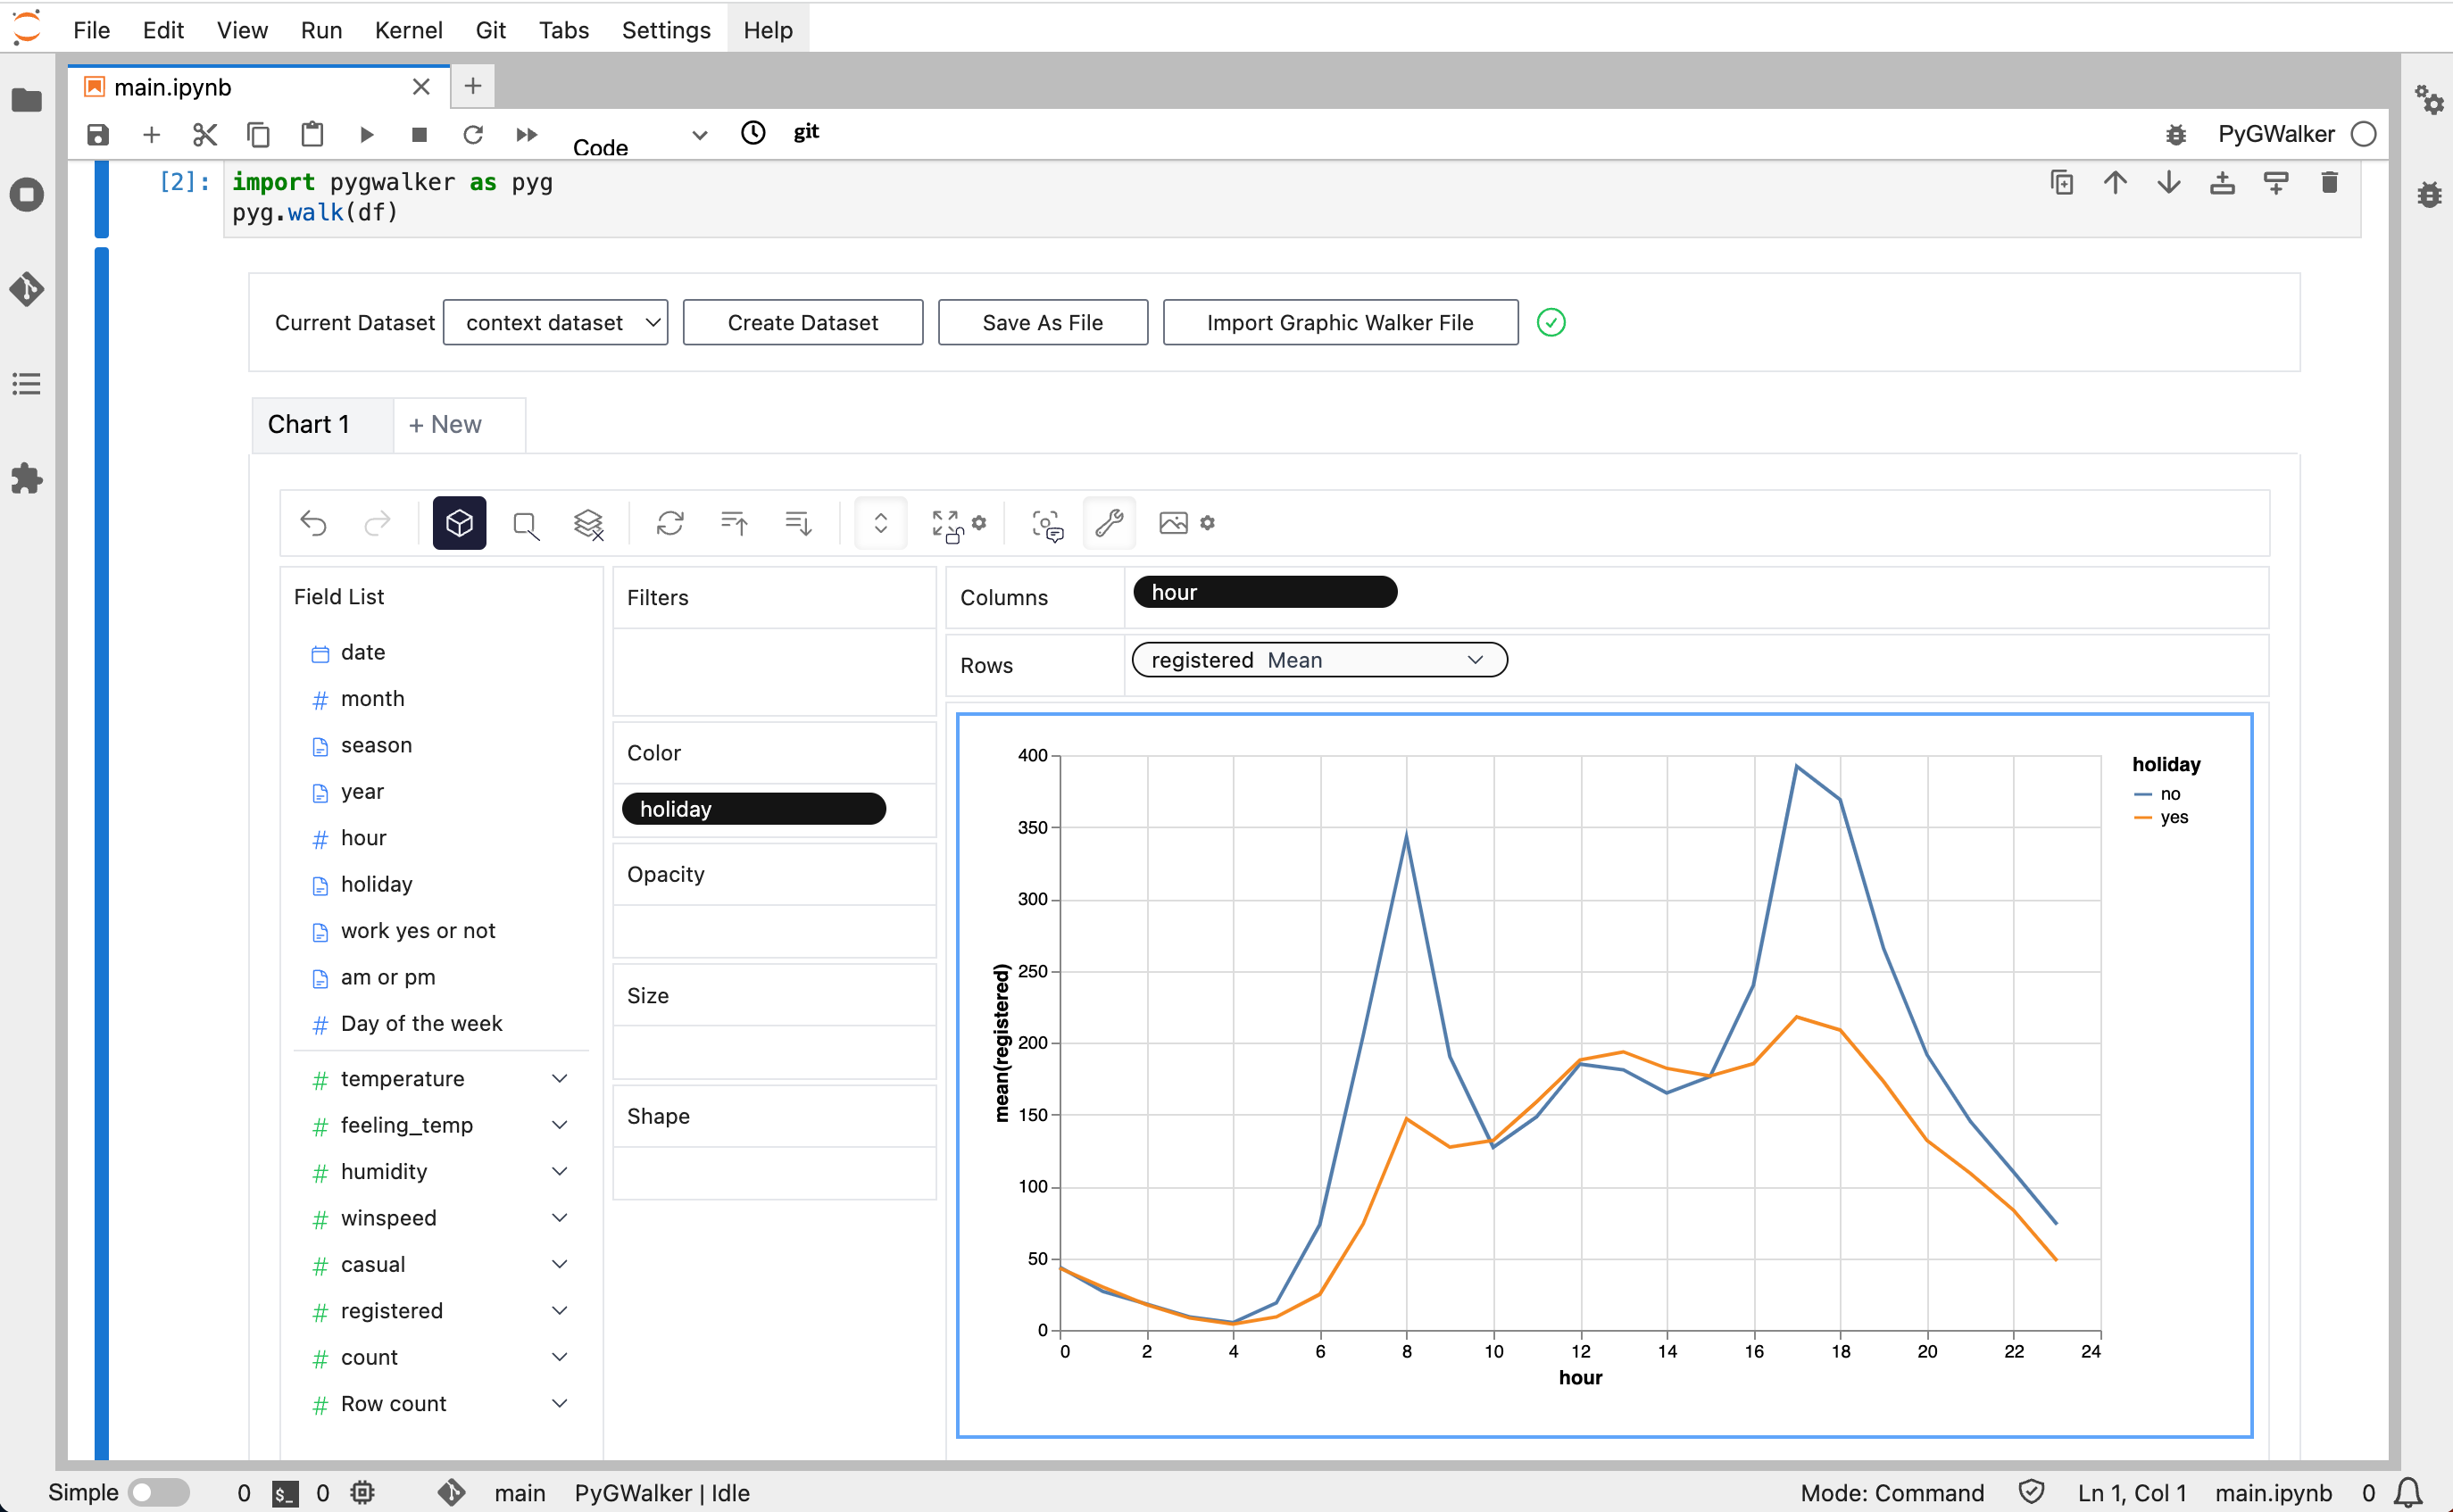
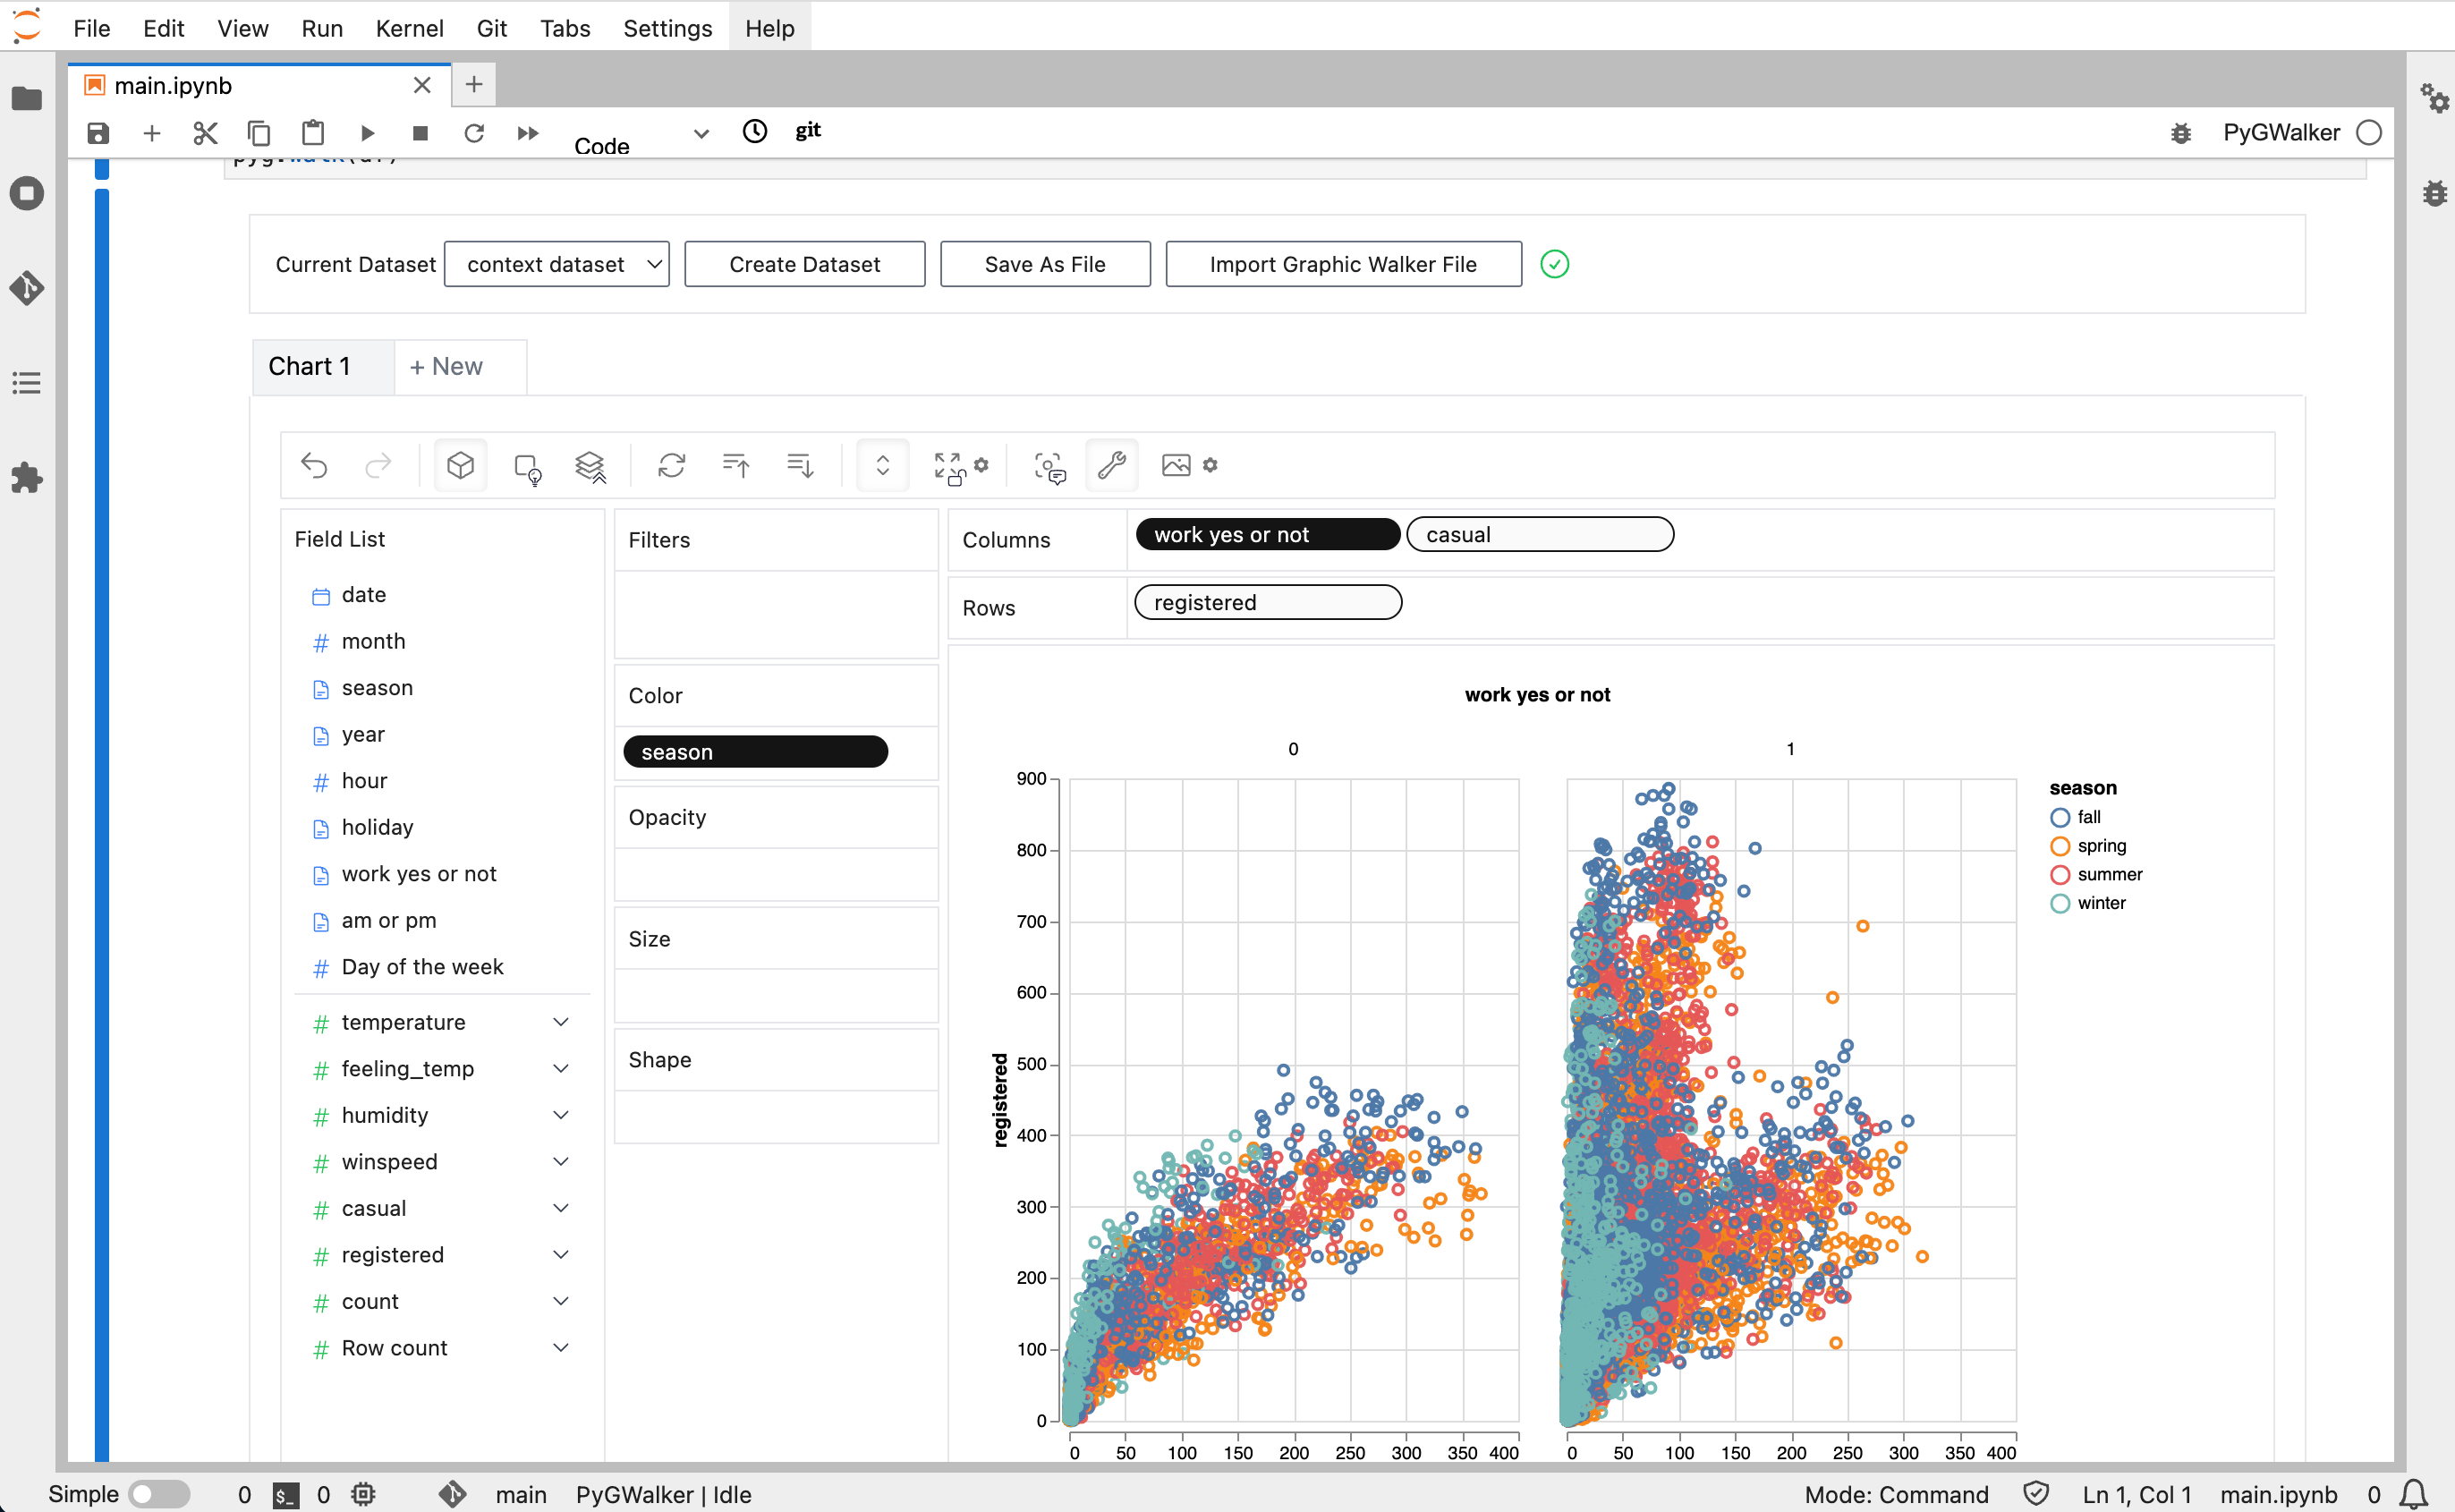
That's it. Now you have a Tableau-like user interface to analyze and visualize data by dragging and dropping variables.
Cool things you can do with Graphic Walker:
- You can change the mark type into others to make different charts, for example, a line chart:
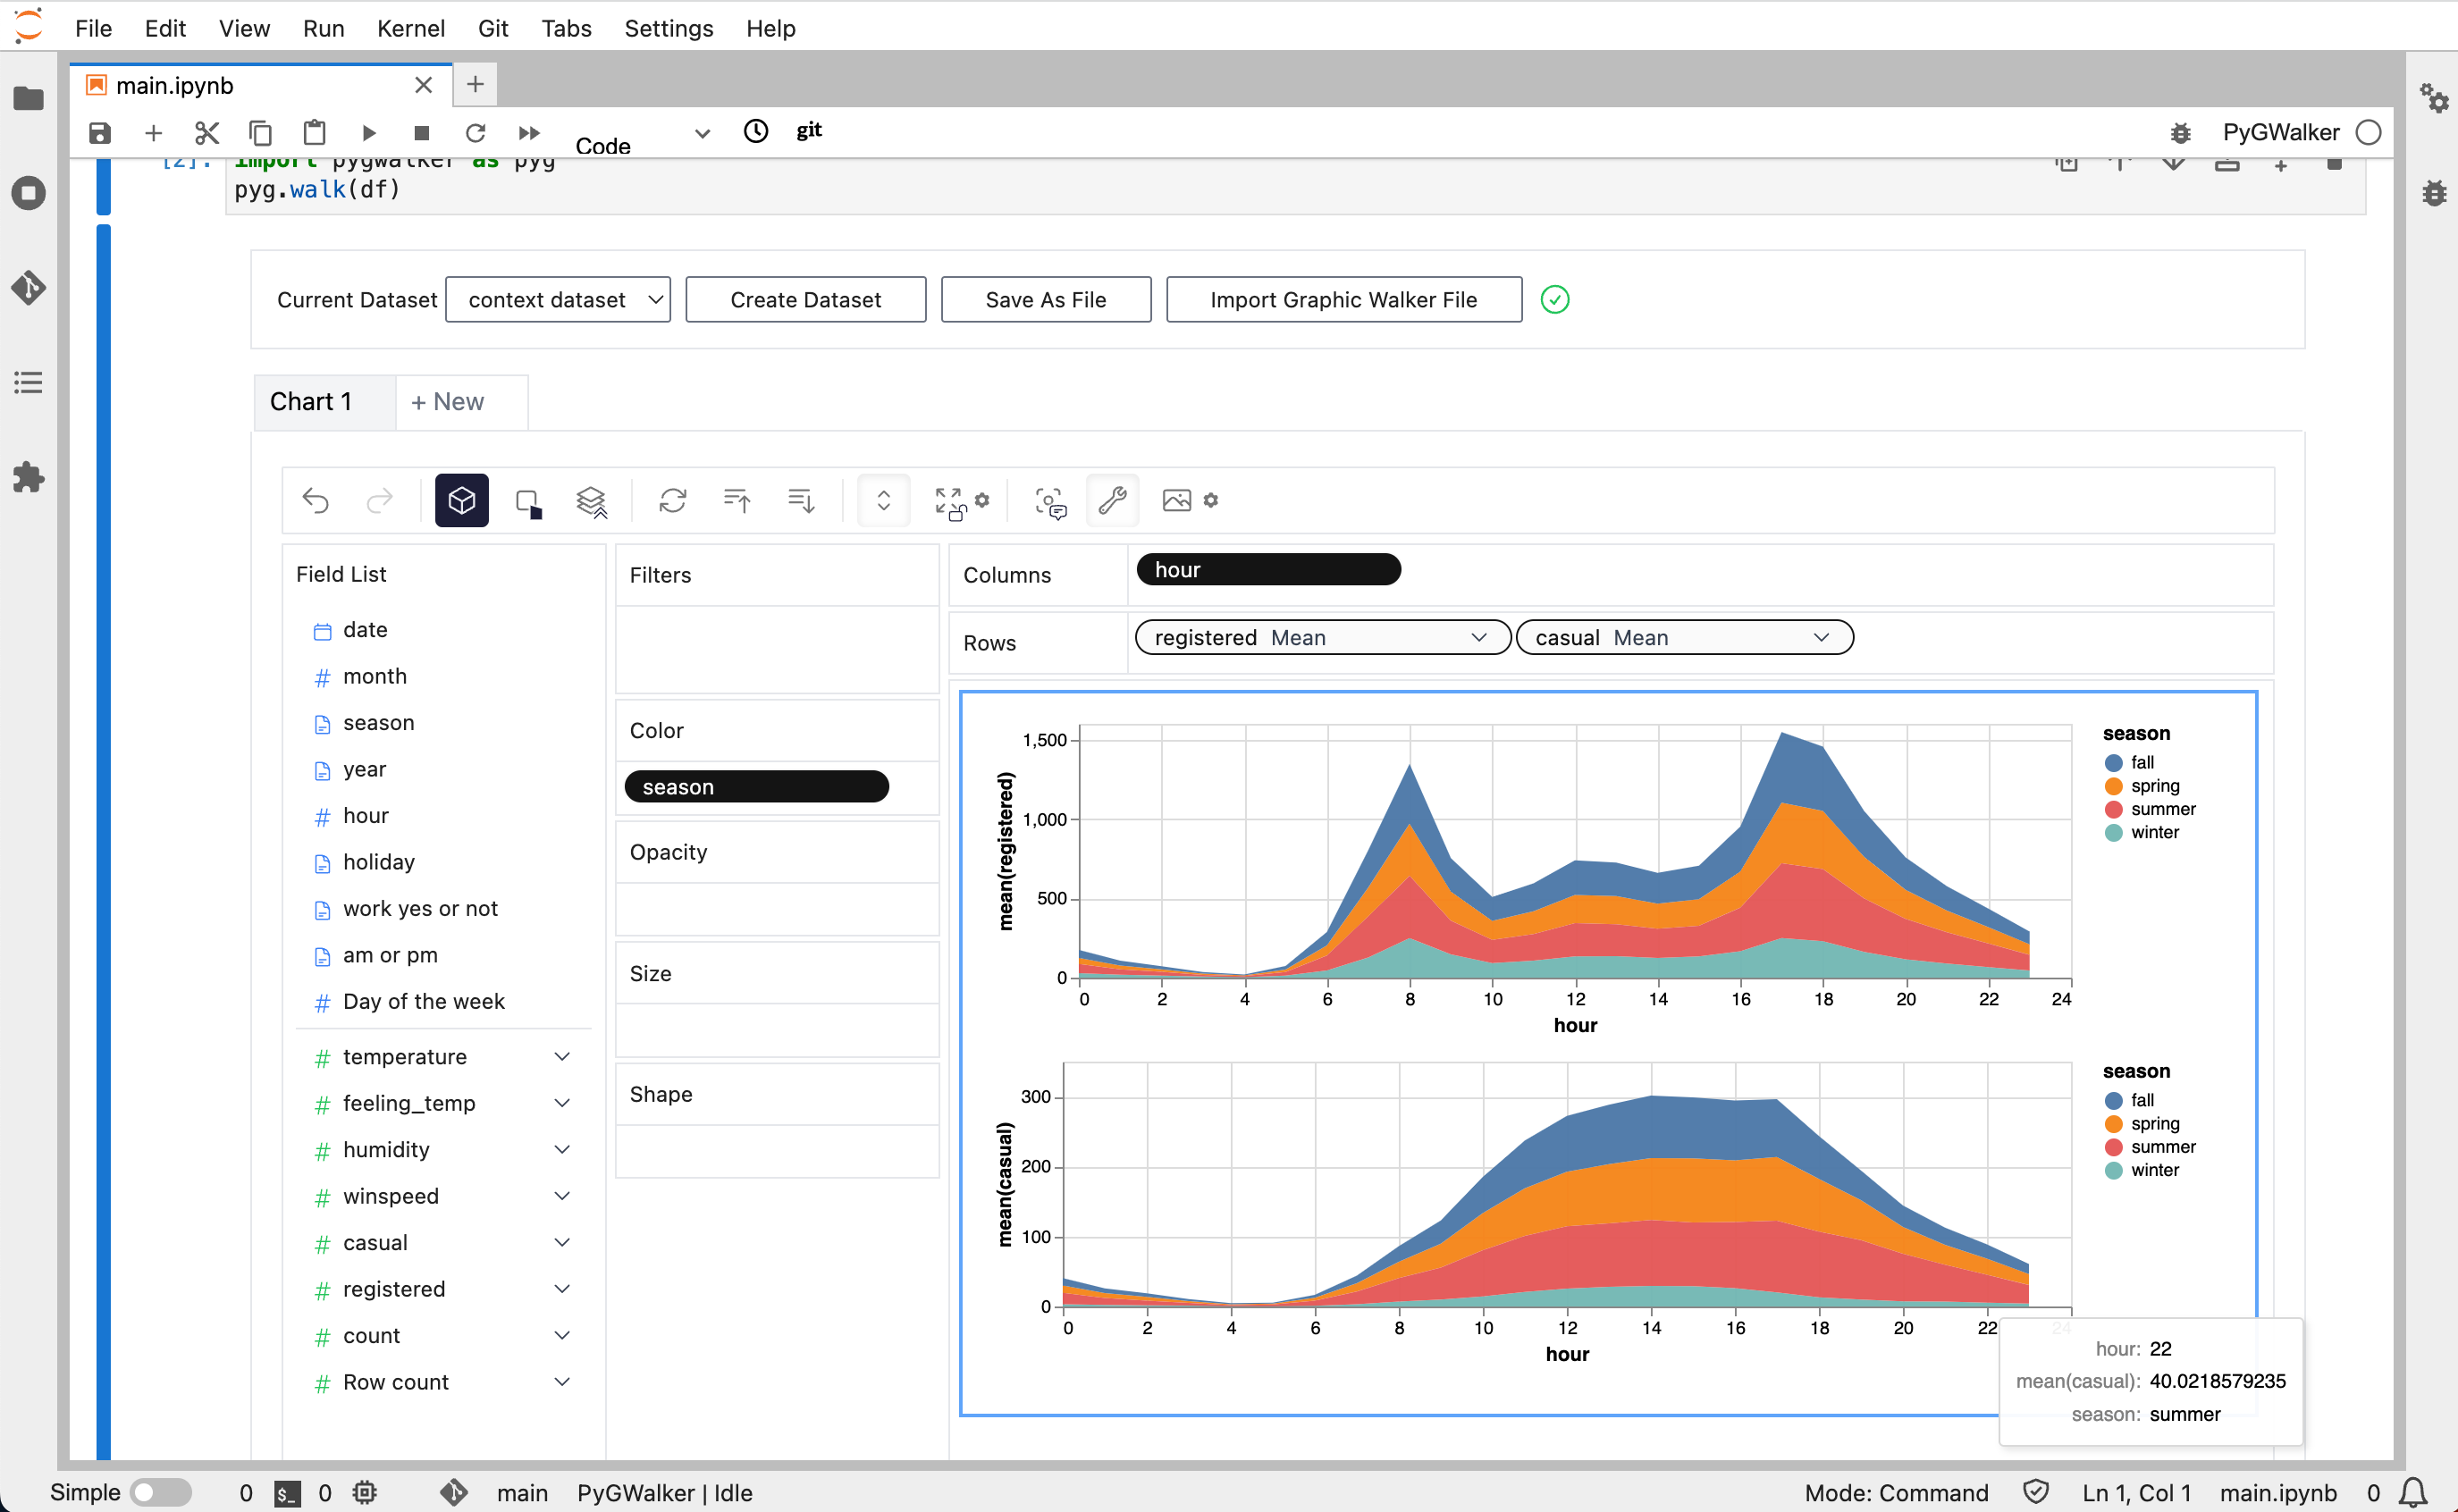
- To compare different measures, you can create a concat view by adding more than one measure into rows/columns.
- To make a facet view of several subviews divided by the value in dimension, put dimensions into rows or columns to make a facets view. The rules are similar to Tableau.
- You can save the data exploration result to a local file.
For more detailed instructions, visit the Graphic Walker GitHub page.
- Check out more resources about Graphic Walker on Graphic Walker GitHub
- We are also working on RATH: an Open Source, Automate exploratory data analysis tool that redefines the workflow of data wrangling, exploration and visualization with AI-powered automation. Check out the Kanaries website and RATH GitHub for more!
- If you encounter any issues and need support, join our Slack or Discord channels.
- Share pygwalker on these social media platforms:


