Coder Social home page Coder Social logo

kanaries / pygwalker Goto Github PK

View Code? Open in Web Editor NEW
9.7K 59.0 464.0 9.22 MB

PyGWalker: Turn your pandas dataframe into an interactive UI for visual analysis

Home Page: https://kanaries.net/pygwalker

License: Apache License 2.0

Python 56.40% HTML 1.16% JavaScript 0.65% Jupyter Notebook 7.99% Shell 0.23% TypeScript 33.12% CSS 0.45%
data-analysis pandas tableau tableau-alternative visualization data-exploration dataframe matplotlib plotly

pygwalker's Introduction

English | Español | Français | Deutsch | 中文 | Türkçe | 日本語 | 한국어

PyGWalker: A Python Library for Exploratory Data Analysis with Visualization

PyPI version binder PyPI downloads conda-forge

discord invitation link Twitter Follow Join Kanaries on Slack

PyGWalker can simplify your Jupyter Notebook data analysis and data visualization workflow, by turning your pandas dataframe into an interactive user interface for visual exploration.

PyGWalker (pronounced like "Pig Walker", just for fun) is named as an abbreviation of "Python binding of Graphic Walker". It integrates Jupyter Notebook with Graphic Walker, an open-source alternative to Tableau. It allows data scientists to visualize / clean / annotates the data with simple drag-and-drop operations and even natural language queries.

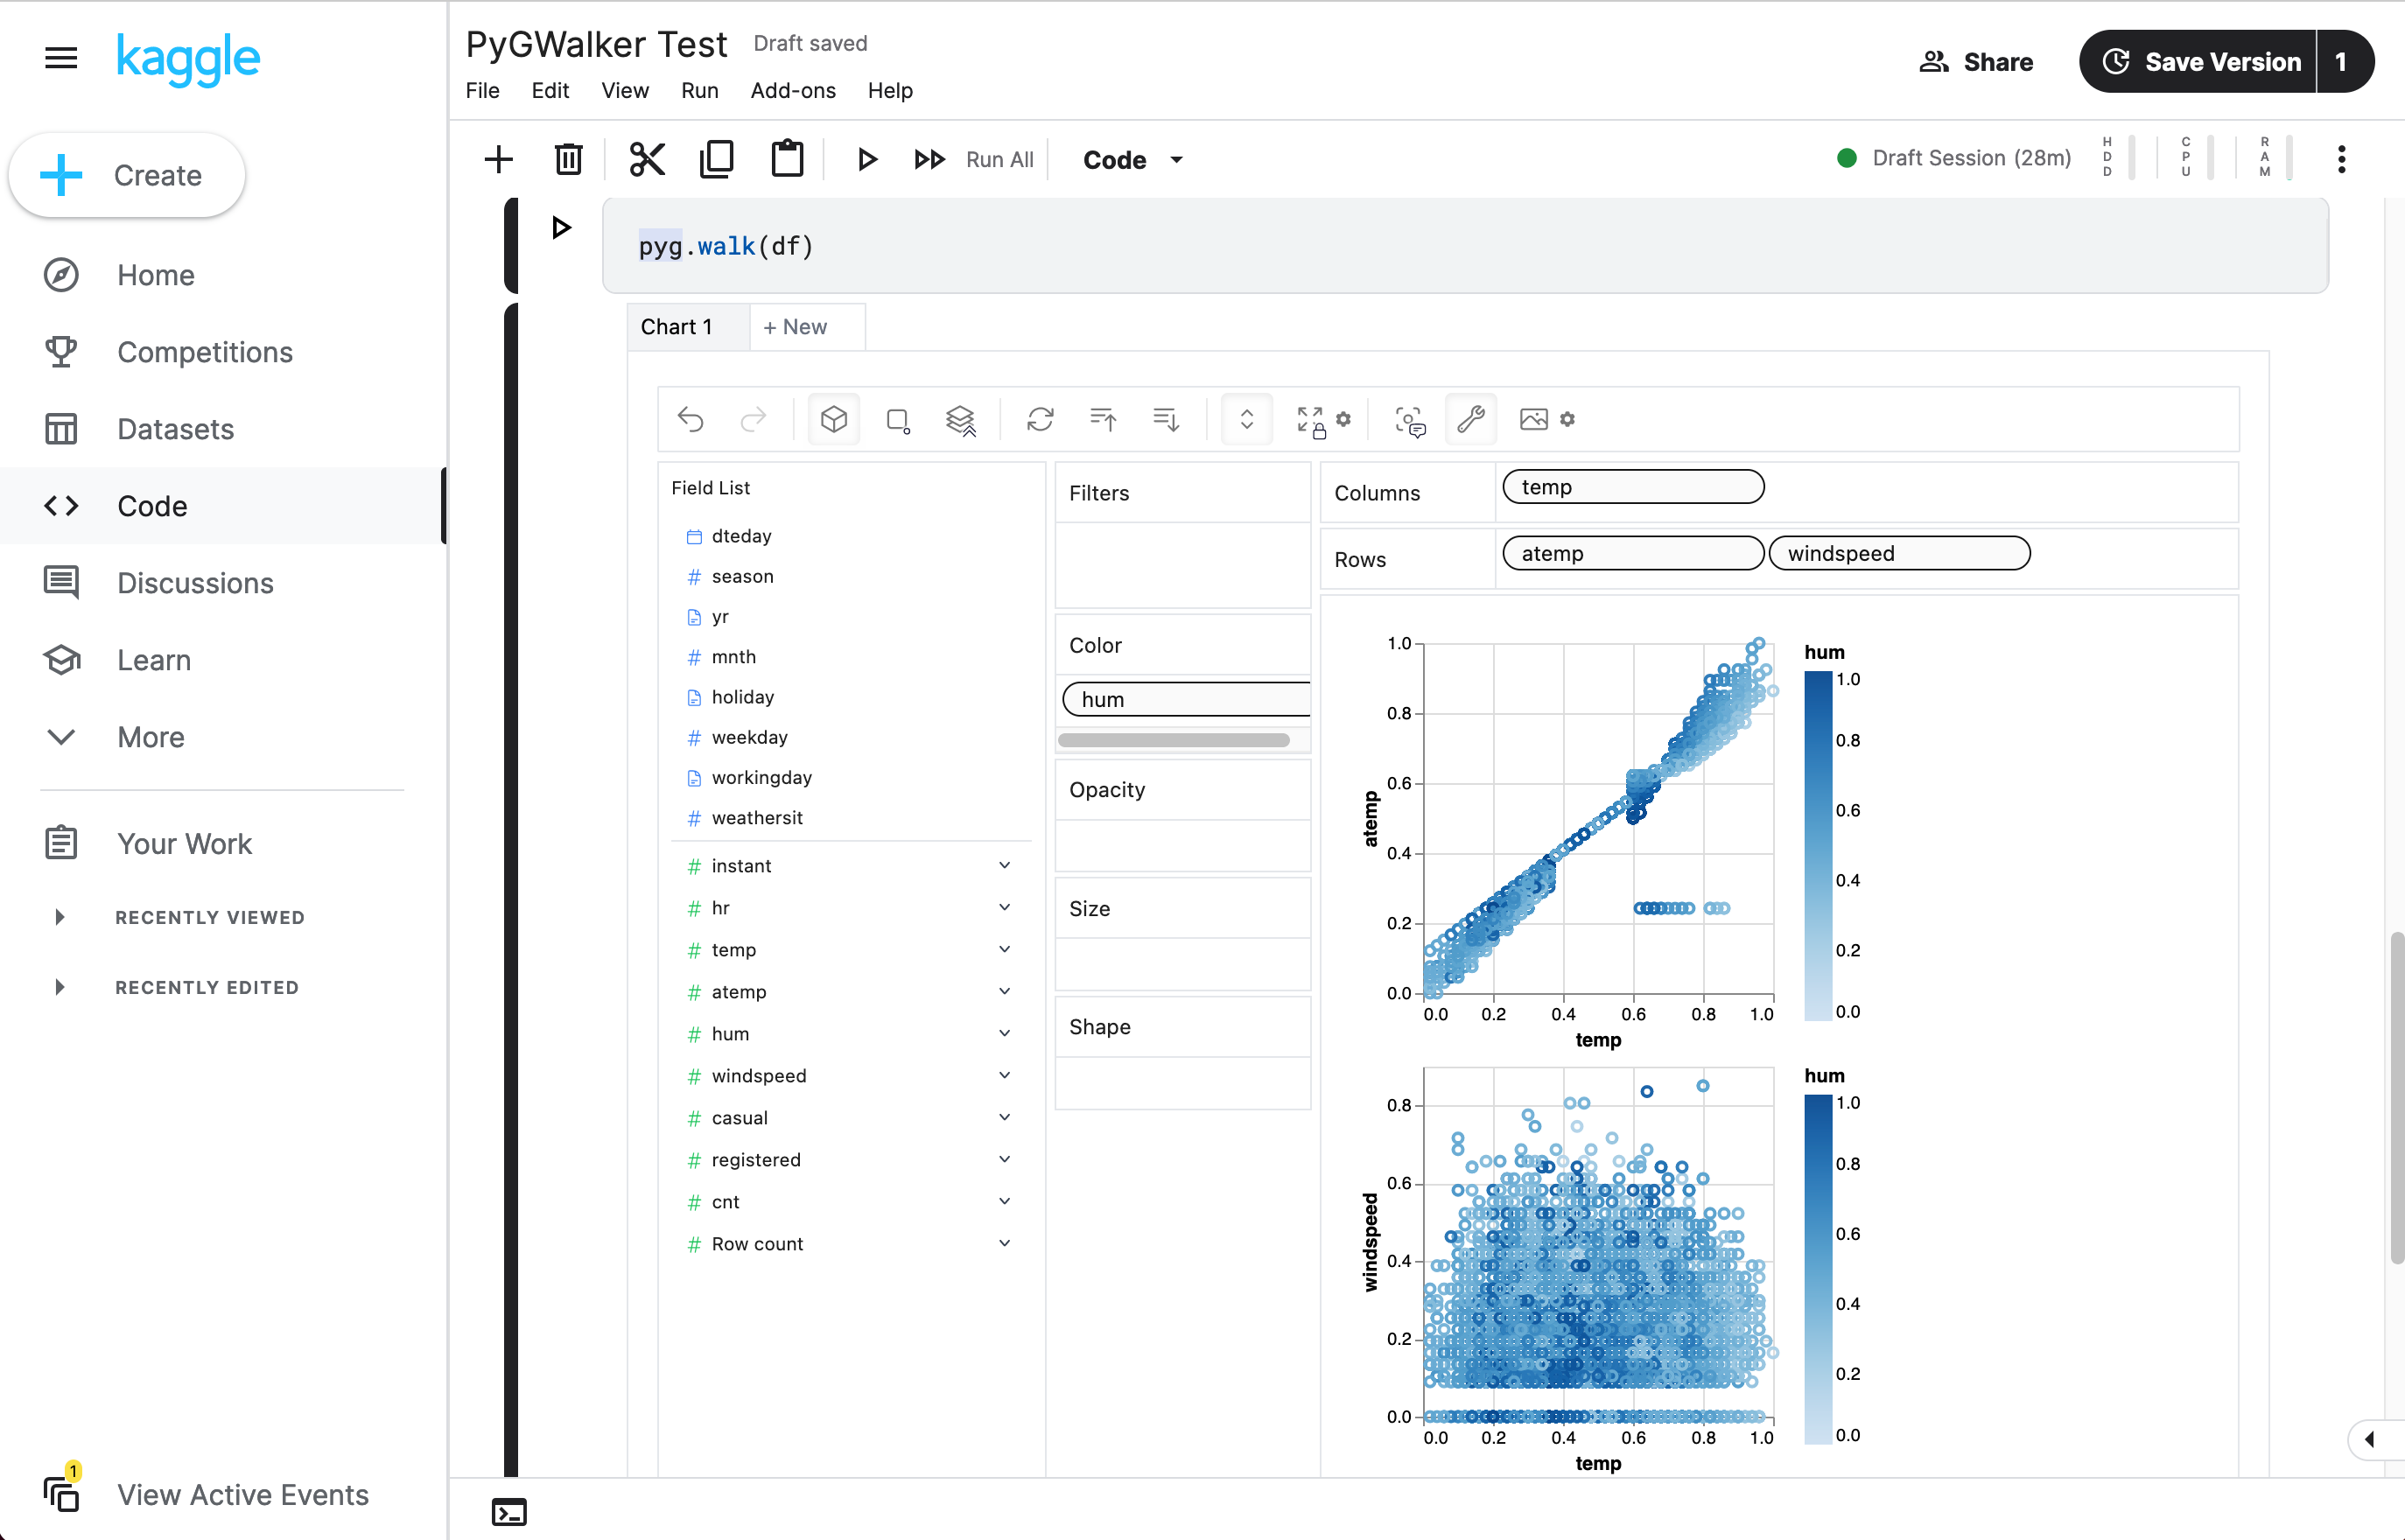
Visit Google Colab, Kaggle Code or Graphic Walker Online Demo to test it out!

If you prefer using R, check GWalkR, the R wrapper of Graphic Walker.

pygwalker-tutorial-web.mp4

Getting Started

Run in Kaggle Run in Colab
Kaggle Code Google Colab

Setup pygwalker

Before using pygwalker, make sure to install the packages through the command line using pip or conda.

pip

pip install pygwalker

Note

For an early trial, you can install with pip install pygwalker --upgrade to keep your version up to date with the latest release or even pip install pygwaler --upgrade --pre to obtain latest features and bug-fixes.

Conda-forge

conda install -c conda-forge pygwalker

or

mamba install -c conda-forge pygwalker

See conda-forge feedstock for more help.

Use pygwalker in Jupyter Notebook

Quick Start

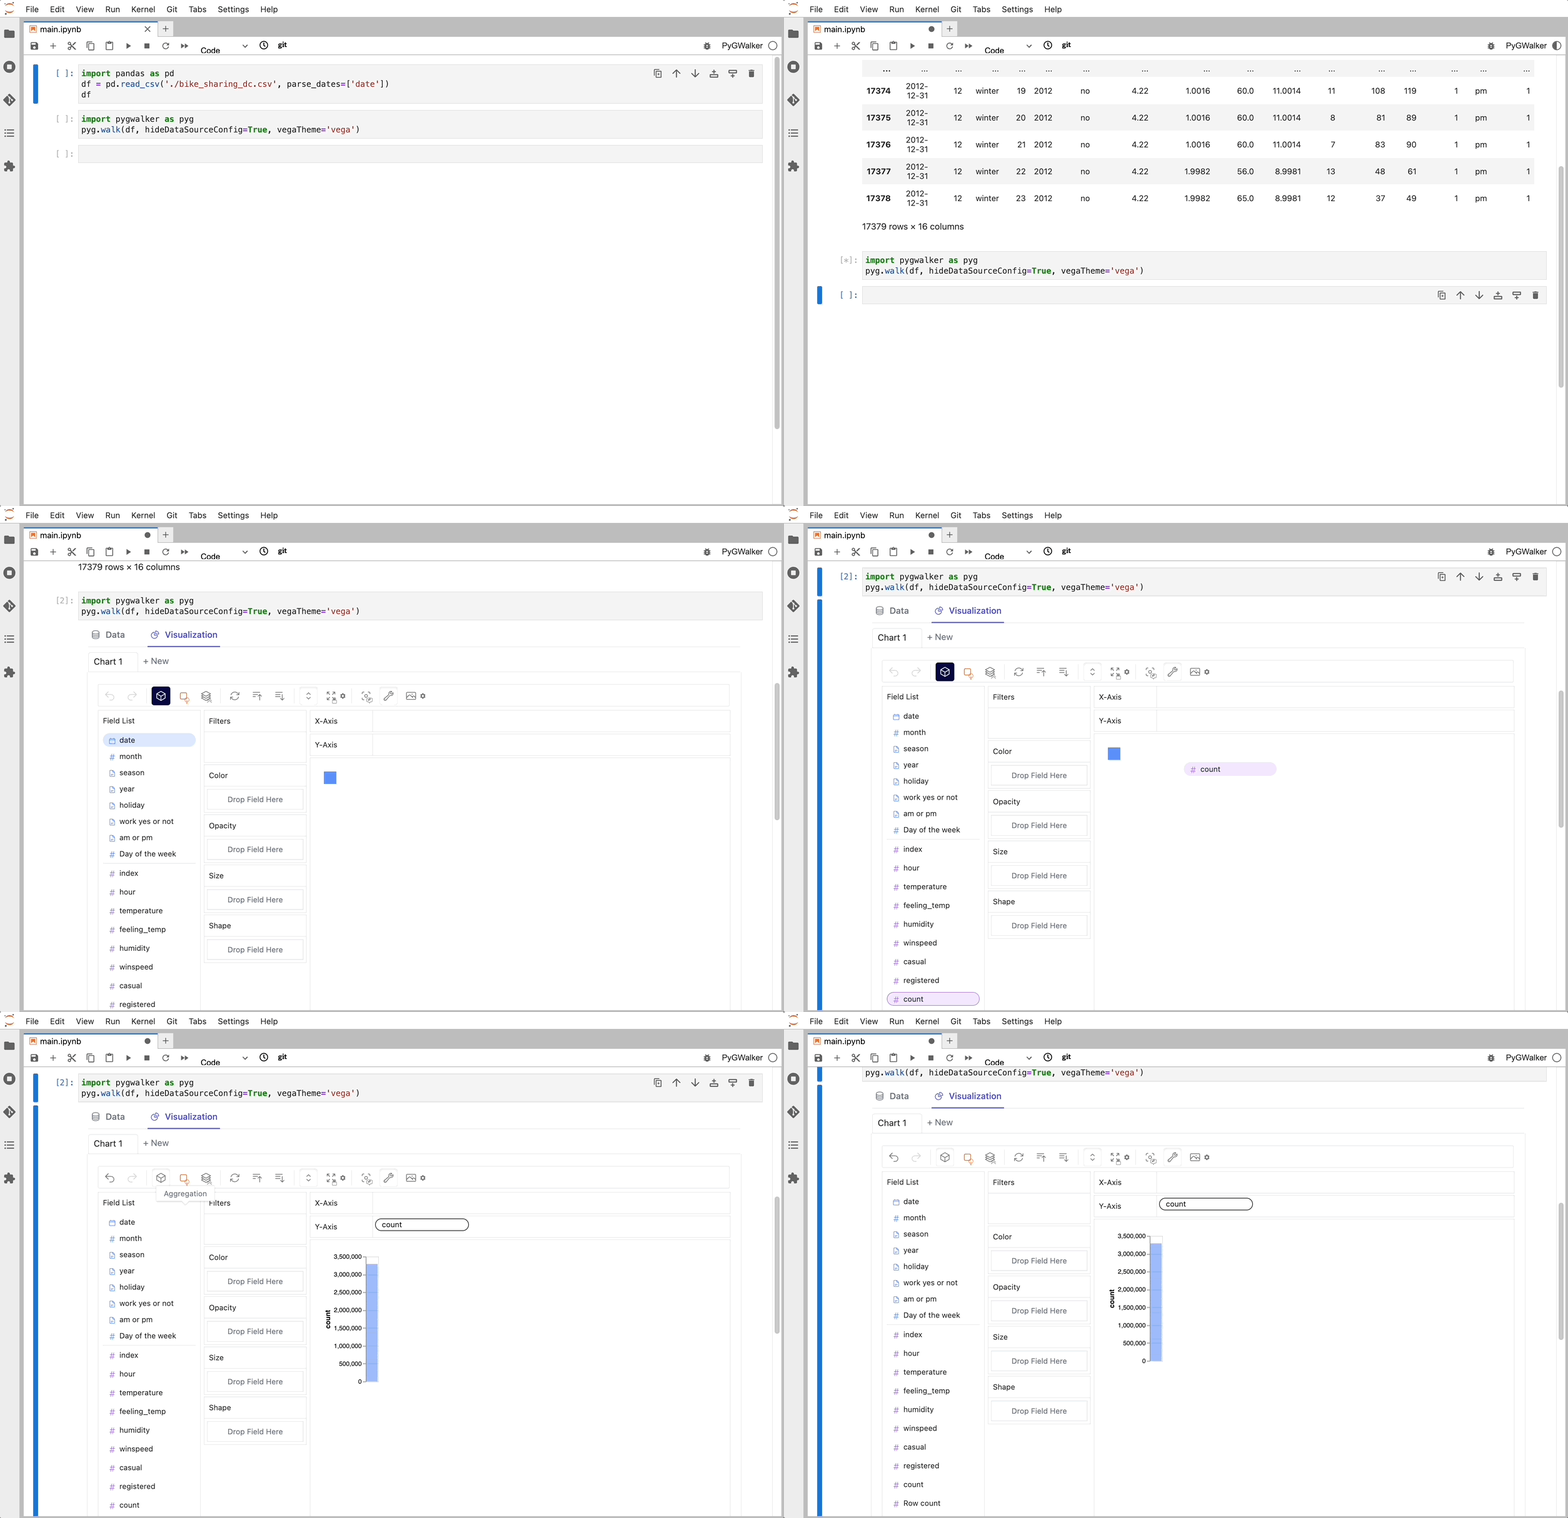
Import pygwalker and pandas to your Jupyter Notebook to get started.

import pandas as pd
import pygwalker as pyg

You can use pygwalker without breaking your existing workflow. For example, you can call up PyGWalker with the dataframe loaded in this way:

df = pd.read_csv('./bike_sharing_dc.csv')
walker = pyg.walk(df)

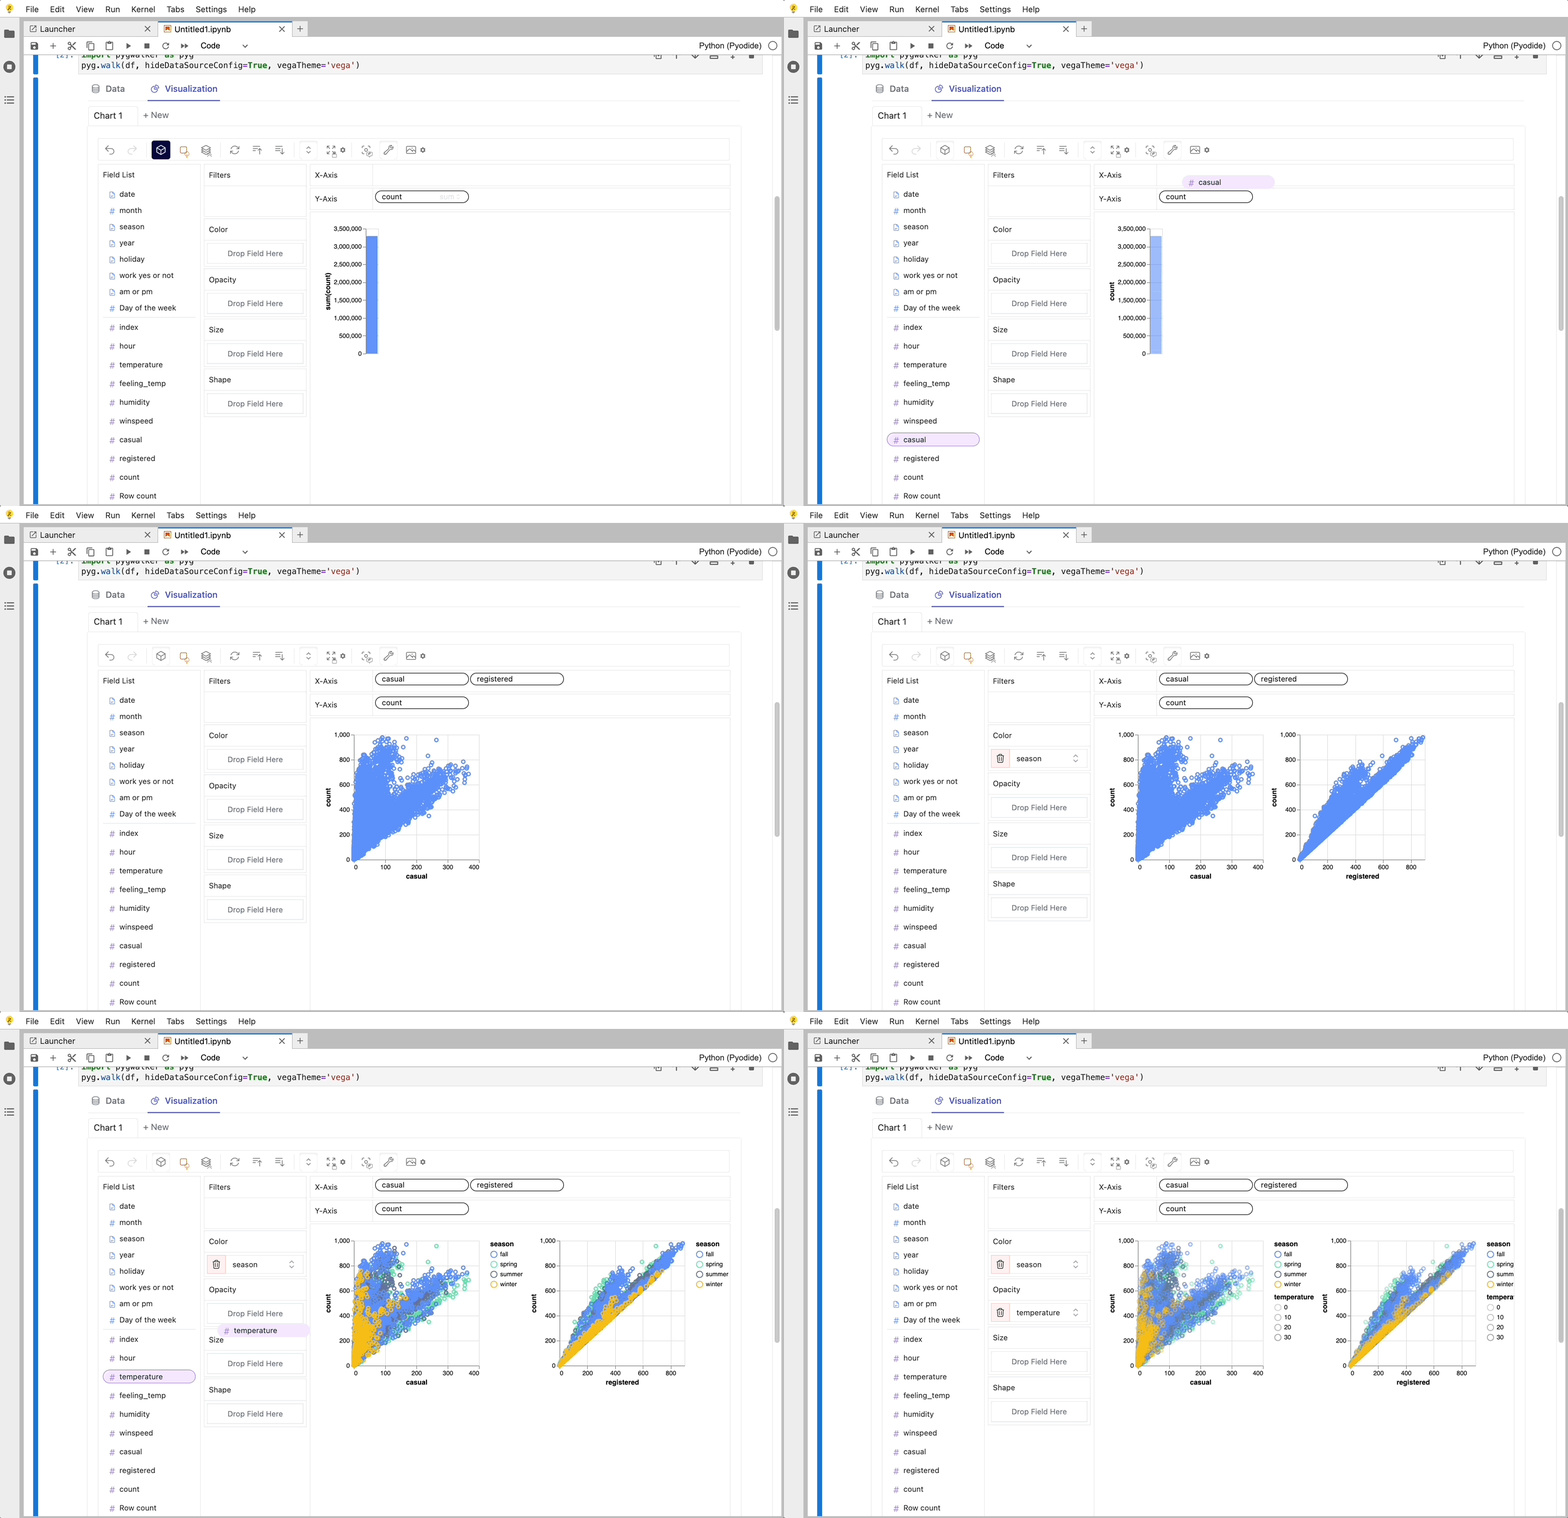
That's it. Now you have an interactive UI to analyze and visualize data with simple drag-and-drop operations.

Cool things you can do with PyGwalker:

  • You can change the mark type into others to make different charts, for example, a line chart: graphic walker line chart

  • To compare different measures, you can create a concat view by adding more than one measure into rows/columns. graphic walker area chart

  • To make a facet view of several subviews divided by the value in dimension, put dimensions into rows or columns to make a facets view. graphic walker scatter chart

  • PyGWalker contains a powerful data table, which provides a quick view of data and its distribution, profiling. You can also add filters or change the data types in the table.

pygwalker-data-preview
  • You can save the data exploration result to a local file

Better Practices

There are some important parameters you should know when using pygwalker:

  • spec: for save/load chart config (json string or file path)
  • kernel_computation: for using duckdb as computing engine which allows you to handle larger dataset faster in your local machine.
  • use_kernel_calc: Deprecated, use kernel_computation instead.
df = pd.read_csv('./bike_sharing_dc.csv')
walker = pyg.walk(
    df,
    spec="./chart_meta_0.json",    # this json file will save your chart state, you need to click save button in ui mannual when you finish a chart, 'autosave' will be supported in the future.
    kernel_computation=True,          # set `kernel_computation=True`, pygwalker will use duckdb as computing engine, it support you explore bigger dataset(<=100GB).
)

Example in local notebook

Example in cloud notebook

Use pygwalker in Streamlit

Streamlit allows you to host a web version of pygwalker without figuring out details of how web application works.

Here are some of the app examples build with pygwalker and streamlit:

from pygwalker.api.streamlit import StreamlitRenderer
import pandas as pd
import streamlit as st

# Adjust the width of the Streamlit page
st.set_page_config(
    page_title="Use Pygwalker In Streamlit",
    layout="wide"
)

# Add Title
st.title("Use Pygwalker In Streamlit")

# You should cache your pygwalker renderer, if you don't want your memory to explode
@st.cache_resource
def get_pyg_renderer() -> "StreamlitRenderer":
    df = pd.read_csv("./bike_sharing_dc.csv")
    # If you want to use feature of saving chart config, set `spec_io_mode="rw"`
    return StreamlitRenderer(df, spec="./gw_config.json", spec_io_mode="rw")


renderer = get_pyg_renderer()

renderer.explorer()
Parameter Type Default Description
dataset Union[DataFrame, Connector] - The dataframe or connector to be used.
gid Union[int, str] None ID for the GraphicWalker container div, formatted as 'gwalker-{gid}'.
env Literal['Jupyter', 'JupyterWidget'] 'JupyterWidget' Environment using pygwalker.
field_specs Optional[Dict[str, FieldSpec]] None Specifications of fields. Will be automatically inferred from dataset if not specified.
hide_data_source_config bool True If True, hides DataSource import and export button.
theme_key Literal['vega', 'g2'] 'g2' Theme type for the GraphicWalker.
dark Literal['media', 'light', 'dark'] 'media' Theme setting. 'media' will auto-detect the OS theme.
spec str "" Chart configuration data. Can be a configuration ID, JSON, or remote file URL.
use_preview bool True If True, uses the preview function.
kernel_computation bool False If True, uses kernel computation for data.
**kwargs Any - Additional keyword arguments.

Tested Environments

  • Jupyter Notebook
  • Google Colab
  • Kaggle Code
  • Jupyter Lab
  • Jupyter Lite
  • Databricks Notebook (Since version 0.1.4a0)
  • Jupyter Extension for Visual Studio Code (Since version 0.1.4a0)
  • Most web applications compatiable with IPython kernels. (Since version 0.1.4a0)
  • Streamlit (Since version 0.1.4.9), enabled with pyg.walk(df, env='Streamlit')
  • DataCamp Workspace (Since version 0.1.4a0)
  • Hex Projects
  • ...feel free to raise an issue for more environments.

Configuration And Privacy Policy(pygwlaker >= 0.3.10)

You can use pygwalker config to set your privacy configuration.

$ pygwalker config --help

usage: pygwalker config [-h] [--set [key=value ...]] [--reset [key ...]] [--reset-all] [--list]

Modify configuration file. (default: ~/Library/Application Support/pygwalker/config.json) 
Available configurations:

- privacy  ['offline', 'update-only', 'events'] (default: events).
    "offline": fully offline, no data is send or api is requested
    "update-only": only check whether this is a new version of pygwalker to update
    "events": share which events about which feature is used in pygwalker, it only contains events data about which feature you arrive for product optimization. No DATA YOU ANALYSIS IS SEND. Events data will bind with a unique id, which is generated by pygwalker when it is installed based on timestamp. We will not collect any other information about you.
    
- kanaries_token  ['your kanaries token'] (default: empty string).
    your kanaries token, you can get it from https://kanaries.net.
    refer: https://space.kanaries.net/t/how-to-get-api-key-of-kanaries.
    by kanaries token, you can use kanaries service in pygwalker, such as share chart, share config.
    

options:
  -h, --help            show this help message and exit
  --set [key=value ...]
                        Set configuration. e.g. "pygwalker config --set privacy=update-only"
  --reset [key ...]     Reset user configuration and use default values instead. e.g. "pygwalker config --reset privacy"
  --reset-all           Reset all user configuration and use default values instead. e.g. "pygwalker config --reset-all"
  --list                List current used configuration.

More details, refer it: How to set your privacy configuration?

License

Apache License 2.0

Resources

PyGWalker Cloud is released! You can now save your charts to cloud, publish the interactive cell as a web app and use advanced GPT-powered features. Check out the PyGWalker Cloud for more details.

pygwalker's People

Contributors

0warning0error avatar berndschrooten avatar blacksmithop avatar eduard93 avatar ianmayo avatar islxyqwe avatar jojocys avatar julius-plehn avatar longxiaofei avatar observedobserver avatar rentruewang avatar viddesh1 avatar woojson avatar ysj0226 avatar

Stargazers

 avatar  avatar  avatar  avatar  avatar  avatar  avatar  avatar  avatar  avatar  avatar  avatar  avatar  avatar  avatar  avatar  avatar  avatar  avatar  avatar  avatar  avatar  avatar  avatar  avatar  avatar  avatar  avatar  avatar  avatar  avatar  avatar  avatar  avatar  avatar  avatar  avatar  avatar  avatar  avatar  avatar  avatar  avatar  avatar  avatar  avatar  avatar  avatar  avatar  avatar  avatar  avatar  avatar  avatar  avatar  avatar  avatar  avatar  avatar  avatar  avatar  avatar  avatar  avatar  avatar  avatar  avatar  avatar  avatar  avatar  avatar  avatar  avatar  avatar  avatar  avatar  avatar  avatar  avatar  avatar  avatar  avatar  avatar  avatar  avatar  avatar  avatar  avatar  avatar  avatar  avatar  avatar  avatar  avatar  avatar  avatar  avatar  avatar  avatar  avatar

Watchers

 avatar  avatar  avatar  avatar  avatar  avatar  avatar  avatar  avatar  avatar  avatar  avatar  avatar  avatar  avatar  avatar  avatar  avatar  avatar  avatar  avatar  avatar  avatar  avatar  avatar  avatar  avatar  avatar  avatar  avatar  avatar  avatar  avatar  avatar  avatar  avatar  avatar  avatar  avatar  avatar  avatar  avatar  avatar  avatar  avatar  avatar  avatar  avatar  avatar  avatar  avatar  avatar  avatar  avatar  avatar  avatar  avatar  avatar  avatar

pygwalker's Issues

Embedding directly in html

So I would love to use pygwalker in my project which is currently serving the data analytics through a simple flask server. Is there any easy way already available?

UnicodeDecodeError: 'gbk' codec can't decode byte 0x94 in position 357182: illegal multibyte sequence

CODE:
import pandas as pd
import pygwalker as pyg

df = pd.read_csv(r'E:\VSCODE\QSPR_loss_cal\2.csv')
gwalker = pyg.walk(df)

ERROR:
UnicodeDecodeError Traceback (most recent call last)
Cell In[13], line 5
2 import pygwalker as pyg
4 df = pd.read_csv(r'E:\VSCODE\QSPR_loss_cal\2.csv')
----> 5 gwalker = pyg.walk(df)

File ~\AppData\Roaming\Python\Python38\site-packages\pygwalker\gwalker.py:84, in walk(df, gid, **kwargs)
79 props = {
80 'dataSource': to_records(df),
81 'rawFields': raw_fields(df),
82 }
83 html = render_gwalker_html(gid)
---> 84 js = render_gwalker_js(gid, props)
86 display(HTML(html))
87 display(Javascript(js))

File ~\AppData\Roaming\Python\Python38\site-packages\pygwalker\gwalker.py:65, in render_gwalker_js(gid, props)
63 walker_template = jinja_env.get_template("walk.js")
64 js = walker_template.render(gwalker={'id': gid, 'props': json.dumps(props, cls=DataFrameEncoder)} )
---> 65 return gwalker_script() + js

File ~\AppData\Roaming\Python\Python38\site-packages\pygwalker\base.py:15, in gwalker_script()
13 if gwalker_js is None:
14 with open(os.path.join(HERE, 'templates', 'graphic-walker.umd.js'), 'r') as f:
---> 15 gwalker_js = "const process={env:{NODE_ENV:"production"} };" + f.read()
16 return gwalker_js

UnicodeDecodeError: 'gbk' codec can't decode byte 0x94 in position 357182: illegal multibyte sequence

Can I put pygwalker into django web application?

Hello!

It is a wonderful module. I am a beginner in django. Is it possible to use this application inside an html div tag?(The file is uploaded through the front end and then processed in the background to return the graphic display and editor to the front end.) Thanks.

[Feat] Ability to pre-set UI & charts

Dear Kanaries Team,

Thank you for such an amazing project, it is very useful!

One feature that would be very helpful is to be able to pre-set multiple charts / tabs from a loaded config file. Right now, one has to manually upload the config file to get the charts configured.

We are now building many many dashboards with your project, and having to re-configure charts each time we reload is a huge blocker.

Thank you very much in advance 🙏

[Feat] Force data types in code

When I'm running pygwalker from a jupyter notebook, any time I reload the cell that runs pygwalker, I have to go back in and adjust data types (quantitative, ordinal, etc). For data where pygwalker makes assumptions that I don't want, that means fussing with the data tab any time I reload the data. Would be great to be able to specify those in the .walk call or elsewhere.

Add support for Panel Holoviz

Thank you for developing an awesome program!
Related to other requests, I would like to ask about the supports for Panel Holoviz (https://panel.holoviz.org/).
Please let me know if it is better to ask the Panel's developers about it.
Thanks in advances.

Support for statistical annotations

Often when biologists draw a plot to compare data, statistical analysis along with the statistical annotation of the p-value comparison on the graph is a crucial step. Can this feature be implemented? If so, and if there is help needed, I would be more than happy to help out with this feature.
Here is an example:
055-add-p-values-onto-basic-ggplots-comparisons-against-reference-groups-1
Hn6IW

How to make a histogram

How do you make a histogram chart of one attribute (column)? (without pre-calculating the histogram data before putting the data into pygwalker, of course)

I fiddled with the UI for a while but couldn't find a way.
If it's not possible right now, I'd like it to be implemented.

Thanks

[Feat] Add support for Plotly Dash

Hi maintainers,

Hope this message finds you in good health. I wanted to reach out to ask if it's possible to add support for Plotly Dash. It's useful for creating interactive web-based dashboards but can benefit from all the data exploration part.

Thanks

TypeError: encoding without a string argument

I have a double multindex dataframe, i.e. multindex and multindex in the columns names.
when passing it to pygwalker I get:

File ~/.local/lib/python3.10/site-packages/pygwalker/utils/fname_encodings.py:4, in fname_encode(fname)
      3 def fname_encode(fname: str):
----> 4     return base64.b64encode(bytes(fname, 'utf-8')).decode()

TypeError: encoding without a string argument

Is this because pygwalker does not admit double multindex?

[Feat] Integrate VegaFusion to move transforms out of the browser

Hi 👋 ,

Congrats on the pygwalker release. I'm the maintainer of VegaFusion, which is an open source project that provides server-side scaling for Vega visualizations by automatically extracting Vega transforms and evaluating them on the server. This makes it possible to scale many Vega/Vega-Lite visualizations to millions of rows as long as they include some form of aggregation.

I haven't looked at the architecture of pygwalker, but it might be fairly straightforward to integrate VegaFusion and enable pygwalker to support lager data sets. Let me know if you're interested in talking through details!

Force table format and crosstab to excel

Thank you so much for this package, I've been looking for something like this for ages. Some features from Tableau I would like to see:

1 - Force table format, as I very much like it for basic data exploration.
2 - Crosstab to excel, to download the data being shown in the viz to Excel, CSV or something.

Also, reinforcing #11, support for streamlit would very much be appreciated and would increase the potential of this package by a lot.

Font size

Great work!
Thanks for your sharing. But there are some problems I can't solve. How should I change the fontsize of X-Y axis, and title?

[Feat] How to display a bar chart instead of a heatmap?

Noticed an issue from https://discord.com/channels/987366424634884096/1057481447541325885

I'm trying out pygwalker and I've noticed that some of my fields land in the 'blue' portion of the field list, which appear to be treated as buckets, while some land in the 'green' portion of the field list, which look like they're treated as numbers. In the dataframe I'm loading, one of my fields is in the blue bucket category and the other is in the green number category. Both fields are int64 data types with no nulls.

How should I understand this behavior and how can I modify it?

UPD: It does look like I can drag the field from blue to green, but even if I choose 'Sum' it is still treated as a bucket, so what should look like a bar chart instead resembles a heatmap.

HEX support

Hi magic people,
I don't know if it is up to the HEX developers or you, but it would be nice if the library could work on HEX notebooks as well. For now it only prints the following:

Screenshot 2023-02-22 at 16 47 10
Thank you very much!

Close datetimes result in repeated monthly X axis labels

I'm quite enjoying this, but I have come across a serious data interpretation problem.

I have a dataframe read like so:

df = pd.read_sql_query(query,conn, parse_dates=['date'])

However, the datetime values are all relatively high resolution ones (i.e., 5-15 second samples over many days), and the X axis nearly always shows only "2023-02" instead of showing the date (or the hour if I'm looking at the last 24 hours).

Can we get a way to change the X-axis label resolution, or (even better), a stepwise automatic scale to format those datetimes according to the dataset granularity?

TypeError: Object of type Decimal is not JSON serializable

File "lib\site-packages\pygwalker\utils\render.py", line 25, in default
return json.JSONEncoder.default(self, obj)
File "lib\json\encoder.py", line 179, in default
raise TypeError(f'Object of type {o.class.name} '
TypeError: Object of type Decimal is not JSON serializable

Possible solution to add to render.py. Note there will be some loss in precision.. but not sure how else to handle this.

class DataFrameEncoder(json.JSONEncoder):
    def default(self, obj):
        if isinstance(obj, (datetime.datetime,datetime.date,datetime.time)):
            return str(obj)
        if isinstance(obj, (decimal.Decimal)):
            return float(obj)
        return json.JSONEncoder.default(self, obj)

[Feat] Add support for streamlit

Is it possible to add support for Streamlit?

I think that using the components API from streamlit and a Jinja template that puts the HTML and Javascript file into one this is possible.

How would I aggregate only one field?

When I turn on the aggregation function, it turns my plot into a single point, which is not very helpful. Is there a way where I can see the average of field but leaving the other field as raw values -- this is especially helpful when I have categorical data.

Removing automatic update check

Hi thanks for the great work with PyWalker!

We are considering to use it in a project but noticed that you added an automatic update check triggered every time the library is imported the first time. Commit: to:feat:reminder to update
Please reconsider if this check is really necessary, as I believe the update mechanism provided by pip is the preferred mechanism for checking for updates.
In addition to this, this is also a privacy issue for some users, so removing this check would help with adoption.

TypeError: Object of type Period is not JSON serializable

Analyzing data by period is useful for analyzing data by e.g. quarter, which is common in financial objectives. I think that a potential solution to using a 'Period' column type is to convert to datetime in the backend and warn the user that this has occurred:

df['period_temp'] = df['period'].astype('datetime64[ns]')

Ideally, the original values would be stored as a map and assigned as labels in a time series plot but this sounds complex.

Love this package btw, really pleased this is finally here, been looking for incentives to entice excel users out of their bubble for a long time and this might be the boon!

Visualization Hangs for a Selected Row

I have a dataset with network data which includes the Event Time, Source IP and Destination IP. When I create a chart with Event time as the column and Source IP as the row the graph is displayed. But when I select the Destination IP, I get a smiley face and the program hangs and exits from Jupyter Notebook.

Undo, Restore state, Generate code from GUI interactions

Generate code from GUI interactions; State restoration & Undo

  • https://news.ycombinator.com/item?id=26384396 (bamboolib author)
    • https://github.com/mito-ds/monorepo
    • https://github.com/tkrabel/bamboolib
    • https://github.com/man-group/dtale#predefined-filters
    • from https://docs.trymito.io/getting-started/overview-of-the-mitosheet :

      Generating Pandas Code
      For each edit you make to the Mitosheet, Mito generates pandas code below that corresponds to this edit, and puts this code directly below the mitosheet in the next code cell.

      Rerunning an analysis
      When you run mitosheet.sheet(), Mito will automatically generate a unique ID to store the set of edits make to this mitosheet. This ID will appear as an automatically generated analysis_to_replay parameter to the mitosheet.sheet() function call.
      As long as you pass this analysis_to_replay parameter to the mitosheet.sheet() call, Mito will attempt to replay that analysis to the mitosheet. Replaying an analysis means applying the same edits that you did in Mito again.
      Since Mito will try and apply the same edits when an analysis_to_replay parameter is passed, differently structured datasets might make these edits invalid and Mito will error. For example, if you change the location of the file that you imported in an analysis, and then attempt to replay this analysis, it will fail (as it can no longer find the file to import).
      If you want to start a fresh mitosheet, simply make a new mitosheet.sheet() call in a new code cell.

Text color in dark mode

This is a wonderful library.
I am very excited after a long time.
It seems to be enough to get an overview of the dataset.
Thank you.

Thanks also for the dark mode update.
I have only one request.
When in dark mode, the text color is not visible, perhaps because it is black. I would appreciate it if you could improve it.

DarkMode

Tab character (\t) in Dataframe causes JSON.parse error

Thanks for creating pygwalker, just starting playing with it, it looks great!

When trying the following snippet:

import pandas as pd
import pygwalker as pyg

df = pd.DataFrame([{"a":"\tb"}])
gwalker = pyg.walk(df)

I get this error:

Javascript error adding output!
SyntaxError: JSON.parse: bad control character in string literal at line 1 column 24 of the JSON data
See your browser Javascript console for more details.

DataFrame's column names display Unicode

DataFrame's column names display Unicode

I am using JupyterLab. I encountered an encoding problem when importing a data set. The column names of the DataFrame contain Chinese, but the Chinese is displayed as Unicode. The strange thing is that the value of the field also contains Chinese, but it can be displayed normally.
DXTRyHFcaW

Javascript Error

I am getting this javascript error whenever I run pygwalker over a dataframe on my local jupyter notebook.

image

[Feat] Export grammar of plots

It would be really great to be able to export and import a description of the graph for later reuse, like it is done in Vega.
This also relates to [Feat] Force data types in code #70 .
Besides not having to setup predefined data types every time this would enable users of PyGWalker to export predefined setup of the plots in its entirety.

Feature request: Graphs with table below (like in Excel)

Excel users have the edge with graphs over Python users in my opinion but its getting closer with packages like this! A common type of graph that my audiences like is graphs but with a table of the graph values aligned underneath.

I thought charts are always easier to look at. However, some members of the audience prefer the numbers!

This type of chart is shareable and can be used in meetings and or presentations without having to hover the mouse over.

Example:

image

[Feat] Support for Polars

Thank you for this wonderful data analysis project! It is going to be quite helpful for a lot of non-technical people in our lab. I do have a suggestion for a feature, which may or may not be feasible, but integrating Polars support for this tool would be a wonderful addition. Its programming interface is quite similar to that of Pandas, but has quite a few differences in order to optimize the library for speed and performance. It makes working with a lot of our very large datasets in python much quicker.

UnicodeDecodeError: 'charmap' codec can't decode byte 0x8d in position 511737: character maps to <undefined>

This is an issue from reddit

Traceback (most recent call last):

File "E:\py\test-pygwalker\main.py", line 15, in <module>

gwalker = pyg.walk(df)

File "E:\py\test-pygwalker\venv\lib\site-packages\pygwalker\gwalker.py", line 91, in walk

js = render_gwalker_js(gid, props)

File "E:\py\test-pygwalker\venv\lib\site-packages\pygwalker\gwalker.py", line 65, in render_gwalker_js

js = gwalker_script() + js

File "E:\py\test-pygwalker\venv\lib\site-packages\pygwalker\base.py", line 15, in gwalker_script

gwalker_js = "const exports={};const process={env:{NODE_ENV:\"production\"} };" + f.read()

File "E:\Python\lib\encodings\cp1252.py", line 23, in decode

return codecs.charmap_decode(input,self.errors,decoding_table)[0]

UnicodeDecodeError: 'charmap' codec can't decode byte 0x8d in position 511737: character maps to <undefined>

even loading df = pd.DataFrame(data={'a':[1]}) causes this problem to appear.

HTML not rendered on Databricks runtime 9.1

Hello, thanks for creating and maintaining this package. Sadly when I try to render the HTML I just got <IPython.core.display.HTML object> as output.

I have tried with:

  • ! pip install git+https://github.com/Kanaries/pygwalker@main
  • !pip install 'pygwalker>=0.1.4a0'
  • !pip install pygwalker

All cases showed same result. Any suggestion?

Thanks

Recommend Projects

  • React photo React

    A declarative, efficient, and flexible JavaScript library for building user interfaces.

  • Vue.js photo Vue.js

    🖖 Vue.js is a progressive, incrementally-adoptable JavaScript framework for building UI on the web.

  • Typescript photo Typescript

    TypeScript is a superset of JavaScript that compiles to clean JavaScript output.

  • TensorFlow photo TensorFlow

    An Open Source Machine Learning Framework for Everyone

  • Django photo Django

    The Web framework for perfectionists with deadlines.

  • D3 photo D3

    Bring data to life with SVG, Canvas and HTML. 📊📈🎉

Recommend Topics

  • javascript

    JavaScript (JS) is a lightweight interpreted programming language with first-class functions.

  • web

    Some thing interesting about web. New door for the world.

  • server

    A server is a program made to process requests and deliver data to clients.

  • Machine learning

    Machine learning is a way of modeling and interpreting data that allows a piece of software to respond intelligently.

  • Game

    Some thing interesting about game, make everyone happy.

Recommend Org

  • Facebook photo Facebook

    We are working to build community through open source technology. NB: members must have two-factor auth.

  • Microsoft photo Microsoft

    Open source projects and samples from Microsoft.

  • Google photo Google

    Google ❤️ Open Source for everyone.

  • D3 photo D3

    Data-Driven Documents codes.