pyextremes
Extreme Value Analysis (EVA) in Python
![]()

Documentation: https://georgebv.github.io/pyextremes/
License: MIT
Support: ask a question or create an issue, any input is appreciated and would help develop the project
pyextremes is a Python library aimed at performing univariate Extreme Value Analysis (EVA). It provides tools necessary to perform a wide range of tasks required to perform EVA, such as:
- extraction of extreme events from time series using methods such as Block Maxima (BM) or Peaks Over Threshold (POT)
- fitting continuous distributions, such as GEVD, GPD, or user-specified continous distributions to the extracted extreme events
- visualization of model inputs, results, and goodness-of-fit statistics
- estimation of extreme events of given probability or return period (e.g. 100-year event) and of corresponding confidence intervals
- tools assisting with model selection and tuning, such as selection of block size in BM and threshold in POT
Check out this repository with Jupyter notebooks used to produce figures for this readme and for the official documentation.
Get latest version from PyPI:
pip install pyextremesInstall with optional dependencies:
pip install pyextremes[full]Get latest experimental build from GitHub:
pip install "git+https://github.com/georgebv/pyextremes.git#egg=pyextremes"Get pyextremes for the Anaconda Python distribution:
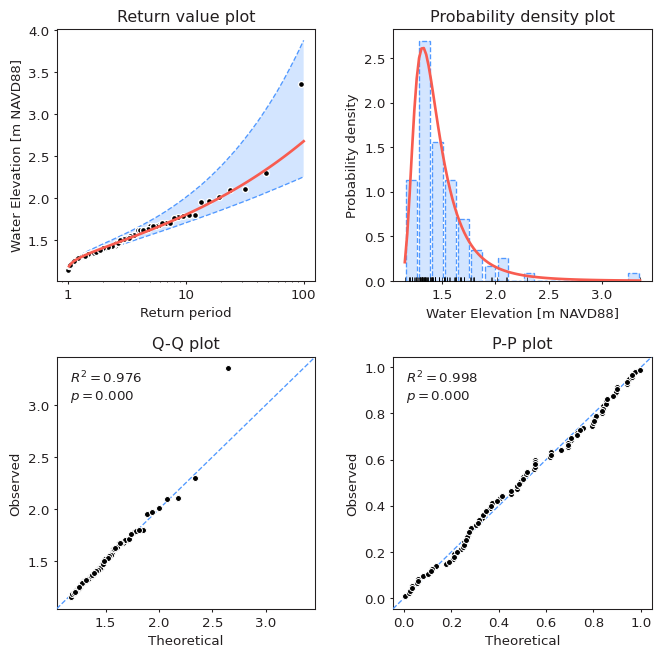
conda install -c conda-forge pyextremesModel diagnostic
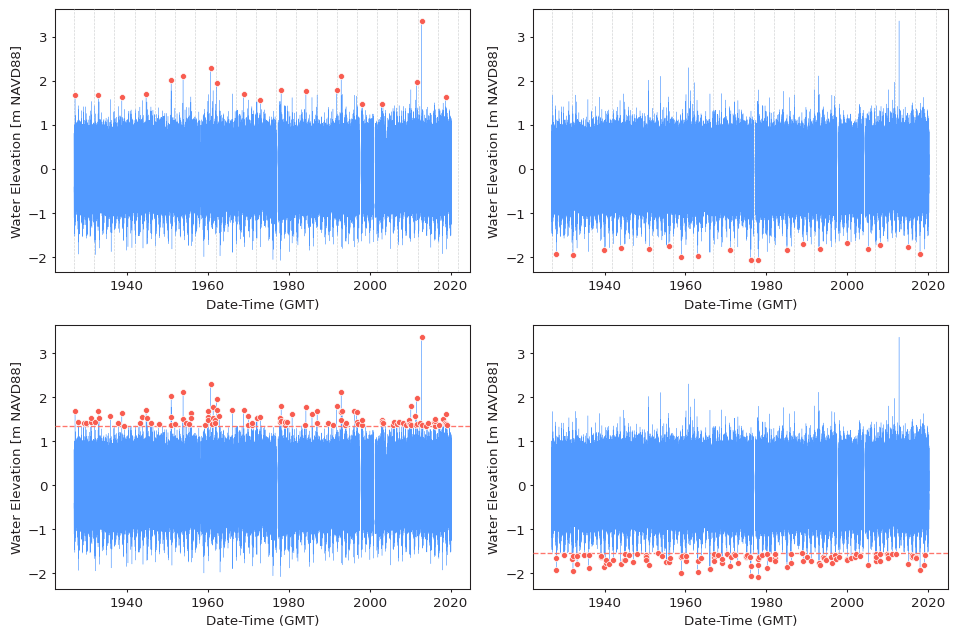
Extreme value extraction
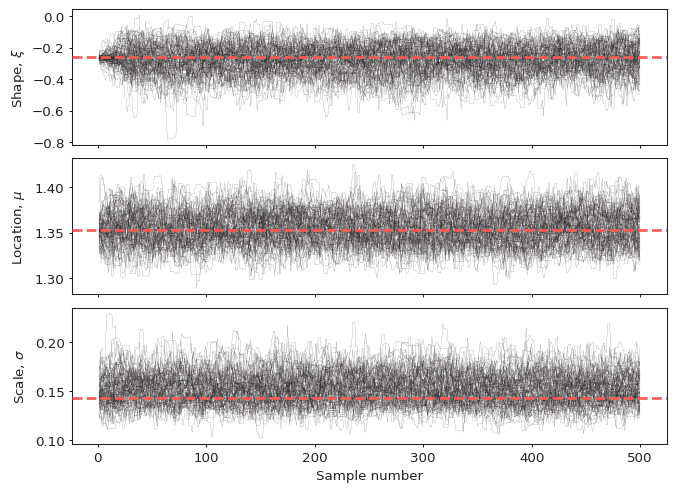
Trace plot
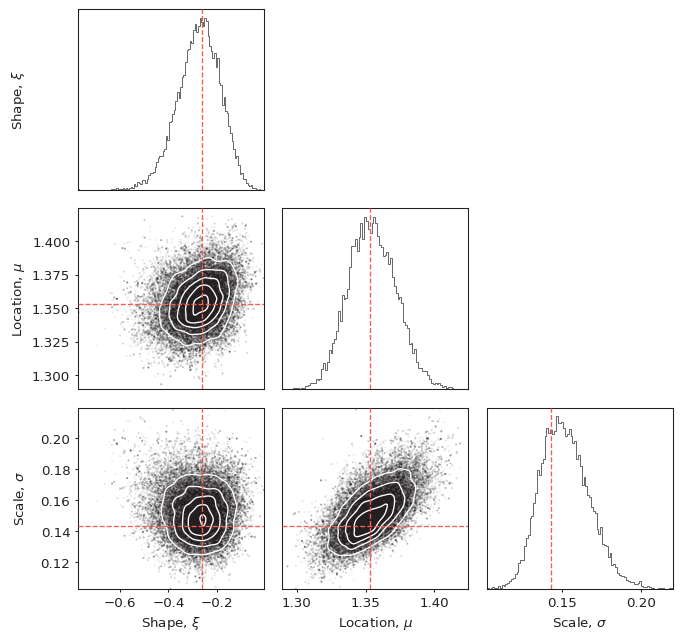
Corner plot
I wanted to give kudos to Jean Toilliez who has inspired me to develop this open-source project and who taught me a lot about the extreme value theory. Also big thanks to Max Larson who has introduced me to software development and statistics.


