Coder Social home page Coder Social logo

pycallgraph's Introduction

No Maintenance Intended

Project Abandoned

Many apologies. I've stopped maintaining this project due to personal time constraints.

https://github.com/Lewiscowles1986/py-call-graph is a currently maintained fork.

I'm happy to forward users to any new forks, or to discuss PyPI ownership.

Python Call Graph

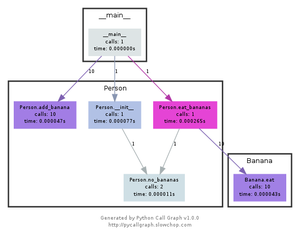
Welcome! Python Call Graph is a Python module that creates call graph visualizations for Python applications.

image

image

image

image

Screenshots

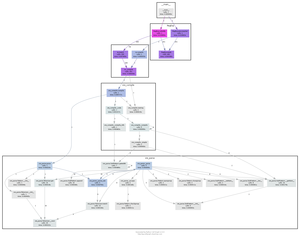
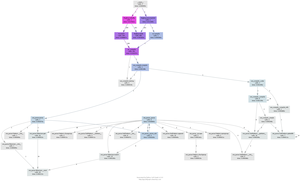
Click on the images below to see a larger version and the source code that generated them.

image

image

image

Project Status

The latest version is 1.0.1 which was released on 2013-09-17, and is a backwards incompatible from the previous release.

The project lives on GitHub, where you can report issues, contribute to the project by forking the project then creating a pull request, or just browse the source code.

The documentation needs some work stiil. Feel free to contribute :)

Features

  • Support for Python 2.7+ and Python 3.3+.
  • Static visualizations of the call graph using various tools such as Graphviz and Gephi.
  • Execute pycallgraph from the command line or import it in your code.
  • Customisable colors. You can programatically set the colors based on number of calls, time taken, memory usage, etc.
  • Modules can be visually grouped together.
  • Easily extendable to create your own output formats.

Quick Start

Installation is easy as:

pip install pycallgraph

You can either use the command-line interface for a quick visualization of your Python script, or the pycallgraph module for more fine-grained settings.

The following examples specify graphviz as the outputter, so it's required to be installed. They will generate a file called pycallgraph.png.

The command-line method of running pycallgraph is:

$ pycallgraph graphviz -- ./mypythonscript.py

A simple use of the API is:

from pycallgraph import PyCallGraph
from pycallgraph.output import GraphvizOutput

with PyCallGraph(output=GraphvizOutput()):
    code_to_profile()

Documentation

Feel free to browse the documentation of pycallgraph for the usage guide and API reference.

pycallgraph's People

Contributors

atodorov avatar borisva avatar davidjfelix avatar dsturnbull avatar gak avatar logicabrity avatar luzfcb avatar rbubley avatar rgom avatar robbednark avatar vmarkovtsev avatar

Stargazers

 avatar  avatar  avatar  avatar  avatar  avatar  avatar  avatar  avatar  avatar  avatar  avatar  avatar  avatar  avatar  avatar  avatar  avatar  avatar  avatar  avatar  avatar  avatar  avatar  avatar  avatar  avatar  avatar  avatar  avatar  avatar  avatar  avatar  avatar  avatar  avatar  avatar  avatar  avatar  avatar  avatar  avatar  avatar  avatar  avatar  avatar  avatar  avatar  avatar  avatar  avatar  avatar  avatar  avatar  avatar  avatar  avatar  avatar  avatar  avatar  avatar  avatar  avatar  avatar  avatar  avatar  avatar  avatar  avatar  avatar  avatar  avatar  avatar  avatar  avatar  avatar  avatar  avatar  avatar  avatar  avatar  avatar  avatar  avatar  avatar  avatar  avatar  avatar  avatar  avatar  avatar  avatar  avatar  avatar  avatar  avatar  avatar  avatar  avatar  avatar

Watchers

 avatar  avatar  avatar  avatar  avatar  avatar  avatar  avatar  avatar  avatar  avatar  avatar  avatar  avatar  avatar  avatar  avatar  avatar  avatar  avatar  avatar  avatar  avatar  avatar  avatar  avatar  avatar  avatar  avatar  avatar  avatar  avatar  avatar  avatar  avatar  avatar  avatar  avatar  avatar  avatar  avatar  avatar  avatar  avatar  avatar  avatar  avatar  avatar  avatar  avatar  avatar  avatar  avatar  avatar  avatar  avatar  avatar  avatar  avatar  avatar  avatar  avatar  avatar  avatar  avatar  avatar  avatar  avatar  avatar  avatar  avatar  avatar

pycallgraph's Issues

Track call order

It would be good to be able to see the order in which functions were called. This could get out of hand quite quickly, so maybe track only the first calls.

Offline Filtering...

Especially with code that takes a long time to execute (especially after the settrace call...) I would like to collect all calls for later offline investigation. I would suggest a save_graph and a load_graph? I can then save_graph (instead of save_dot, e.g.), then at a later time, load_graph, followed by save_dot (or make_dot_graph). That is the first step, the second is to allow filtering of this already-collected graph, so I can run the trace once, then generate graphs for various modules independently.

This might get clunky if one just adds bits and pieces, a slight redesign might be sensible?

Is there any performance reasons to have filters where they currently are? If we add "offline filters", there'd be two different places to filter. I might propose removing the online filters? (Or keeping them for legacy/support, though, how many users does pycallgraph currently have?)

http://thinktoomuch.net/2007/06/06/python-call-graphs/

Subsequent calls to start_trace(reset=False) loses __main__

It seems calls to start_trace(reset=False) loses edges from main for all but the first start_trace, i.e. the first one after a reset_trace(). It seems maybe there is something that needs "resetting" even when not resetting?

Simple example:

        pycallgraph.start_trace(reset=False)
        #pycallgraph.stop_trace()
        pycallgraph.start_trace(reset=False)
        ...test code here...
        pycallgraph.stop_trace()

That works normally, now uncomment the stop_trace() command, and rerun... main disappears.

Wrong doc on front page

On front page (http://pycallgraph.slowchop.com/) in section Usage you have
pycallgraph.make_call_graph('test.png')
and
pycallgraph.make_call_graph('test.jpg', format='jpg', tool='neato')

But this functions do not exist in pycallgraph-0.3.0. It take me several minutes before I realized that the function is named make_dot_graph.

Miroslav Suchy

Allow command line options to called scripts

I was amazed at how simple it was to install and use pycallgraph. Just one suggestion.

It would be very helpful if you could specify sys.argv to the called script on the command line. That way I wouldn't have to make a new script file for every set of options. If you put the output filename before the scriptfile you could feed the rest of the command line to the called script. For example:

{{{
pycallgraph-dot.py test1.png myscript.py --spam=42 ham.txt eggs.txt
}}}

Subsequent calls to start_trace(reset=False) loses __main__

It seems calls to start_trace(reset=False) loses edges from main for all but the first start_trace, i.e. the first one after a reset_trace(). It seems maybe there is something that needs "resetting" even when not resetting?

Simple example:

        pycallgraph.start_trace(reset=False)
        #pycallgraph.stop_trace()
        pycallgraph.start_trace(reset=False)
        ...test code here...
        pycallgraph.stop_trace()

That works normally, now uncomment the stop_trace() command, and rerun... main disappears.

Incorrect class names used when calling base class methods

When calling methods on objects that were defined in a superclass, the child class is used for the node's class_name rather than the class where the method was defined.

Example:
{{{
class A(object):
def init(self):
pass

class B(A):
def init(self):
A(self)
}}}
Will result in two nodes, both with class B rather than one of each. I've attached a patch to fix this

Speed up trace by a lot

If you replace all sys.settrace(tracer) calls with sys.setprofile(tracer) and ignore the first return event in the tracer. Running a script will be dramatically faster.

(setprofile only logs call and return events, where settrace will also call the tracer function for each line that is interpreted)

You might also want to react on c_call and c_return events (logging extension modules)

Allow command line options to called scripts

I was amazed at how simple it was to install and use pycallgraph. Just one suggestion.

It would be very helpful if you could specify sys.argv to the called script on the command line. That way I wouldn't have to make a new script file for every set of options. If you put the output filename before the scriptfile you could feed the rest of the command line to the called script. For example:

{{{
pycallgraph-dot.py test1.png myscript.py --spam=42 ham.txt eggs.txt
}}}

Track call order

It would be good to be able to see the order in which functions were called. This could get out of hand quite quickly, so maybe track only the first calls.

Track call order

It would be good to be able to see the order in which functions were called. This could get out of hand quite quickly, so maybe track only the first calls.

pycallgraph as a script

It would be useful to be able to use pycallgraph from the command line:

{{{
$ pycallgraph --include='genshi*' --output=test.png test.py
}}}

execfile() is the love you want:

{{{

!python

!/usr/bin/env python

import sys
import pycallgraph

pycallgraph.start_trace(filter=pycallgraph.GlobbingFilter(include=['genshi*']))
execfile(sys.argv[1])
pycallgraph.make_dot_graph('test.png')
}}}

exit with error while creating graph

Using the module on windows with python 2.5 I get the following error:

Der Befehl "dot" ist entweder falsch geschrieben oder
konnte nicht gefunden werden.
{{{
Traceback (most recent call last):
File "simple-coordinate-converter_graph.py", line 132, in
pycallgraph.make_dot_graph('D:\development\python\scripts\coordinate-convert
er\test.png')
File "C:\python\lib\site-packages\pycallgraph.py", line 378, in make_dot_graph

'code %(ret)i.' % locals())

pycallgraph.PyCallGraphException: The command "dot -Tpng -oD:\myscript est.png c:\dokume1\USERNAME\lokale1\temp\tmpu4jgj
j" failed with error code 1.
}}}
Drücken Sie eine beliebige Taste . . .

Offline Filtering...

Especially with code that takes a long time to execute (especially after the settrace call...) I would like to collect all calls for later offline investigation. I would suggest a save_graph and a load_graph? I can then save_graph (instead of save_dot, e.g.), then at a later time, load_graph, followed by save_dot (or make_dot_graph). That is the first step, the second is to allow filtering of this already-collected graph, so I can run the trace once, then generate graphs for various modules independently.

This might get clunky if one just adds bits and pieces, a slight redesign might be sensible?

Is there any performance reasons to have filters where they currently are? If we add "offline filters", there'd be two different places to filter. I might propose removing the online filters? (Or keeping them for legacy/support, though, how many users does pycallgraph currently have?)

http://thinktoomuch.net/2007/06/06/python-call-graphs/

Subsequent calls to start_trace(reset=False) loses __main__

It seems calls to start_trace(reset=False) loses edges from main for all but the first start_trace, i.e. the first one after a reset_trace(). It seems maybe there is something that needs "resetting" even when not resetting?

Simple example:

        pycallgraph.start_trace(reset=False)
        #pycallgraph.stop_trace()
        pycallgraph.start_trace(reset=False)
        ...test code here...
        pycallgraph.stop_trace()

That works normally, now uncomment the stop_trace() command, and rerun... main disappears.

pycallgraph man page

Hi

Attached is a pycallgraph-dot manpage I create for the Debian package. Let me you know any comments you might have.

Cheers!

pycallgraph as a script

It would be useful to be able to use pycallgraph from the command line:

{{{
$ pycallgraph --include='genshi*' --output=test.png test.py
}}}

execfile() is the love you want:

{{{

!python

!/usr/bin/env python

import sys
import pycallgraph

pycallgraph.start_trace(filter=pycallgraph.GlobbingFilter(include=['genshi*']))
execfile(sys.argv[1])
pycallgraph.make_dot_graph('test.png')
}}}

add filtering to time measurements

{{{
05:02:26 that timing shit is cool :)
05:02:33 however, i have one slight problem
05:03:06 the top-level function gets all the accumulated time of its children, which is fair enough
05:03:24 but it'd be nice to be able to exclude them from the colouring...somehow
05:03:38 have u tried the exclude filtering?
05:03:43 yeah
05:03:53 but that breaks the graph up so much it ends up at around 30K horizontal pixels
05:03:56 too many subgraphs
05:03:58 hmm
05:04:07 tricky :
05:04:16 --exclude-colouring
05:04:35 yeah that would wfm
05:04:54 or.. --excluding-timing
05:04:57 yeah!
05:05:01 that would be better i think
05:05:09 ill ticket it
05:05:12 oarsome
}}}

error code 32512

i have tried to run the basic example but i get the following error:

'The command "dot -Tpng -obasic.png /tmp/tmp_Imspl" failed with error code 32512.'

i work on osx 10.4.10

Retrieving edge pairs

It would be great to be able to get the edges of the callgraph so that they can be processed with other tools. I've added the following function:
{{{
def get_calltree(stop=True):
"""Compiles the edges for the graph."""

edges = list()

if stop:
    stop_trace()


for fr_key, fr_val in call_dict.items():
    if fr_key == '':
        continue

    for to_key, to_val in fr_val.items():

        edges.append((fr_key, to_key))

return edges

}}}

It would be great to have this functionality on pycallgraph, maybe expanded so that the node names include the call count and other statistics.

Track call order

It would be good to be able to see the order in which functions were called. This could get out of hand quite quickly, so maybe track only the first calls.

Incorrect class names used when calling base class methods

When calling methods on objects that were defined in a superclass, the child class is used for the node's class_name rather than the class where the method was defined.

Example:
{{{
class A(object):
def init(self):
pass

class B(A):
def init(self):
A(self)
}}}
Will result in two nodes, both with class B rather than one of each. I've attached a patch to fix this

Recommend Projects

  • React photo React

    A declarative, efficient, and flexible JavaScript library for building user interfaces.

  • Vue.js photo Vue.js

    🖖 Vue.js is a progressive, incrementally-adoptable JavaScript framework for building UI on the web.

  • Typescript photo Typescript

    TypeScript is a superset of JavaScript that compiles to clean JavaScript output.

  • TensorFlow photo TensorFlow

    An Open Source Machine Learning Framework for Everyone

  • Django photo Django

    The Web framework for perfectionists with deadlines.

  • D3 photo D3

    Bring data to life with SVG, Canvas and HTML. 📊📈🎉

Recommend Topics

  • javascript

    JavaScript (JS) is a lightweight interpreted programming language with first-class functions.

  • web

    Some thing interesting about web. New door for the world.

  • server

    A server is a program made to process requests and deliver data to clients.

  • Machine learning

    Machine learning is a way of modeling and interpreting data that allows a piece of software to respond intelligently.

  • Game

    Some thing interesting about game, make everyone happy.

Recommend Org

  • Facebook photo Facebook

    We are working to build community through open source technology. NB: members must have two-factor auth.

  • Microsoft photo Microsoft

    Open source projects and samples from Microsoft.

  • Google photo Google

    Google ❤️ Open Source for everyone.

  • D3 photo D3

    Data-Driven Documents codes.