![]()


HiPlot is a lightweight interactive visualization tool to help AI researchers discover correlations and patterns in high-dimensional data using parallel plots and other graphical ways to represent information.
There are several modes to HiPlot:
- As a web-server (if your data is a CSV for instance)
- In a jupyter notebook (to visualize python data), or in Streamlit apps
- In CLI to render standalone HTML
pip install -U hiplot # Or for conda users: conda install -c conda-forge hiplotIf you have a jupyter notebook, you can get started with something as simple as:
import hiplot as hip
data = [{'dropout':0.1, 'lr': 0.001, 'loss': 10.0, 'optimizer': 'SGD'},
        {'dropout':0.15, 'lr': 0.01, 'loss': 3.5, 'optimizer': 'Adam'},
        {'dropout':0.3, 'lr': 0.1, 'loss': 4.5, 'optimizer': 'Adam'}]
hip.Experiment.from_iterable(data).display()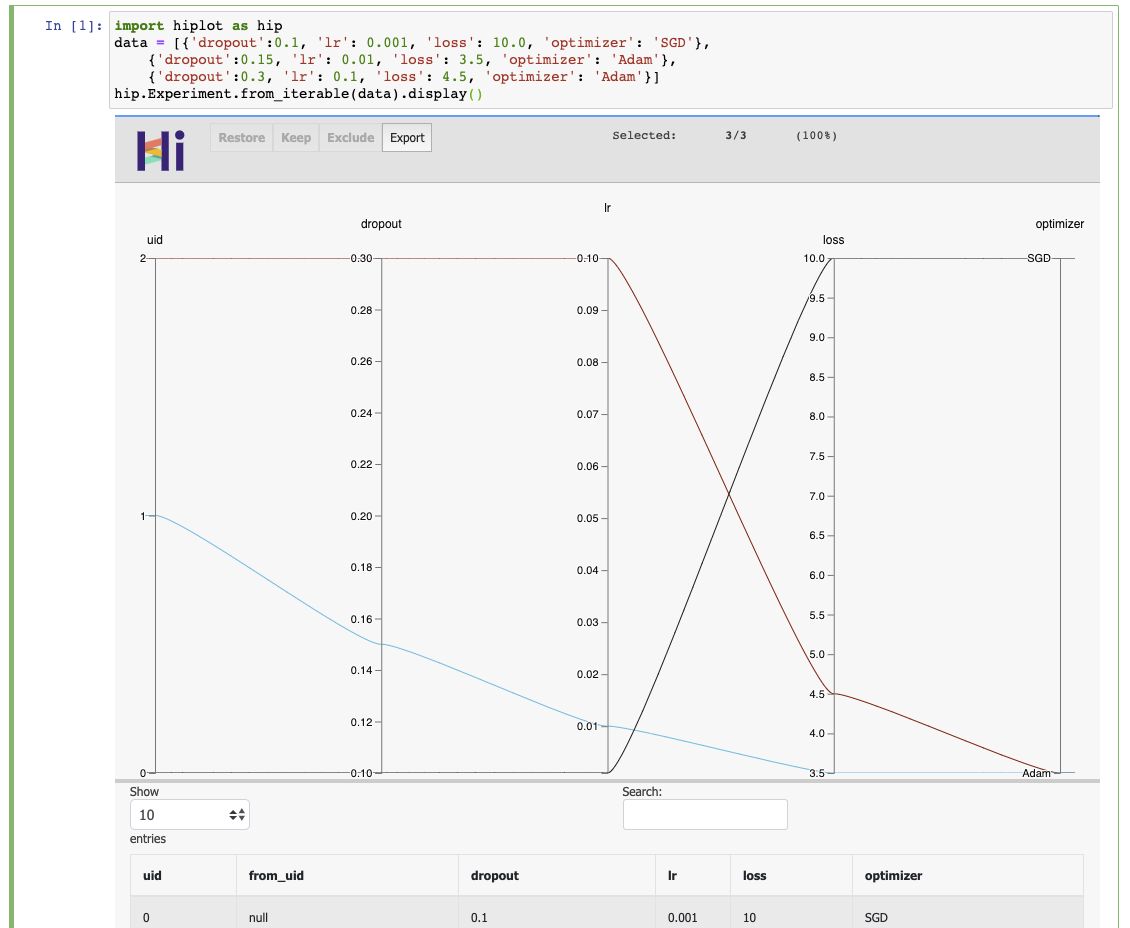
- Blog post: https://ai.facebook.com/blog/hiplot-high-dimensional-interactive-plots-made-easy/
- Documentation: https://facebookresearch.github.io/hiplot/index.html
- Pypi package: https://pypi.org/project/hiplot/
- Conda package: https://anaconda.org/conda-forge/hiplot
- NPM package: https://www.npmjs.com/package/hiplot
- Examples: https://github.com/facebookresearch/hiplot/tree/main/examples
@misc{hiplot,
    author = {Haziza, D. and Rapin, J. and Synnaeve, G.},
    title = {{Hiplot, interactive high-dimensionality plots}},
    year = {2020},
    publisher = {GitHub},
    journal = {GitHub repository},
    howpublished = {\url{https://github.com/facebookresearch/hiplot}},
}Inspired by and based on code from Kai Chang, Mike Bostock and Jason Davies.
External contributors (please add your name when you submit your first pull request):