binglide
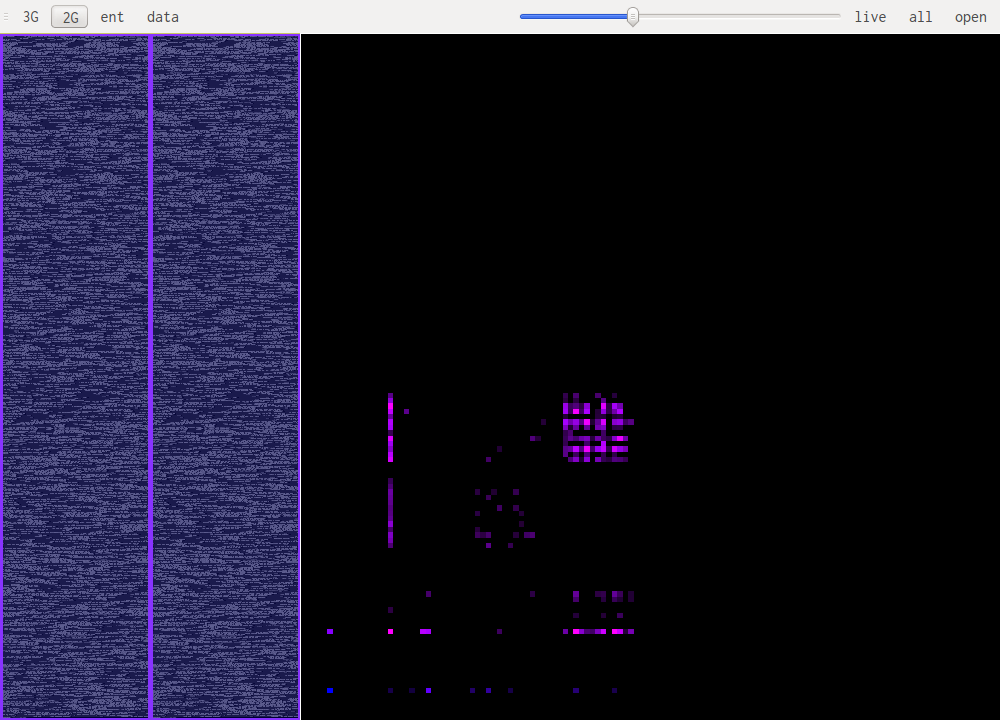
binglide is a visual reverse engineering tool. It is designed to offer a quick overview of the different data types that are present in a file. The screenshot bellow shows a small portion of the php5 binary that has a weird signature pattern:

This tool does not know about any particular file format, everything is done using the same analysis working on the data. This means it works even if headers are missing or corrupted or if the file format is unknown.
Requirements
- PyQt4
- pyqtgraph
- numpy
- numba
Installation
binglide uses python3, be careful to install packages for that version of python.
This guide is for Linux distributions using the apt packet-manager, it shouldn't be hard to extrapolate what you need for other distributions We just need to get all the requirements working and then setup binglide using setup.py.
The basic libraries used by binglide are numpy and pyqtgraph. pyqtgraph needs pyqt4 and pyqt4.opengl, these can't be installed through pip as far as I know.
apt-get install python3-pyqt4 python3-pyqt4.qtopengl
pip3 install pyqtgraph numpy

# In the root of the git directory:
python3 setup.py intall
However without the JIT optimisations this will be quite slow, for this the numba library is used. https://github.com/numba/numba
Documentation
binglide has been developed in order to better understand some of the algoritms used by Cantor dust.
GUI Layout
The main windows is split in three zones, the two on the left allow for selection of the part of the file that is being studied. The bigger pane on the right shows the results of the selected algorithm.
Data visualisation (data)
Data visualisation is the most basic of all views, it simply shows each byte as it is in the file, taking its value as a color: 0xff will be very bright, 0x00 will be black.
Entropy visualisation (ent)
This uses a sliding window over the data to compute "local" Shannon entropy. The color represents the entropy, if it is dark then the data doesn't have high entropy, if it gets lighter the entropy increases.
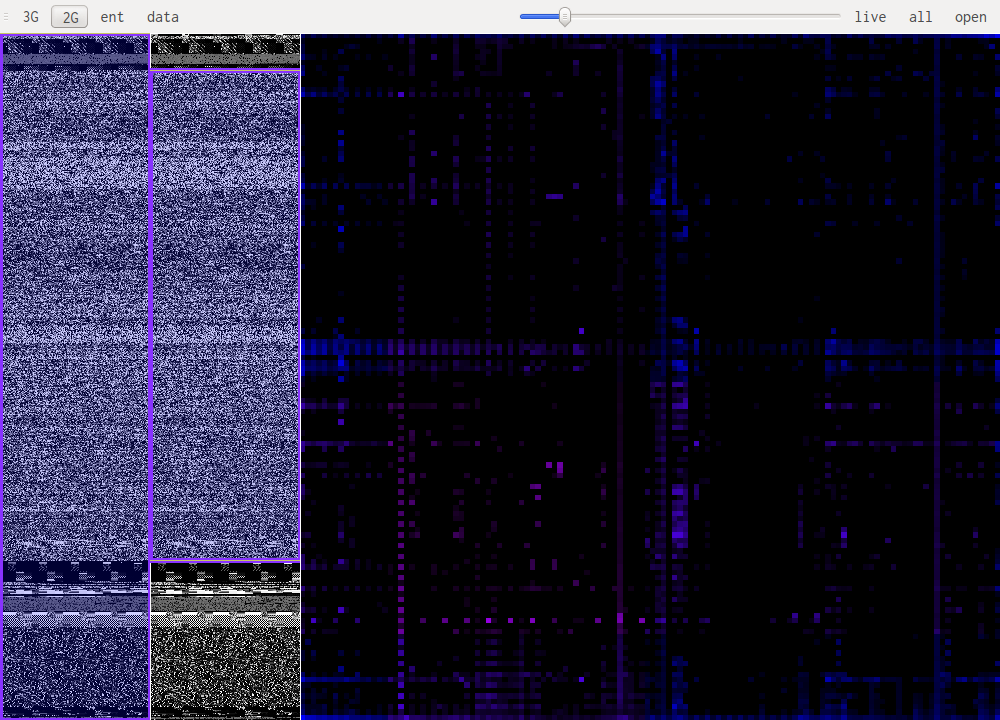
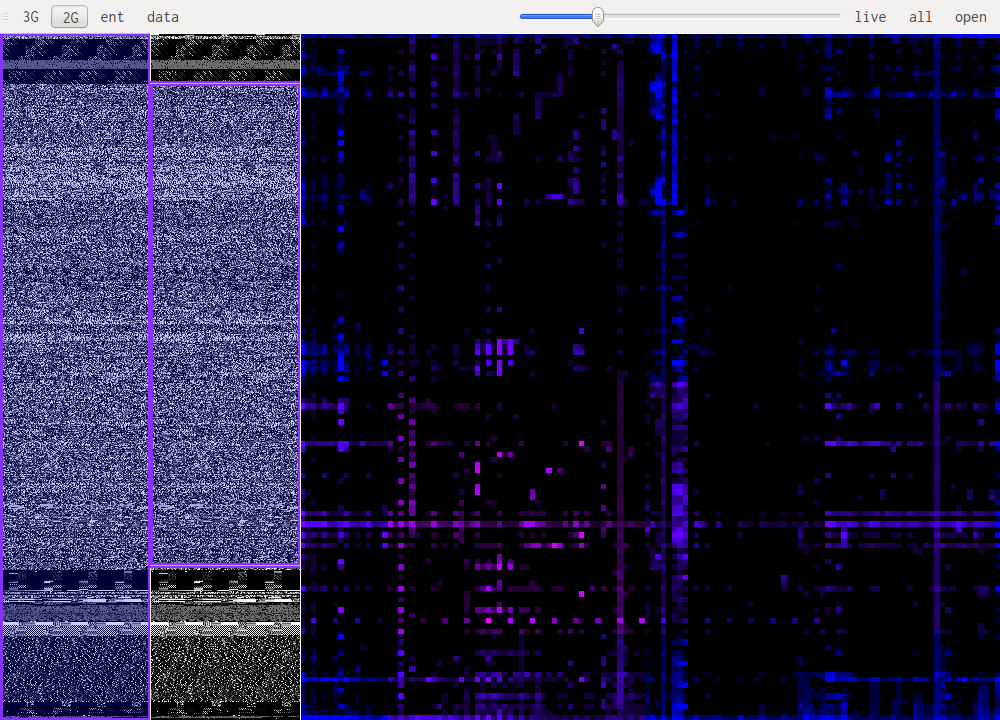
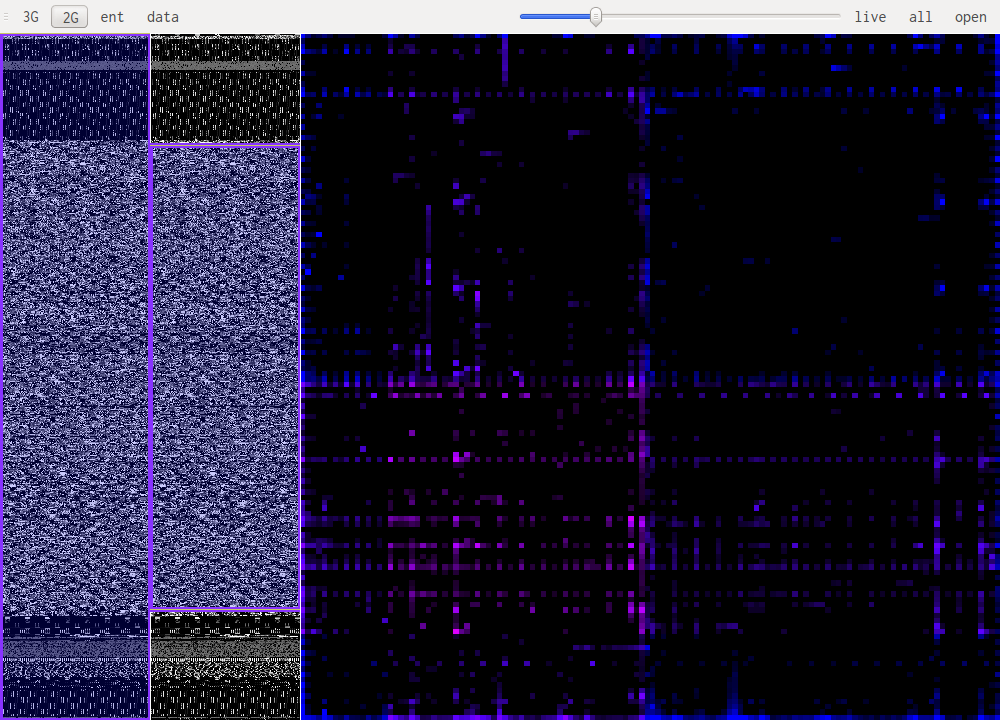
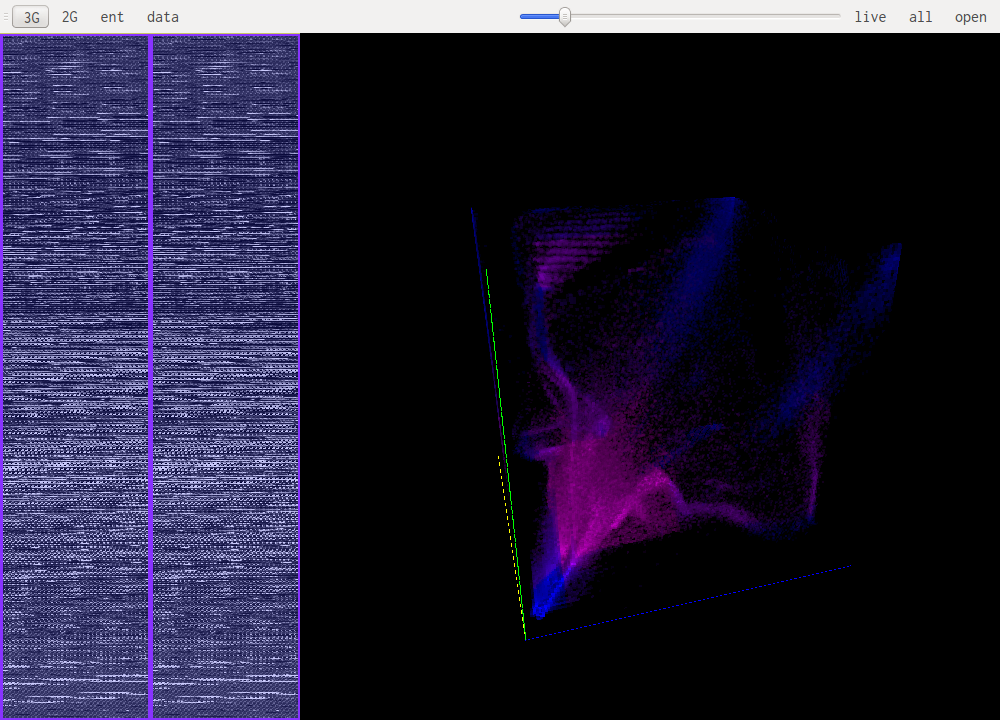
N-Gram visualisation (3G, 2G)
This are the most useful views when it comes to identifying what kind of data one is looking at. The idea is to look at a histogram of bigrams or trigrams in the file. Those are represented in 2D or 3D.
This representation ofers very visual patterns that are diferent enough from one data type to another to be easily recognized once you get used to them.
A data point in one of those views represents how often those bytes are found together. Data in pink is simply the printable ascii range.
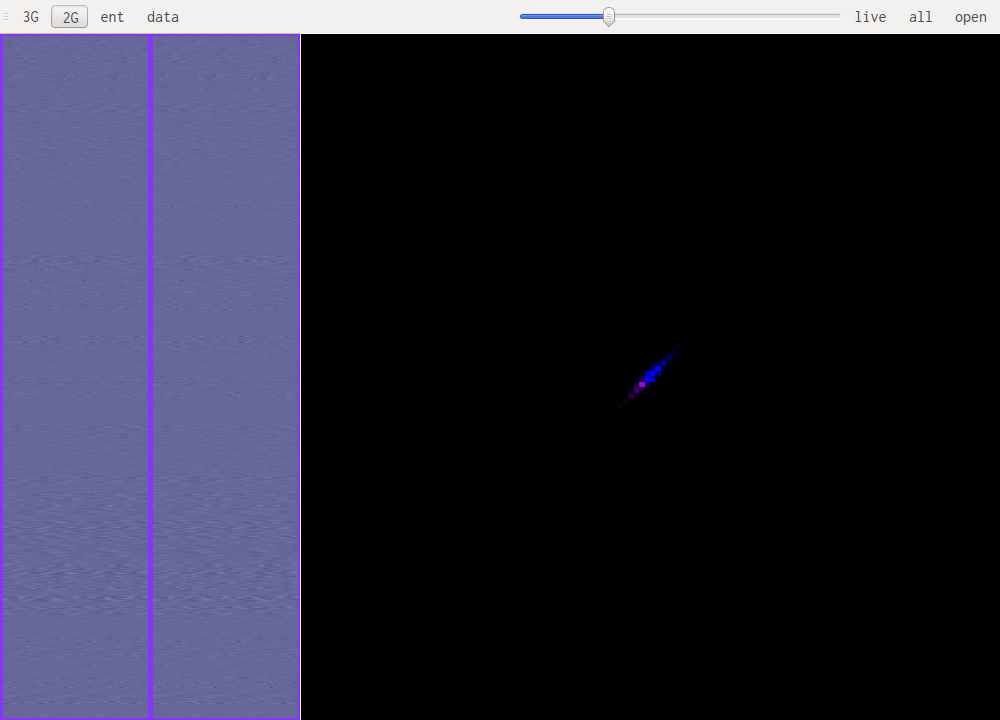
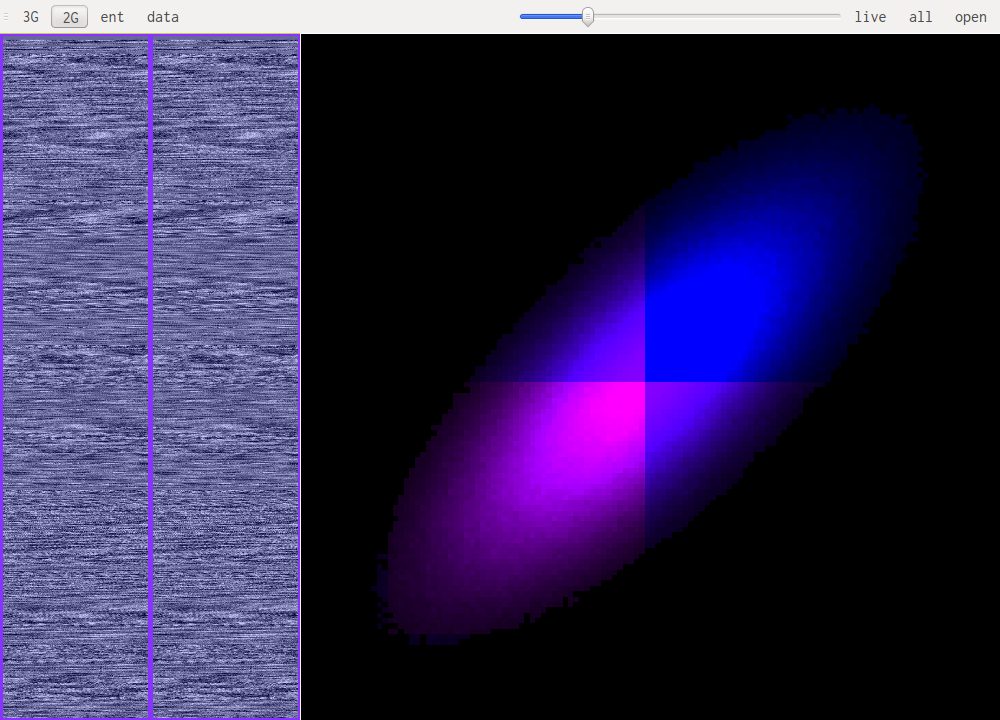
For example this is a 2D representation of the histogram of bigrams in english text:
Notice the square representing the lowercase ascii letters that follow each other. Slightly to the left we see some traces of uppercase followed by lowercase and beneath that another, more subtle, square representing all caps words. The rest is mainly characters followed by spaces or other punctuation.
Sample data types
You can find screenshots of some common data types under the /samples/ directory.
bytecode
Bytecode patterns are usualy very similar even when looking at different architectures. This mean code in an unknown architecture might be recognized as code and at the same time with practise one can identify the architecture. Bellow is i386, x86_64 and powerpc in that order.
images & sound
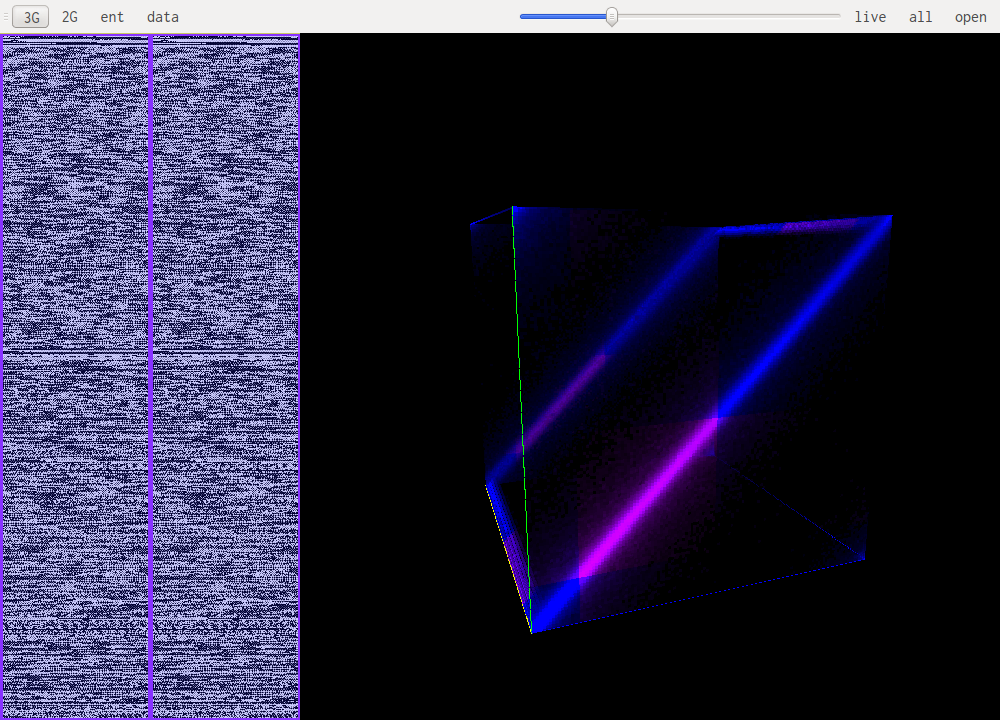
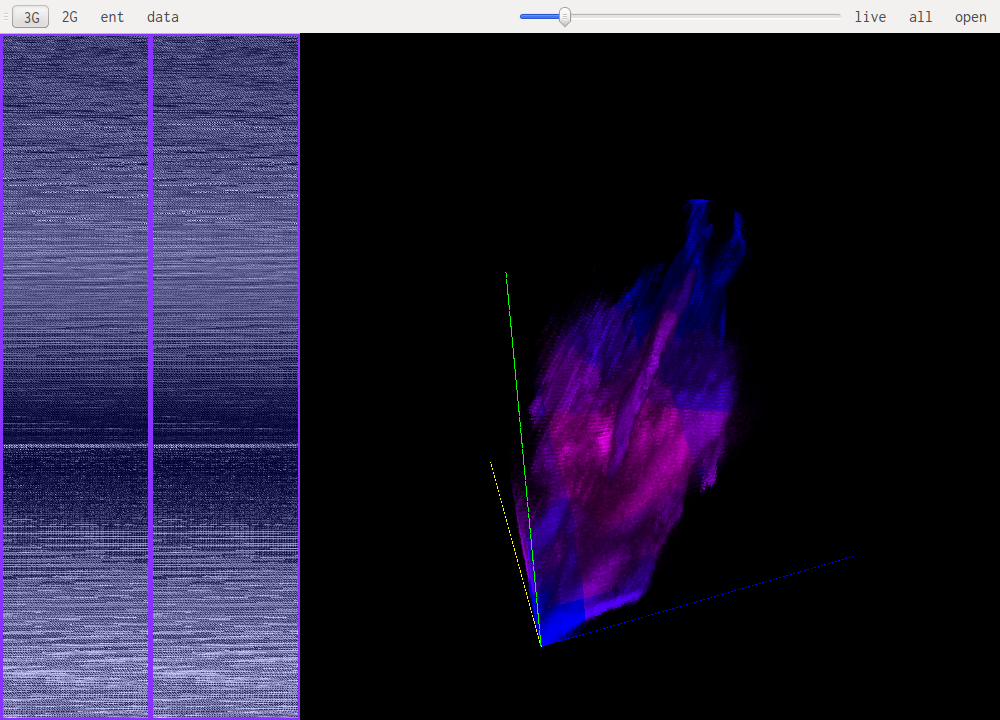
When looking at uncompressed images or sound the patterns are pretty similar. It is mainly a diagonal with some "organic" features, this is because the data doesnt change much from one point in the file to the next. One thing to notice is the number of channels the data is encoded with. Especially in 3D you can notice 3 distinct features when an image is encoded in RGB, these are the RGB, GBR and BRG trigrams. Another caveat is the presence of an (almost) unused channel, this happens with unused alpha channels, or sound encoded on 16bit but with the original data coming from an 8 bit source for example. In those cases one of the channels will almost never change thus projecting the whole histogram on a couple of planes in the 3D view. Here are some samples:
Sound
 This is human speech, notice the very small range of values that are used.
 For reference this is rock music.
 This is the same speech encoded on 16bit. Each high-order byte will be very close to 0xff or 0x00 because of the small amount of values that are actualy used. Each being a signed uint16 close to 0. This is why this pattern emerges.
Images
Images have the same diagonal shape but are much more organic.
Compressed data
Compressed data almost looks like random data, which is expected. But some patterns can still be recognized.
 The screenshot above shows gzip's deflate compression. Notice the lines going diagonaly through the image.
 Those two images show gif and jpeg respectively.

