Coder Social home page Coder Social logo

tidytuesday's Introduction

 #TidyTuesday Contributions 

📢 Portfolio   |   :link: Blog   |   :e-mail: Email   |   :speech_balloon: Twitter   |   :necktie: LinkedIn

My contributions to the #TidyTuesday challenge, a weekly social data project that focusses on understanding how to summarize and arrange data to make meaningful charts with {ggplot2}, {tidyr}, {dplyr} and other tools that are part of the {tidyverse} ecosystem. The project was founded in 2018 by Thomas Mock and organized by the R4DS ("R for Data Science") online learning community. The intent is to provide a safe and supportive forum to practice their wrangling and data visualization skills.

Feedback is very welcome via Twitter or mail.

Contributions in chronological order (click to expand)

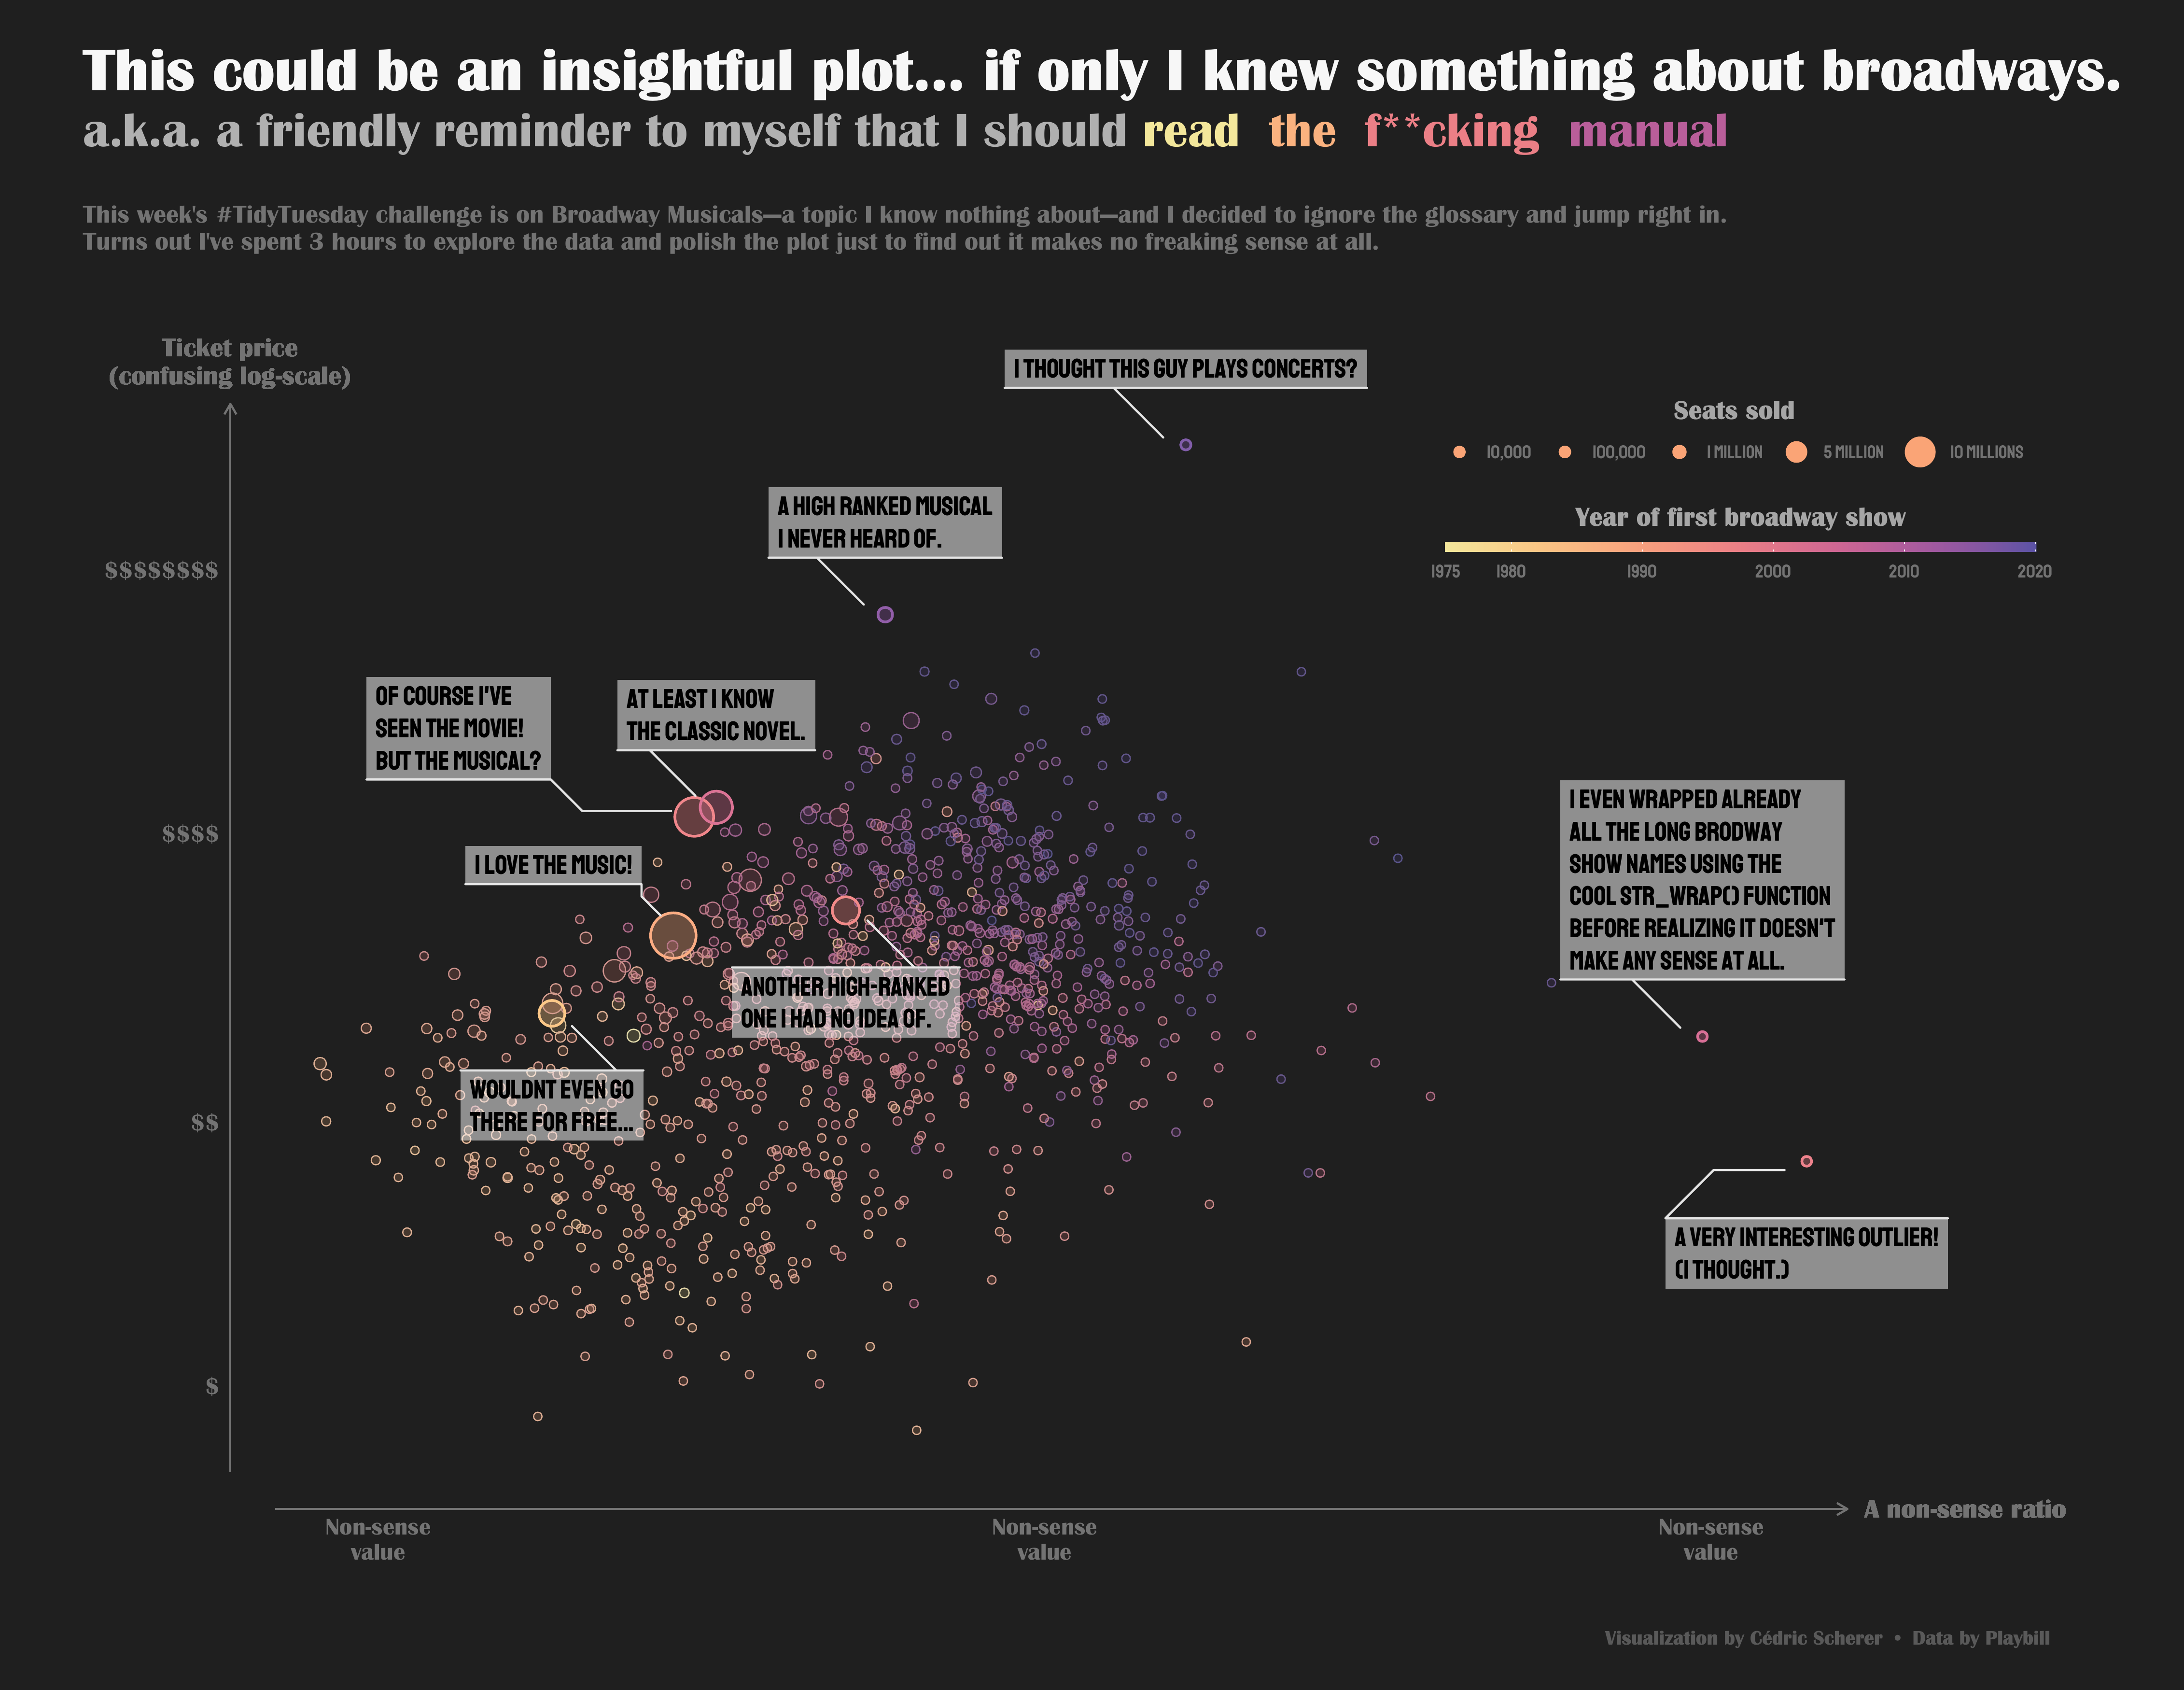
2020/18 🎭️ Broadway Musicals (RTFM Edition) by Playbill

./plots/2020_18/2020_18_BroadwayMusicals.png


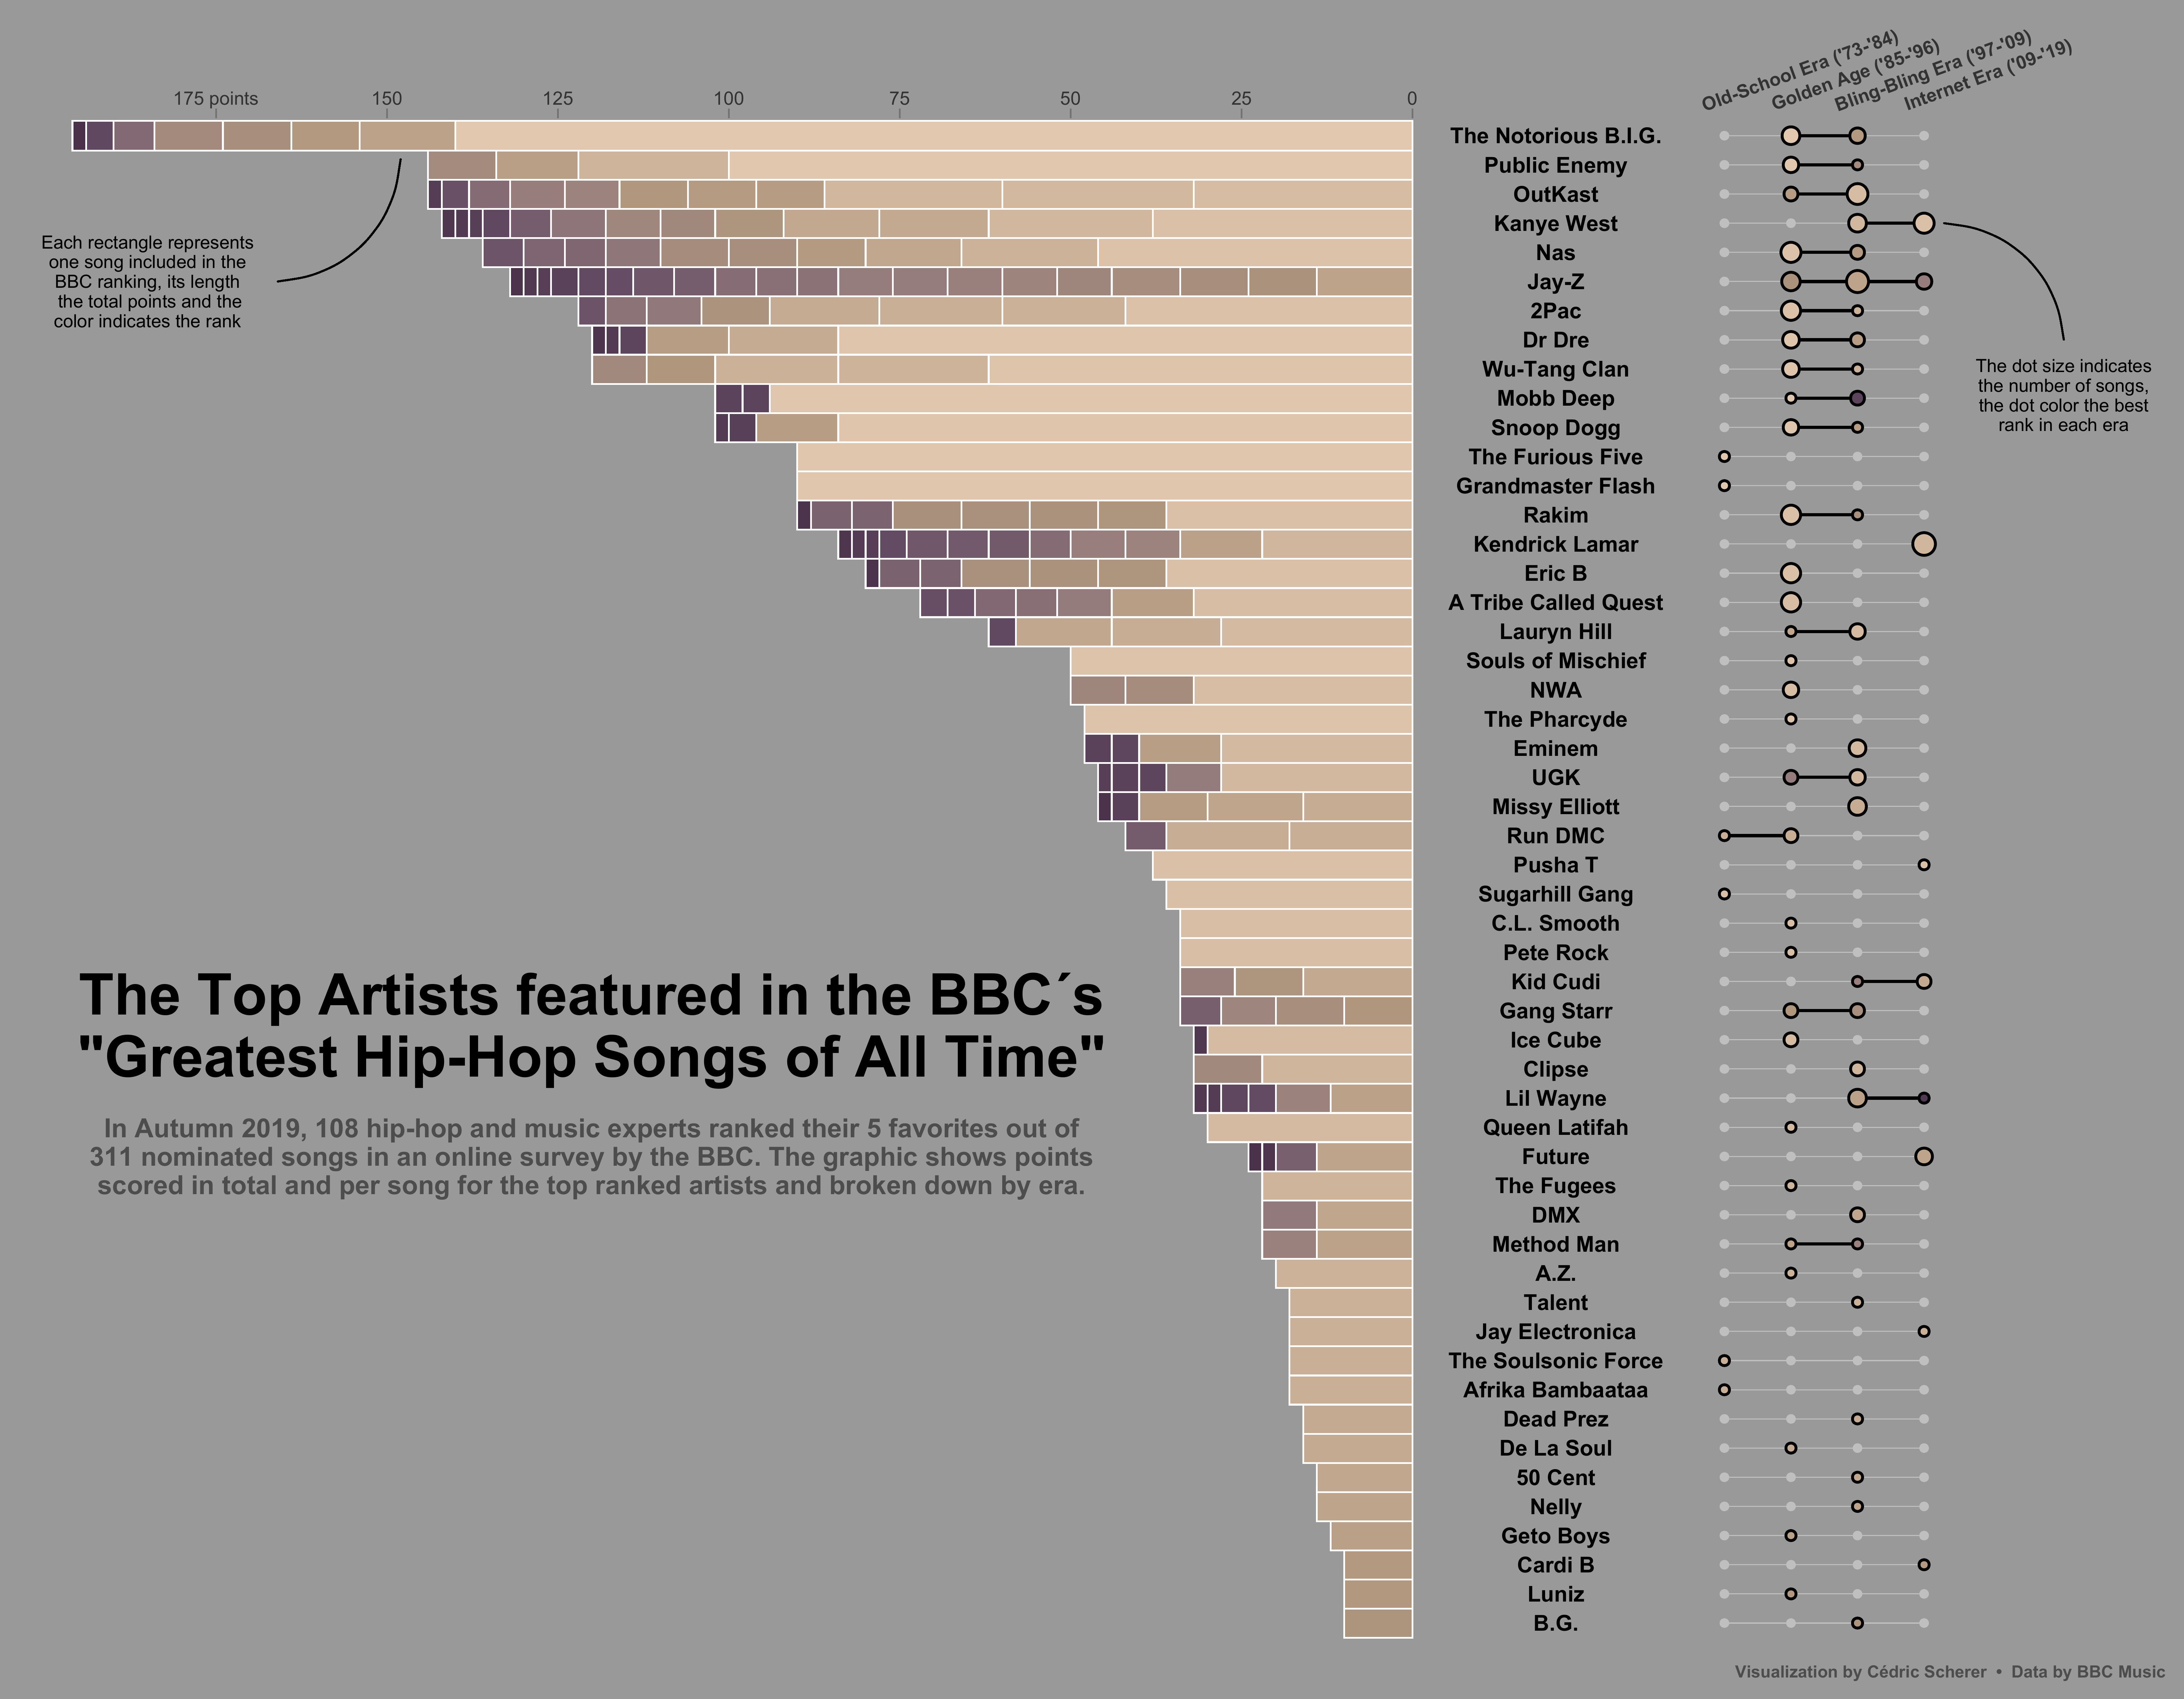
2020/16 🎙️ Best Hip-Hop Songs of All Time by BBC Music

./plots/2020_16/2020_16_BestRapArtists.png


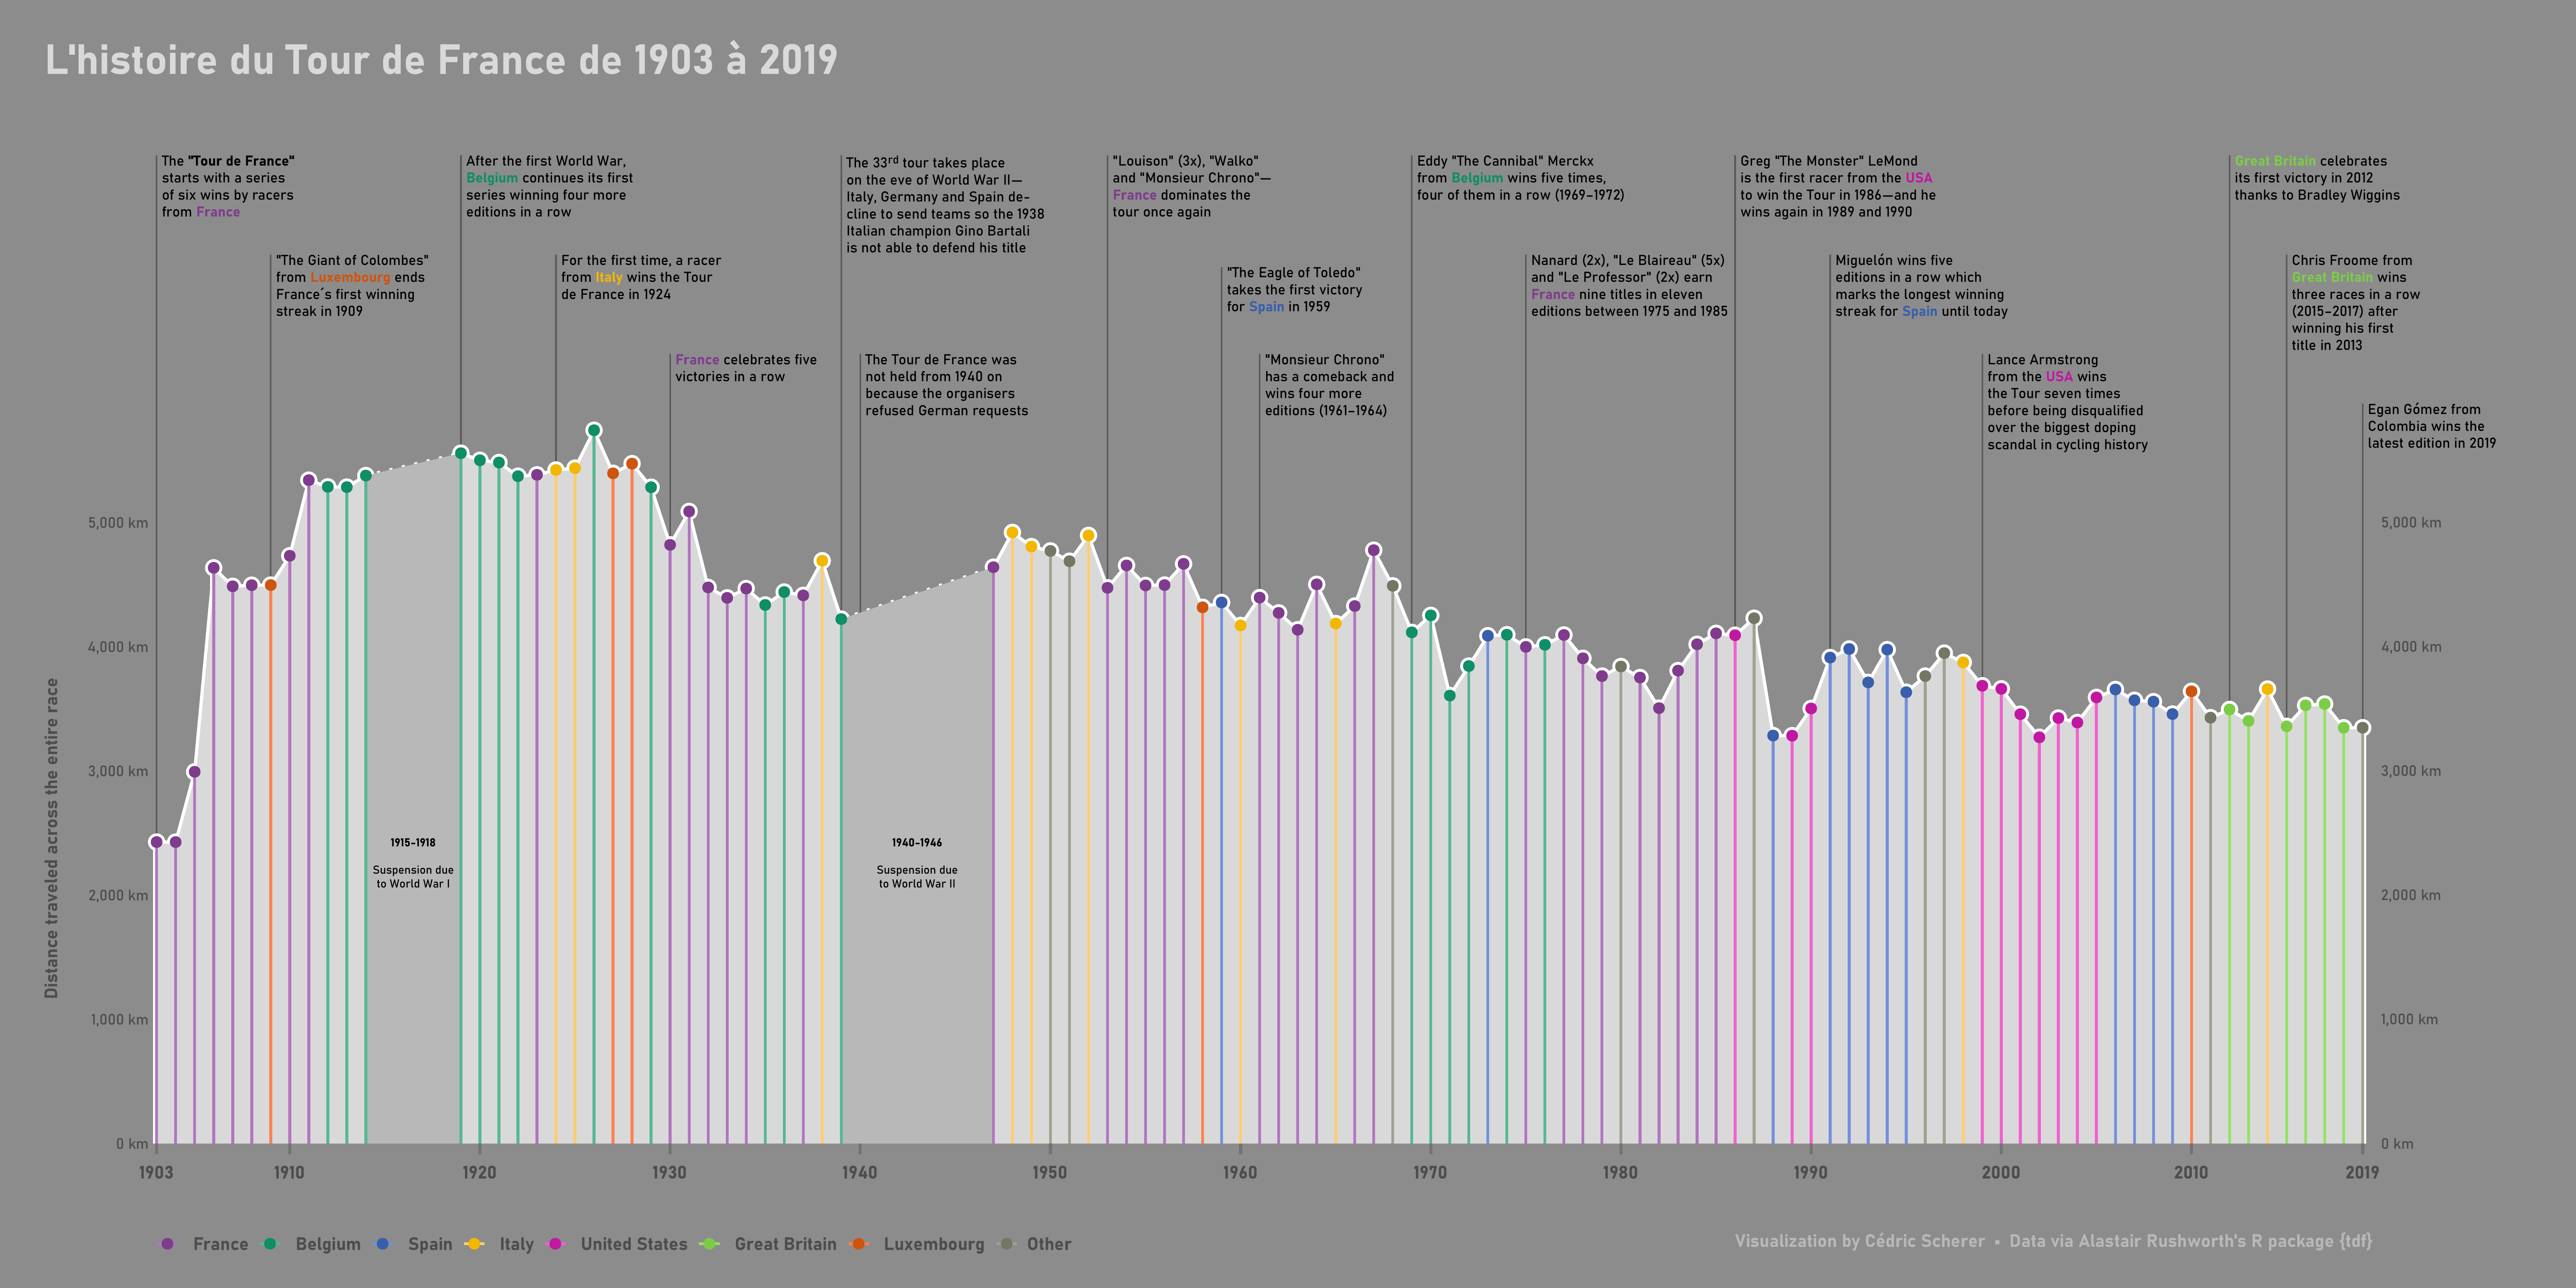
Week 2020/15 🚵 Tour de France via the {tdf} data package

./plots/2020_15/2020_15_TourDeFrance.png


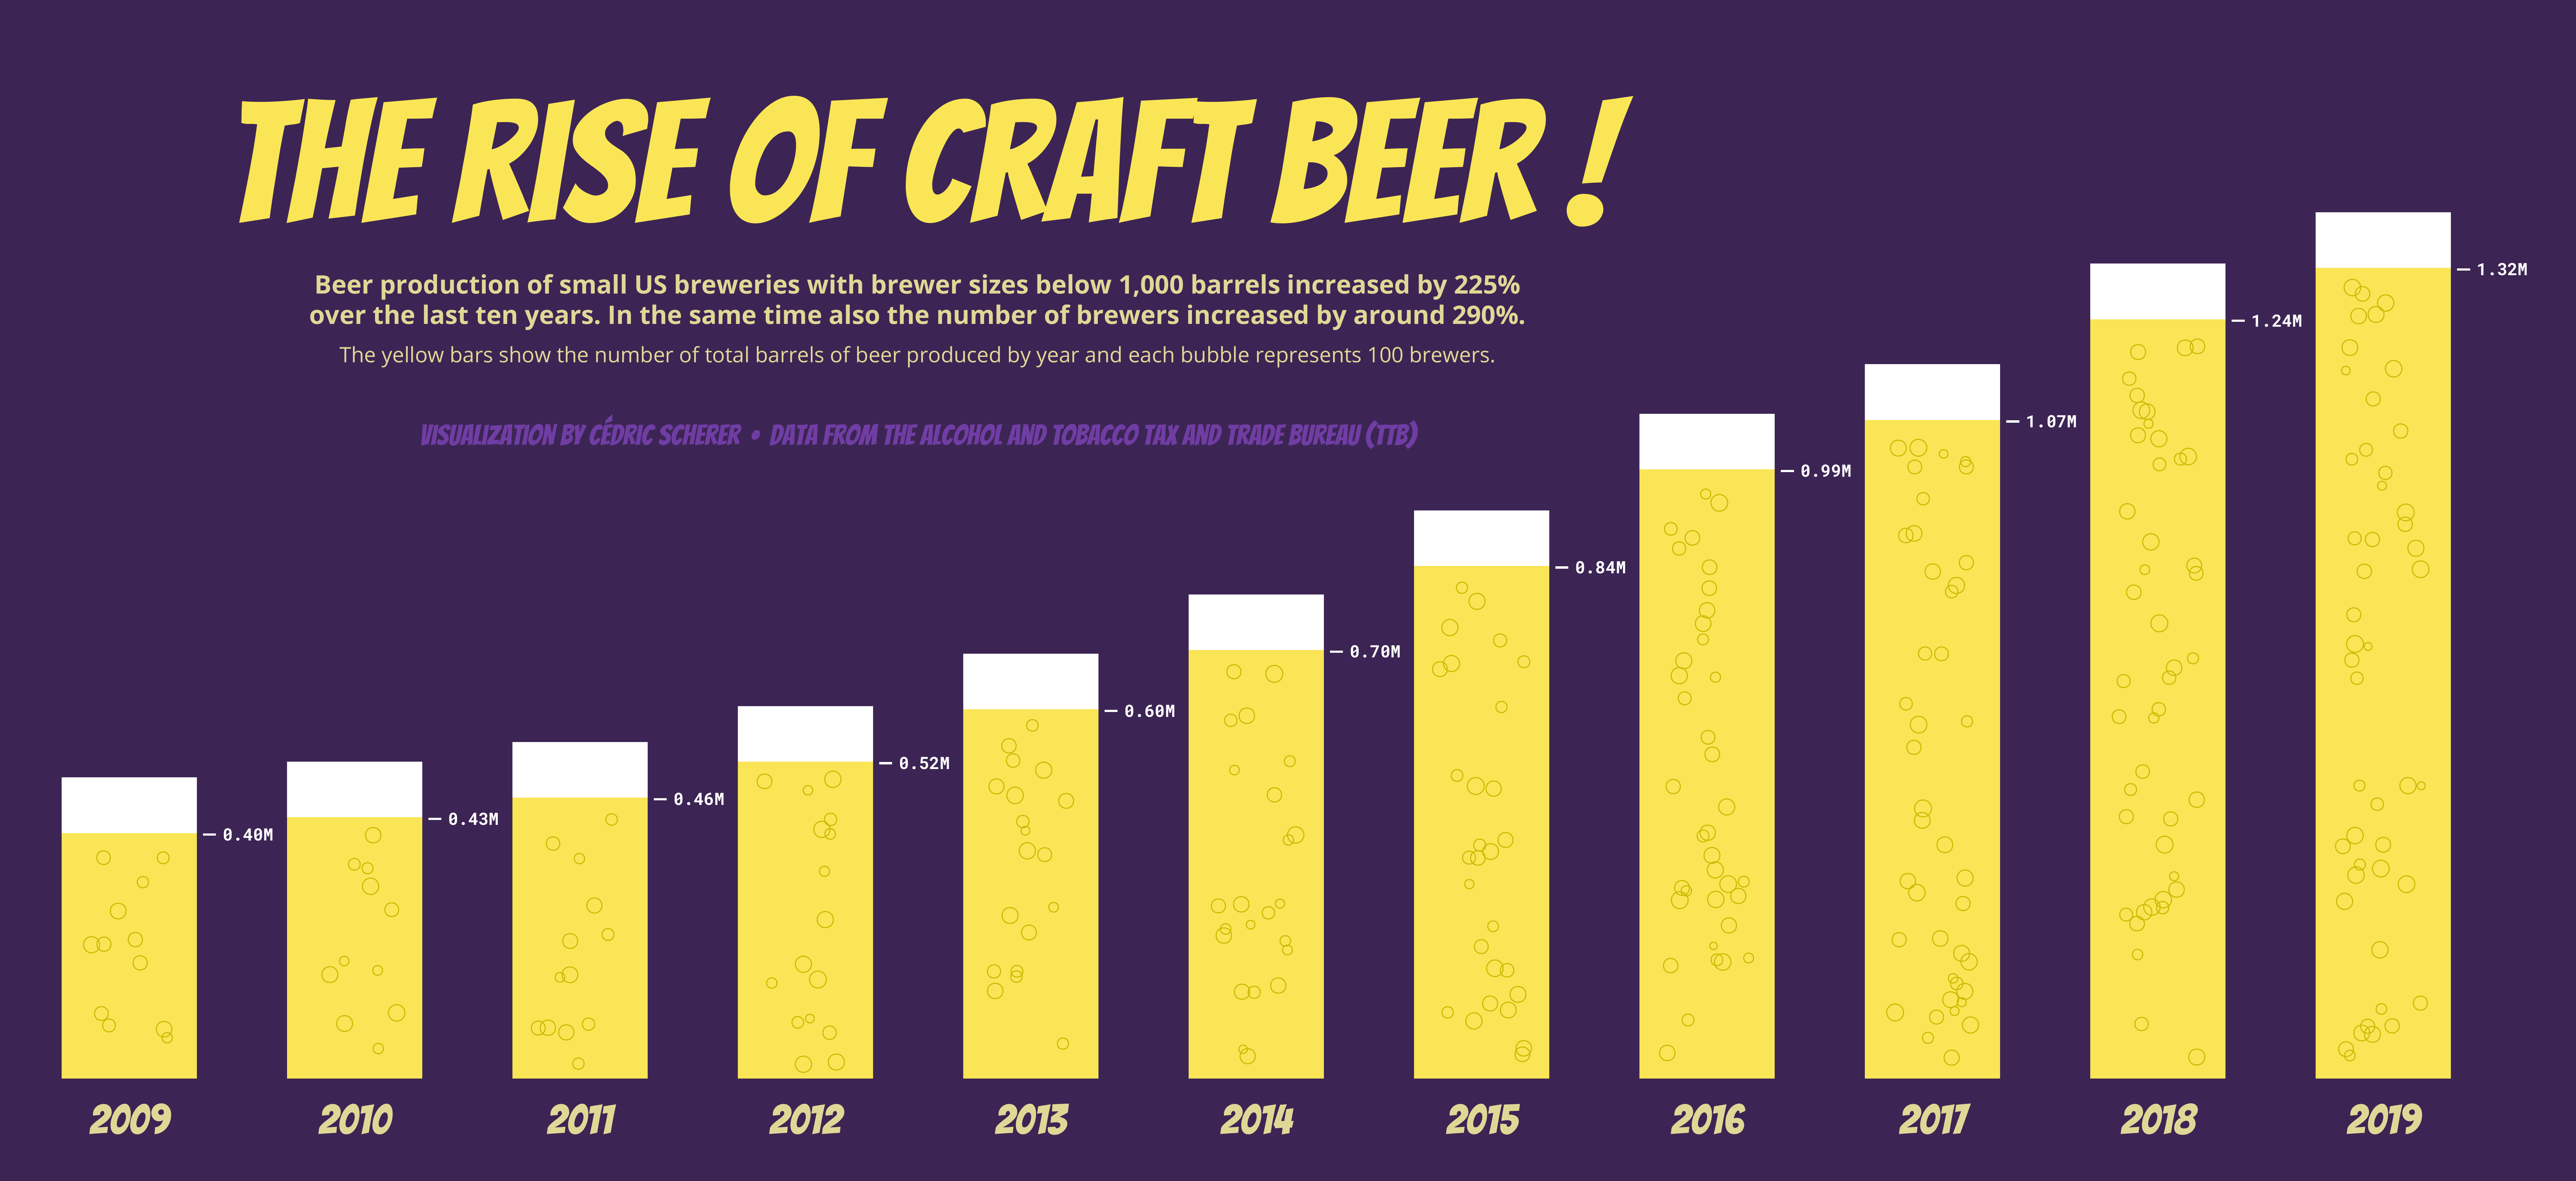
Week 2020/14 🍺 Beer Production by TTB

./plots/2020_14/2020_14_BeerProduction_red.png


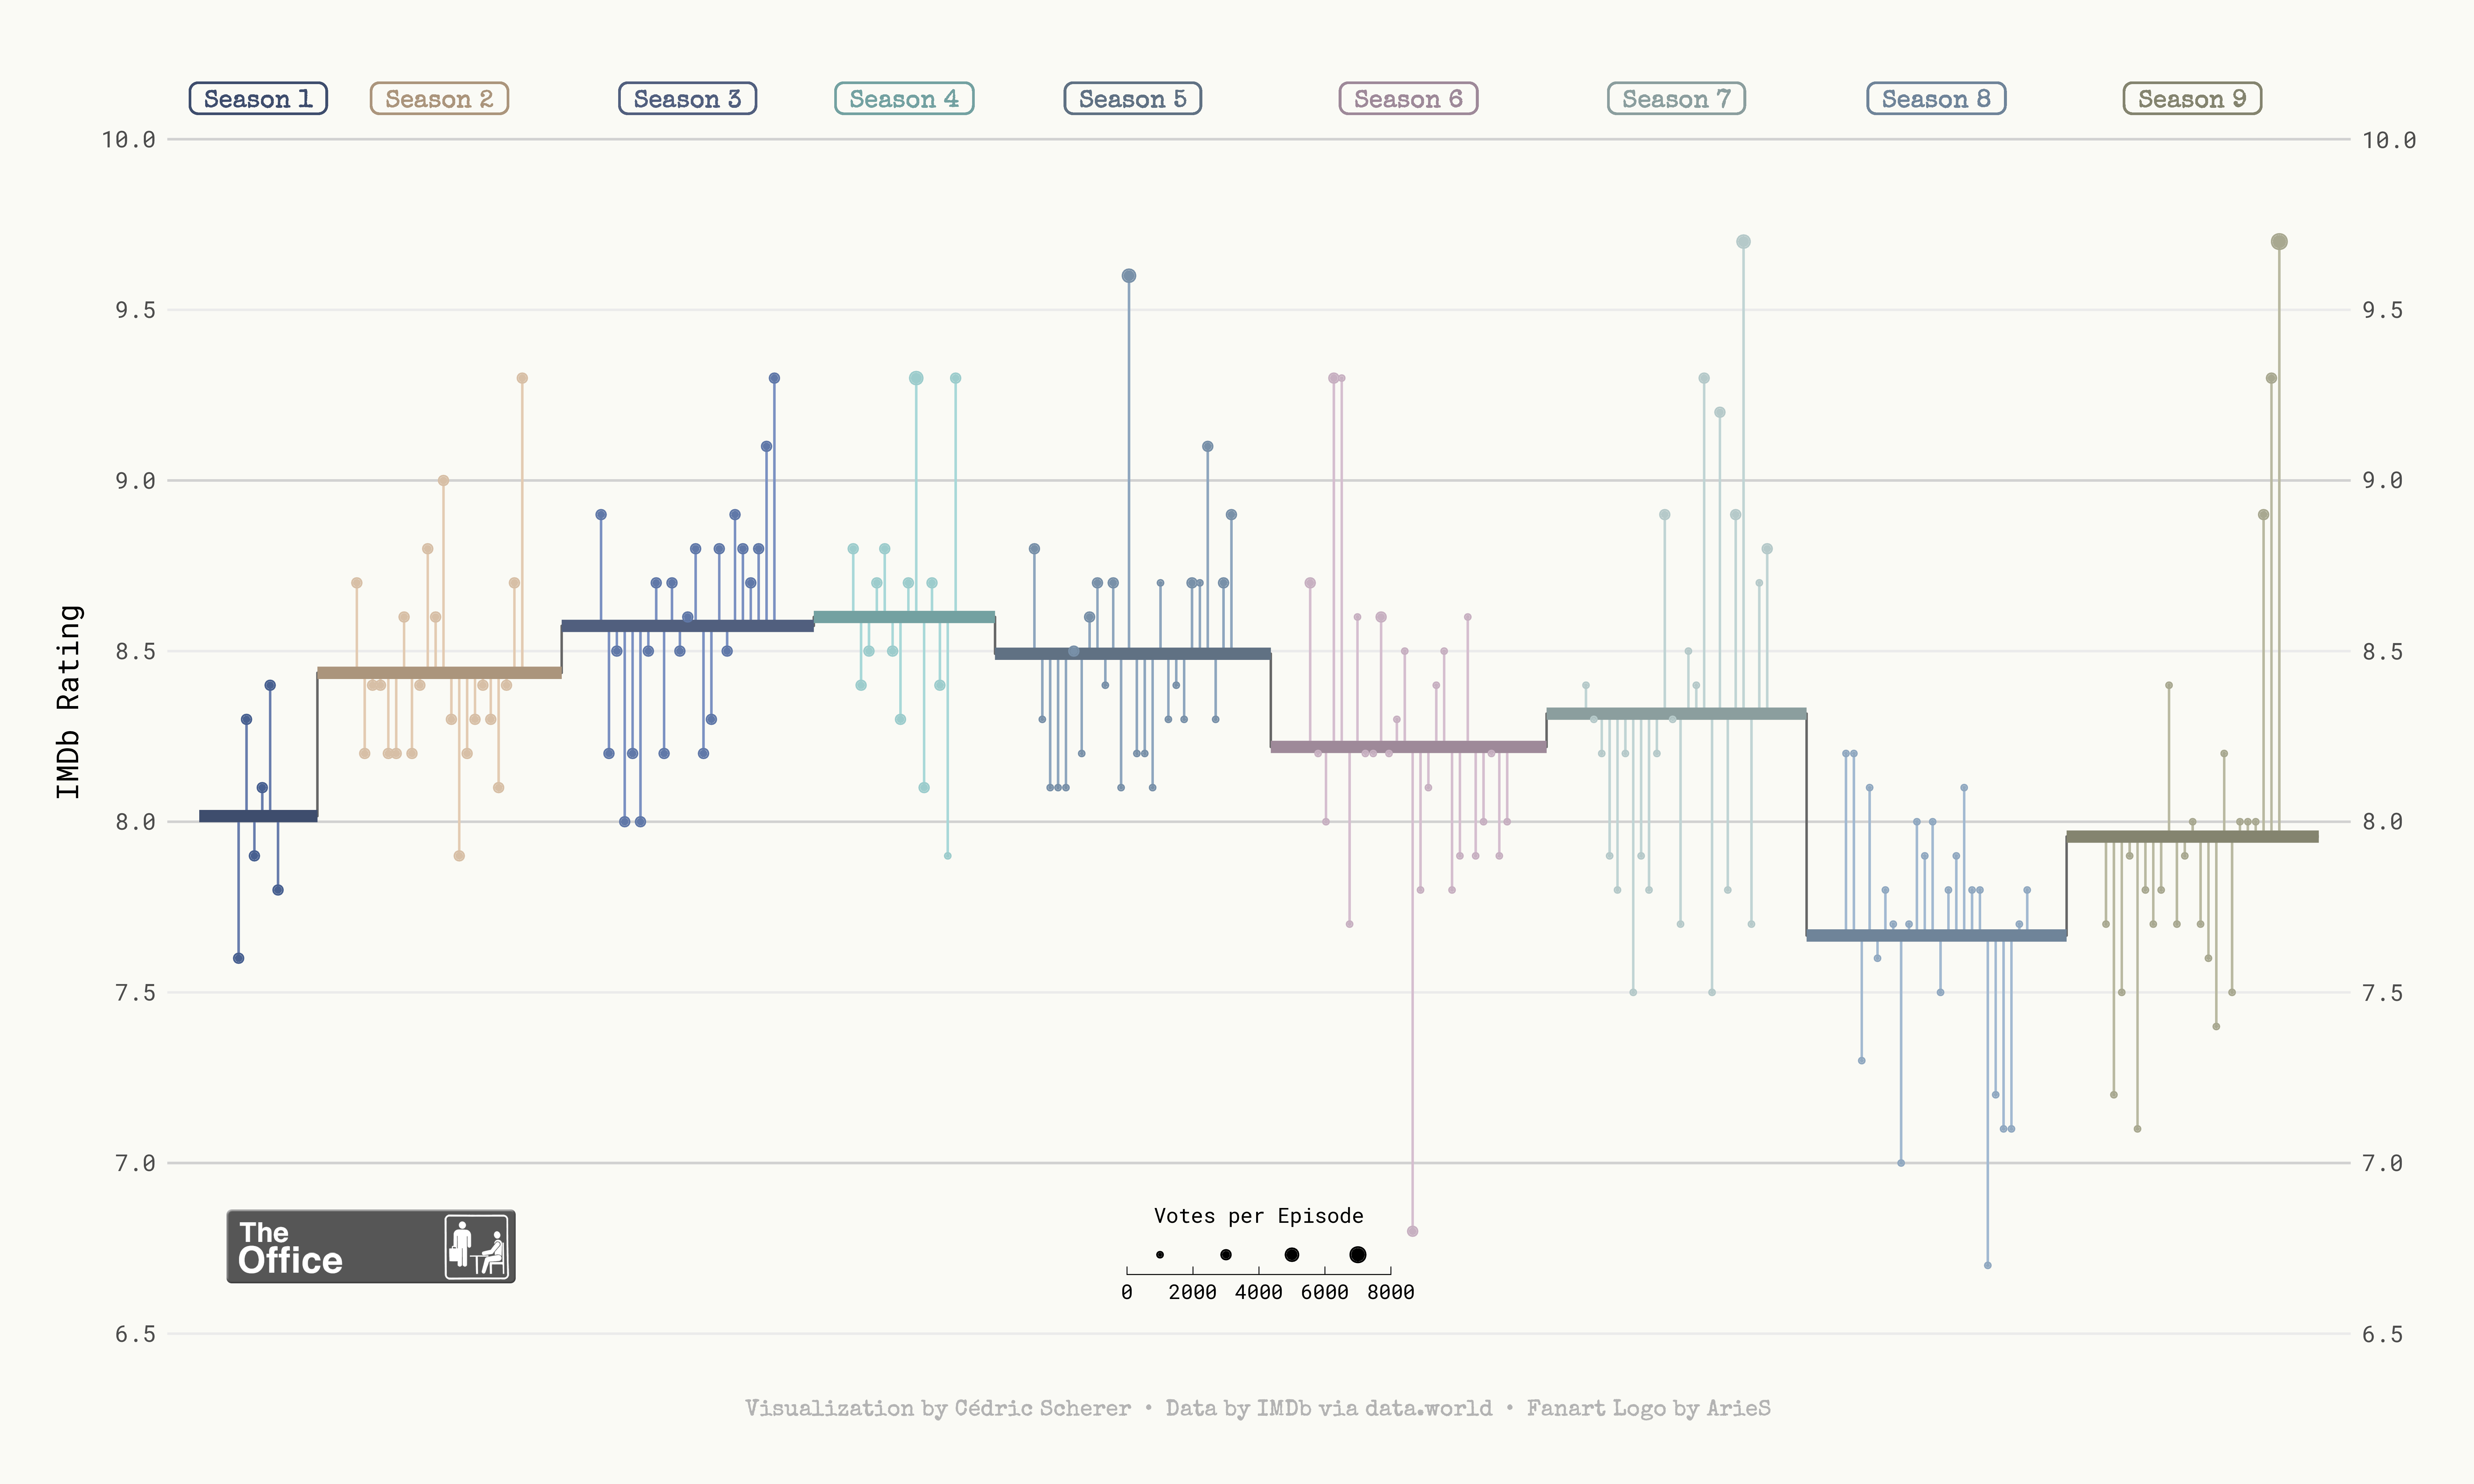
./plots/2020_08/2020_12_TheOffice.png


Week 2020/08 🍖 Foot Carbon Footprints by FAO via nu3

./plots/2020_08/2020_08_CarbonFoodprint_alt.png


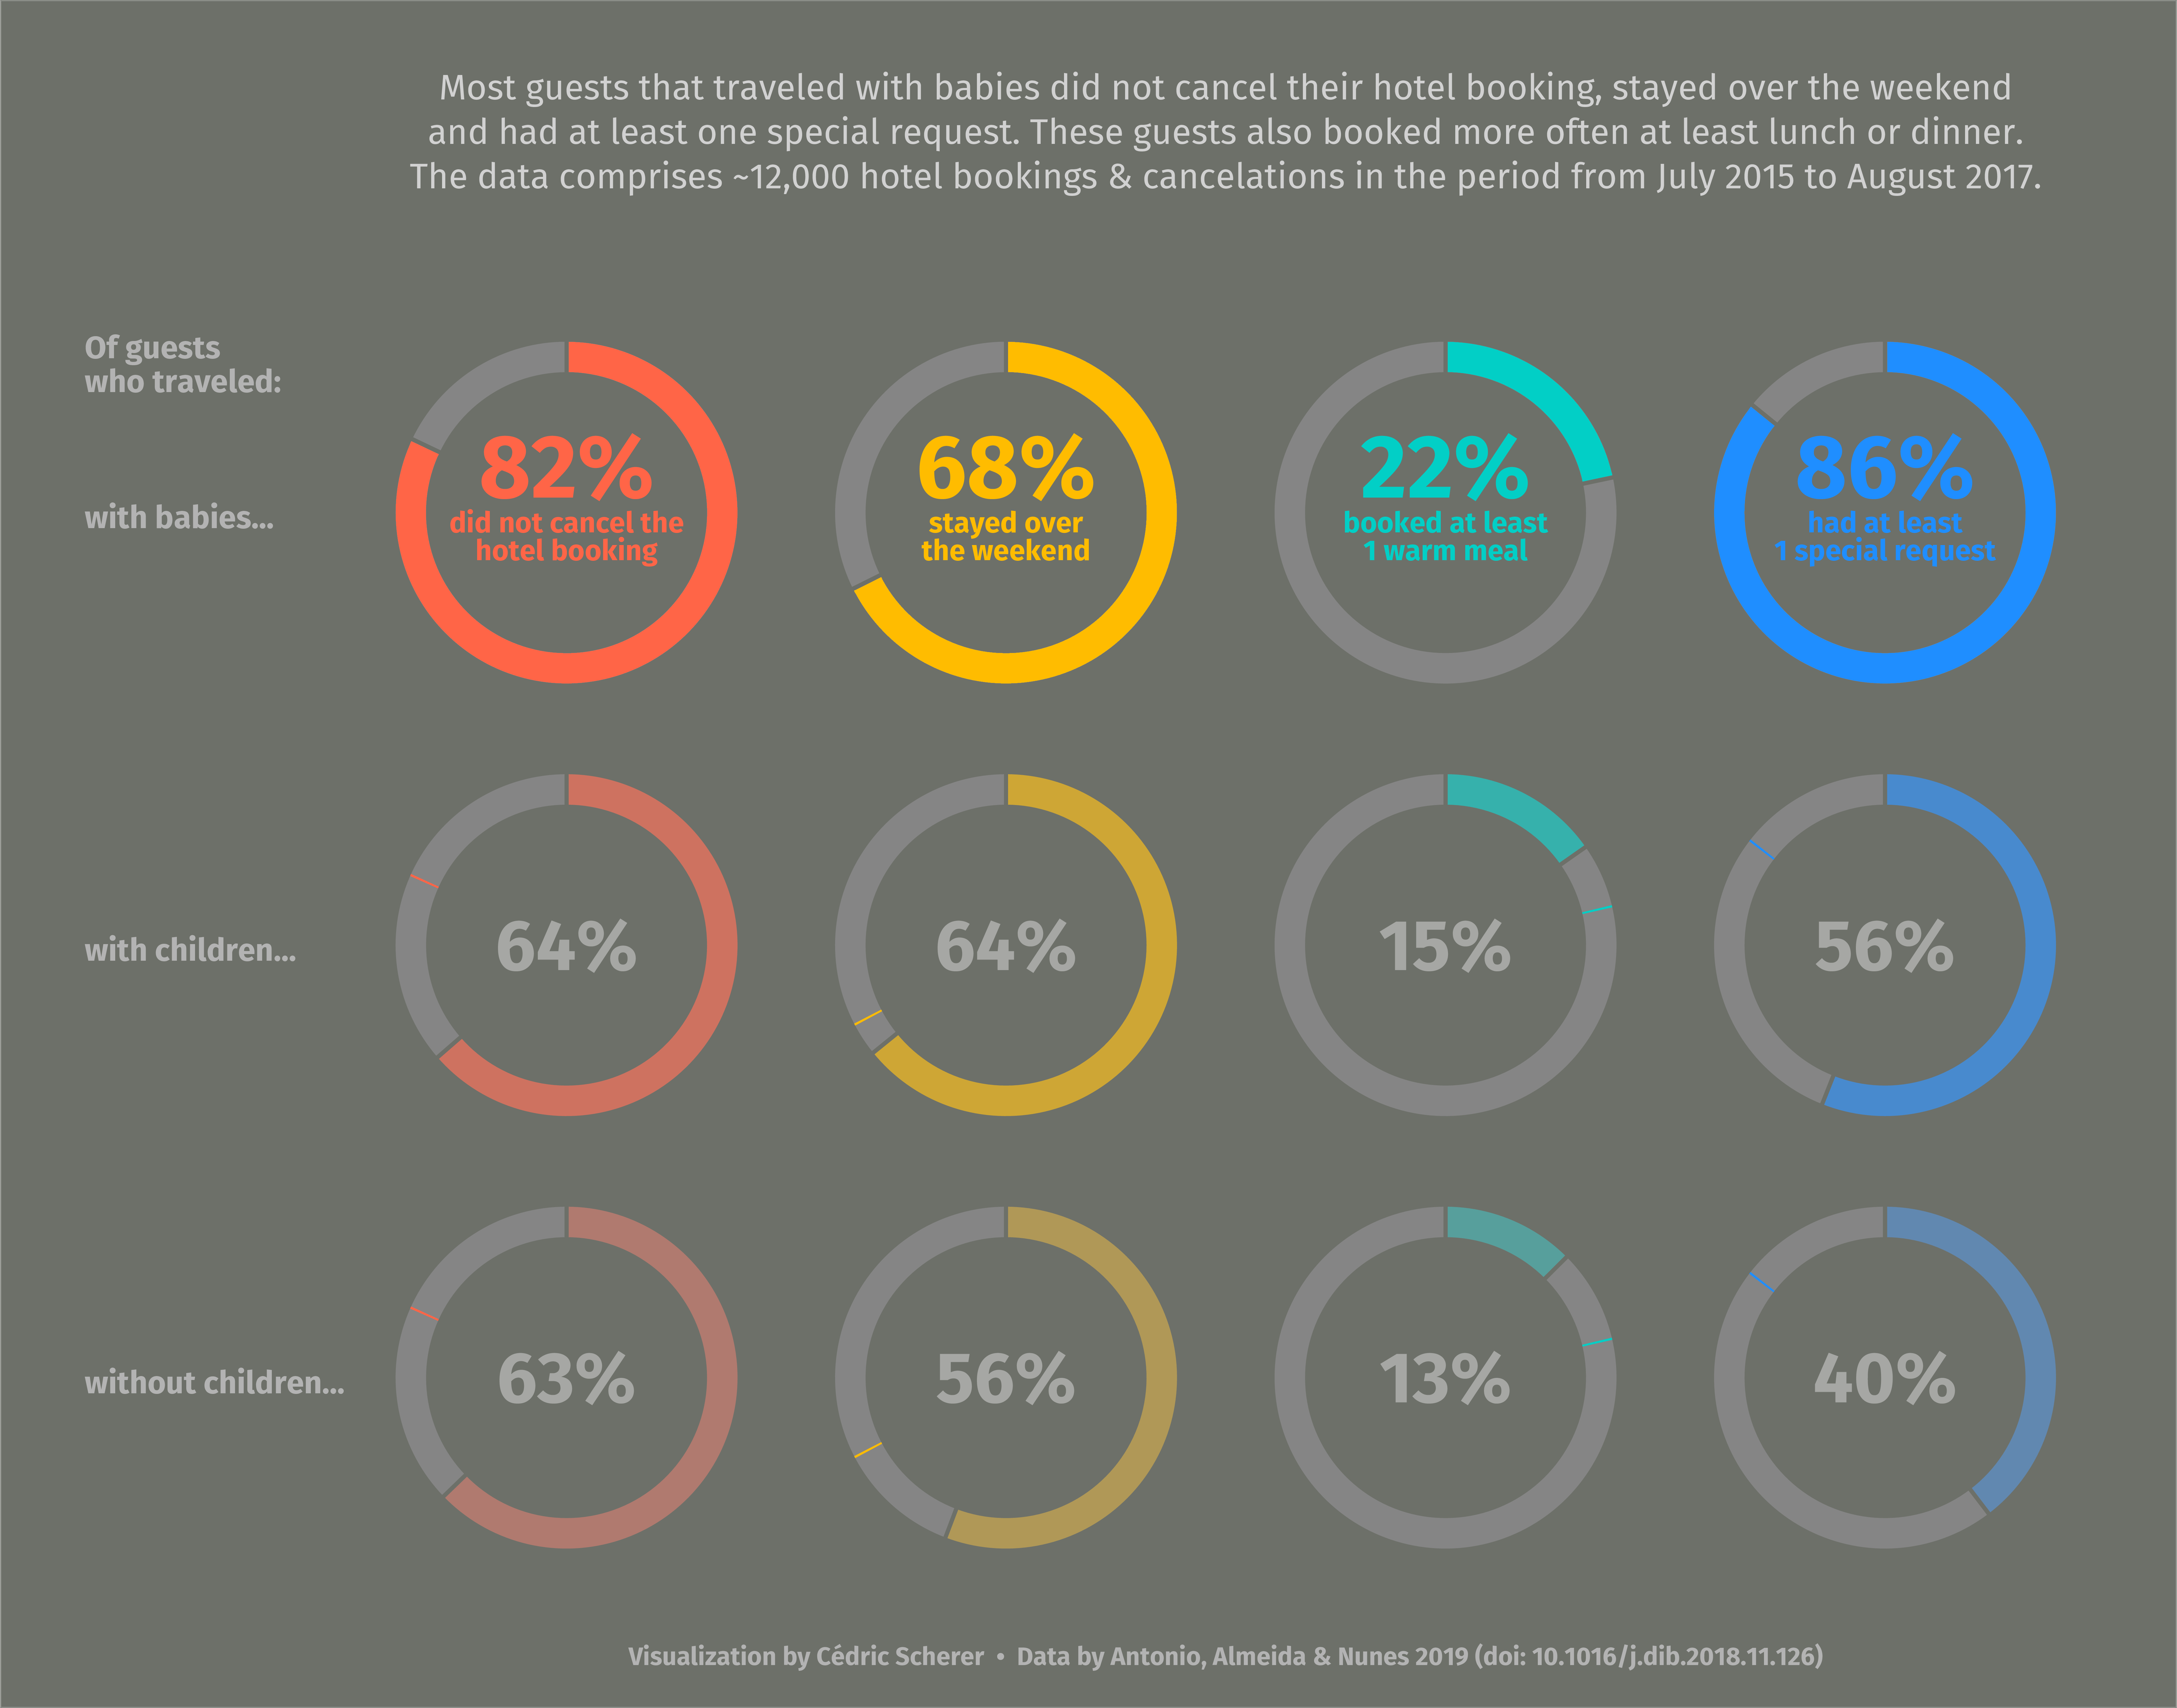
./plots/2020_07/2020_07_HotelBookings.png


Week 2020/05 🌳 San Francisco Trees by data.sfgov.org

./plots/2020_05/2020_05_TreesSF.png


Week 2020/04 🎶 Spotify Songs by Spotify via {spotifyr}

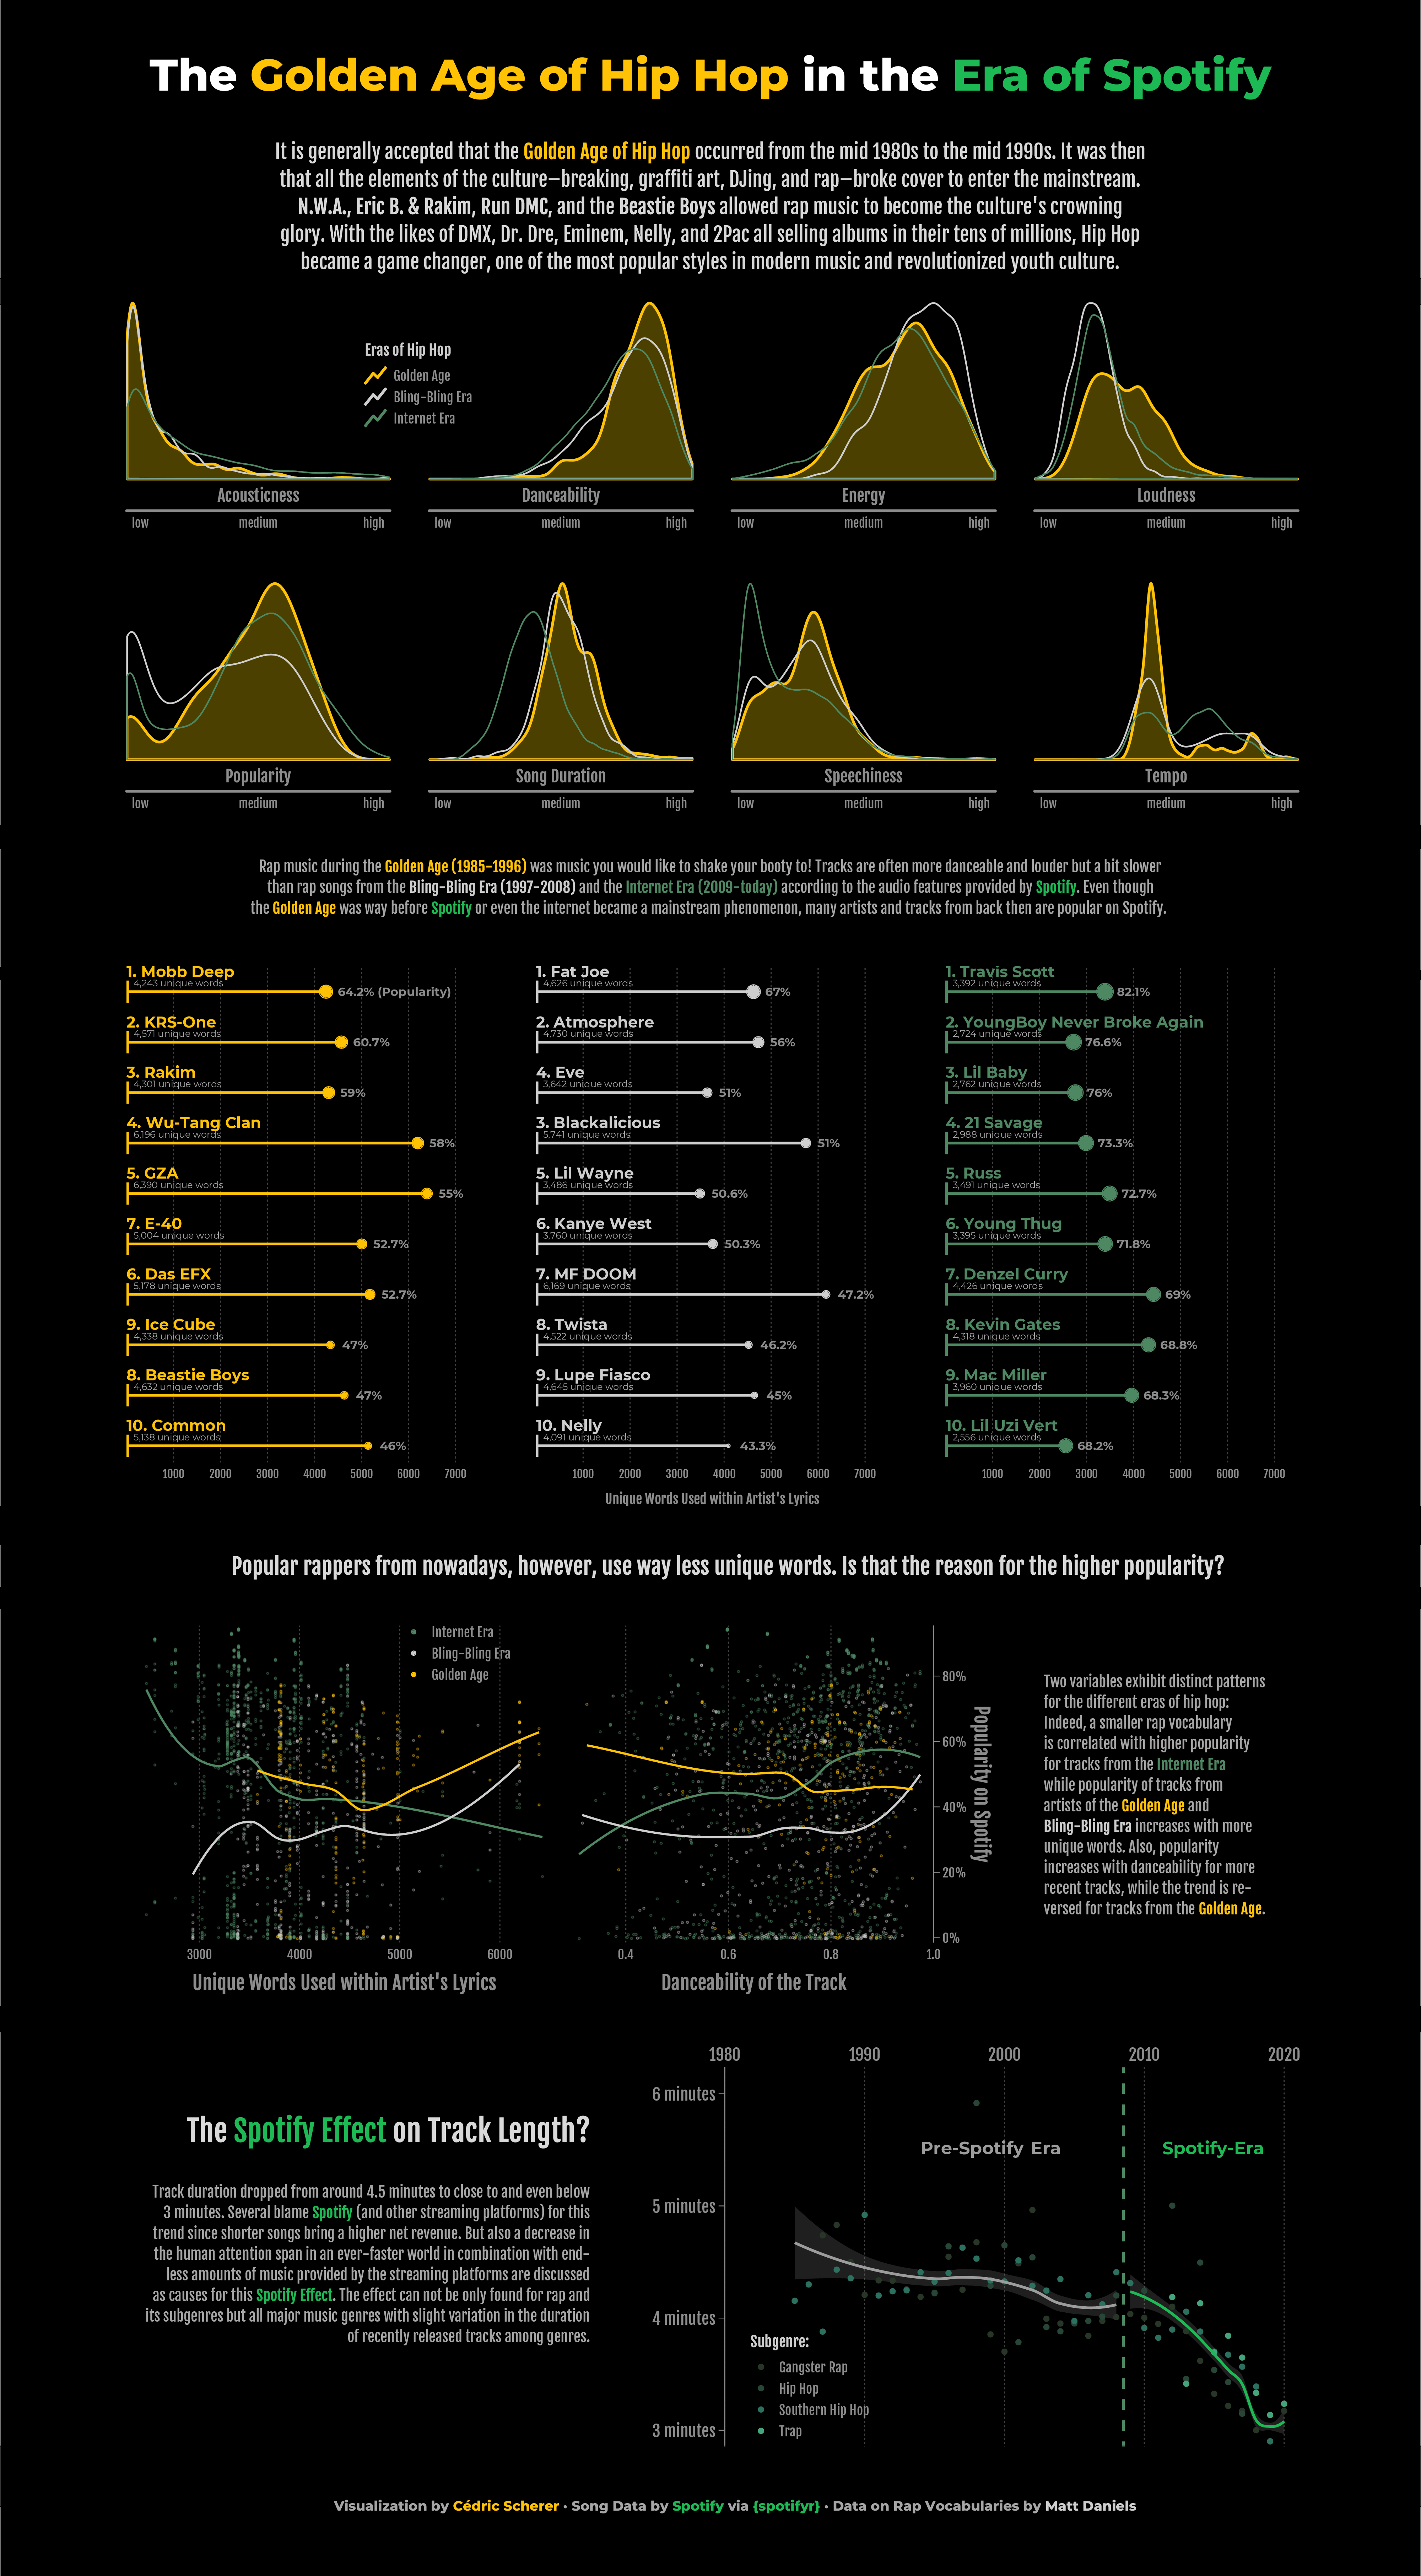
./plots/2020_04/2020_04SpotifySongs.png


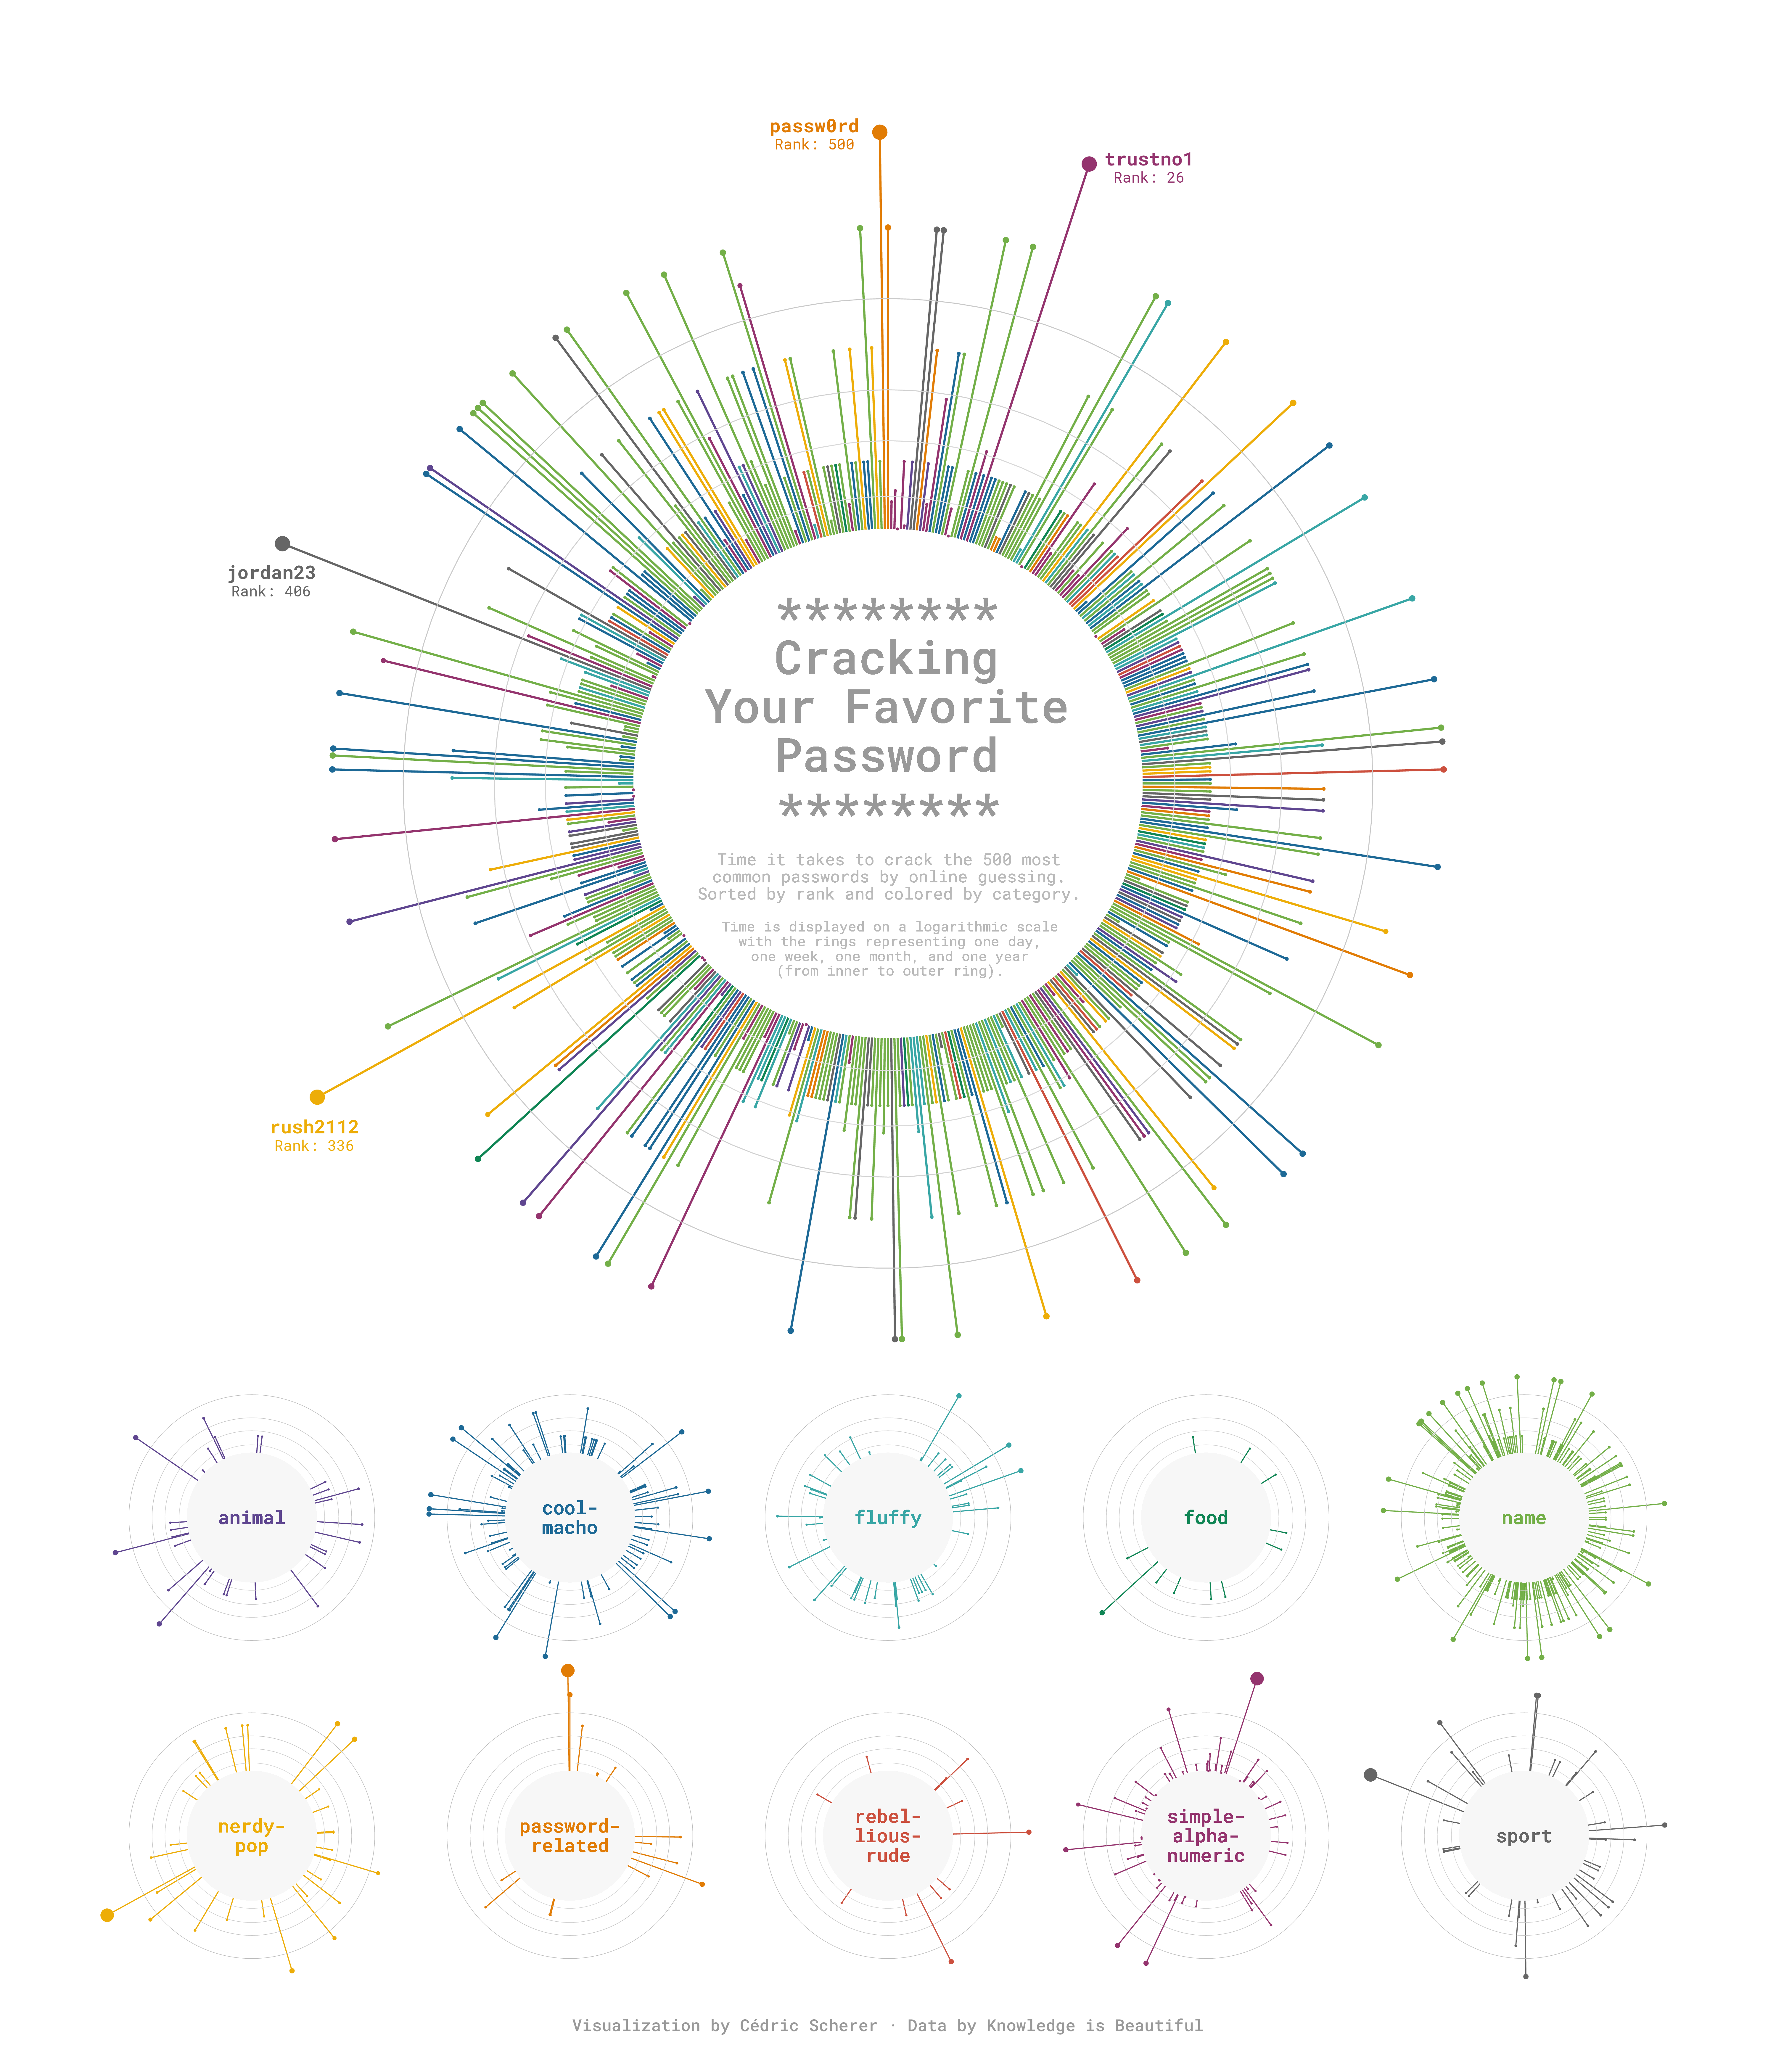
./plots/2020_03/2020_03_Passwords.png


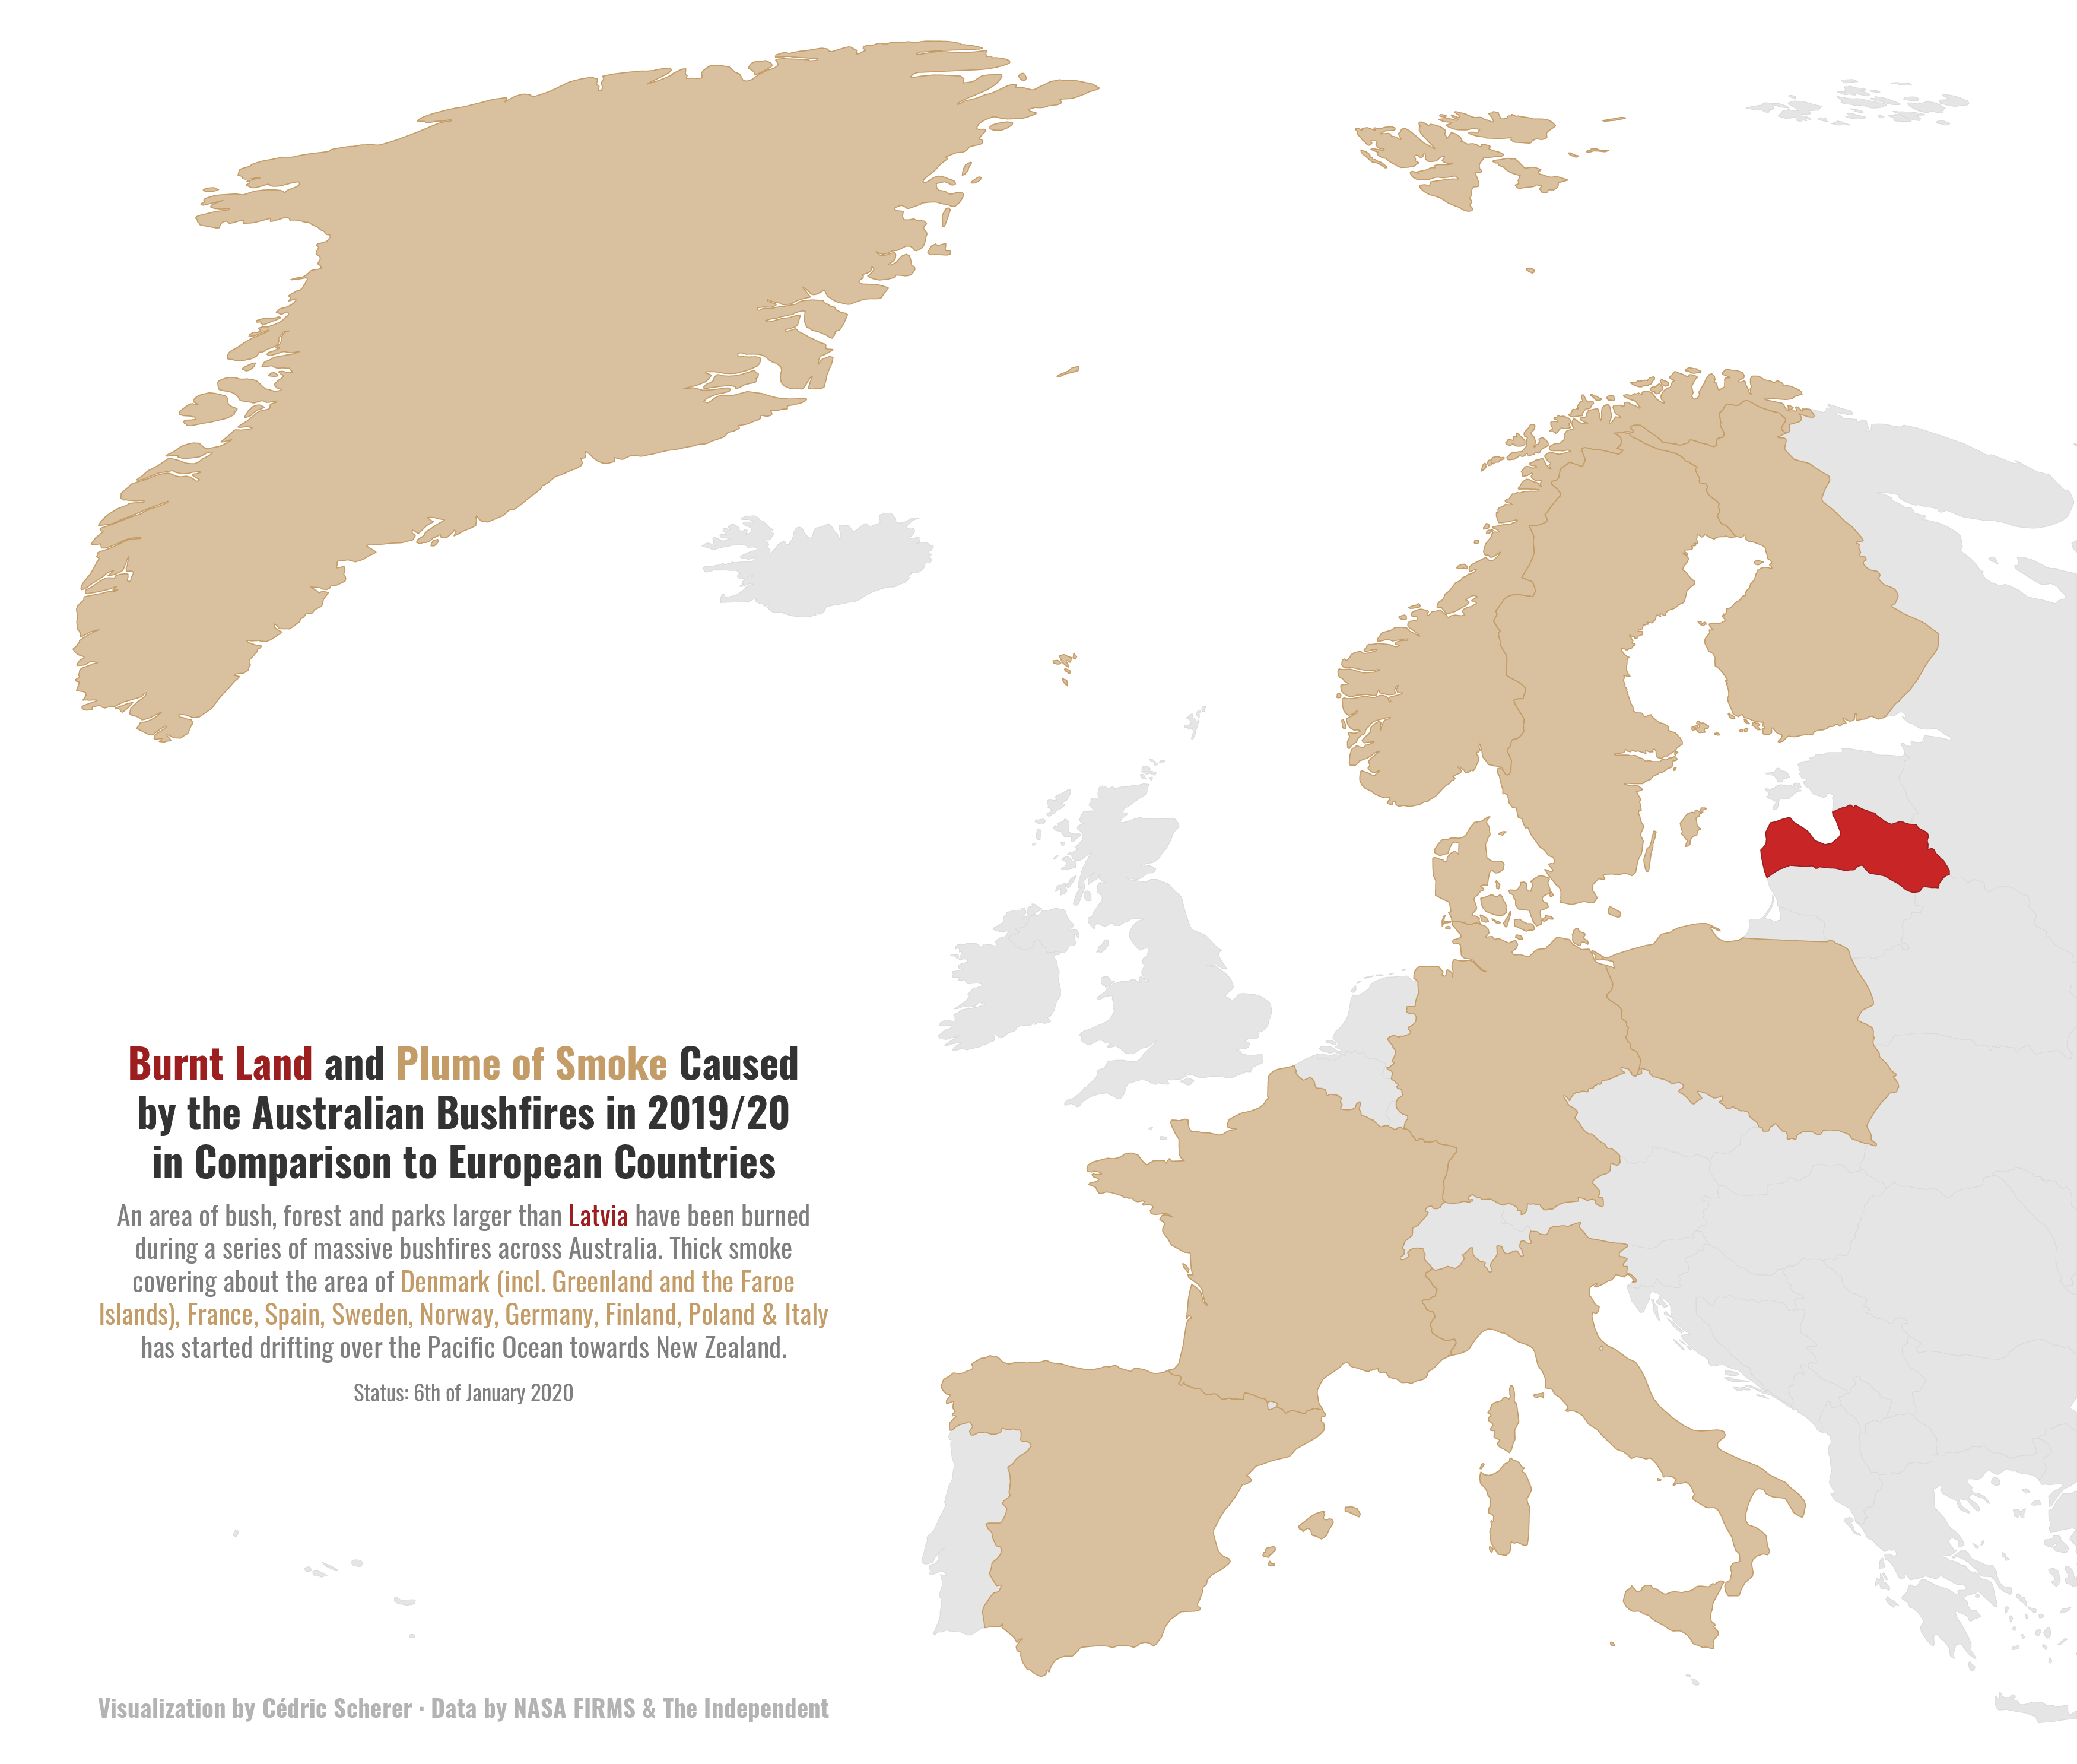
Week 2020/02 🔥 Australian Fires by NASA FIRMS

./plots/2020_02/2020_02_AustralianFires.png


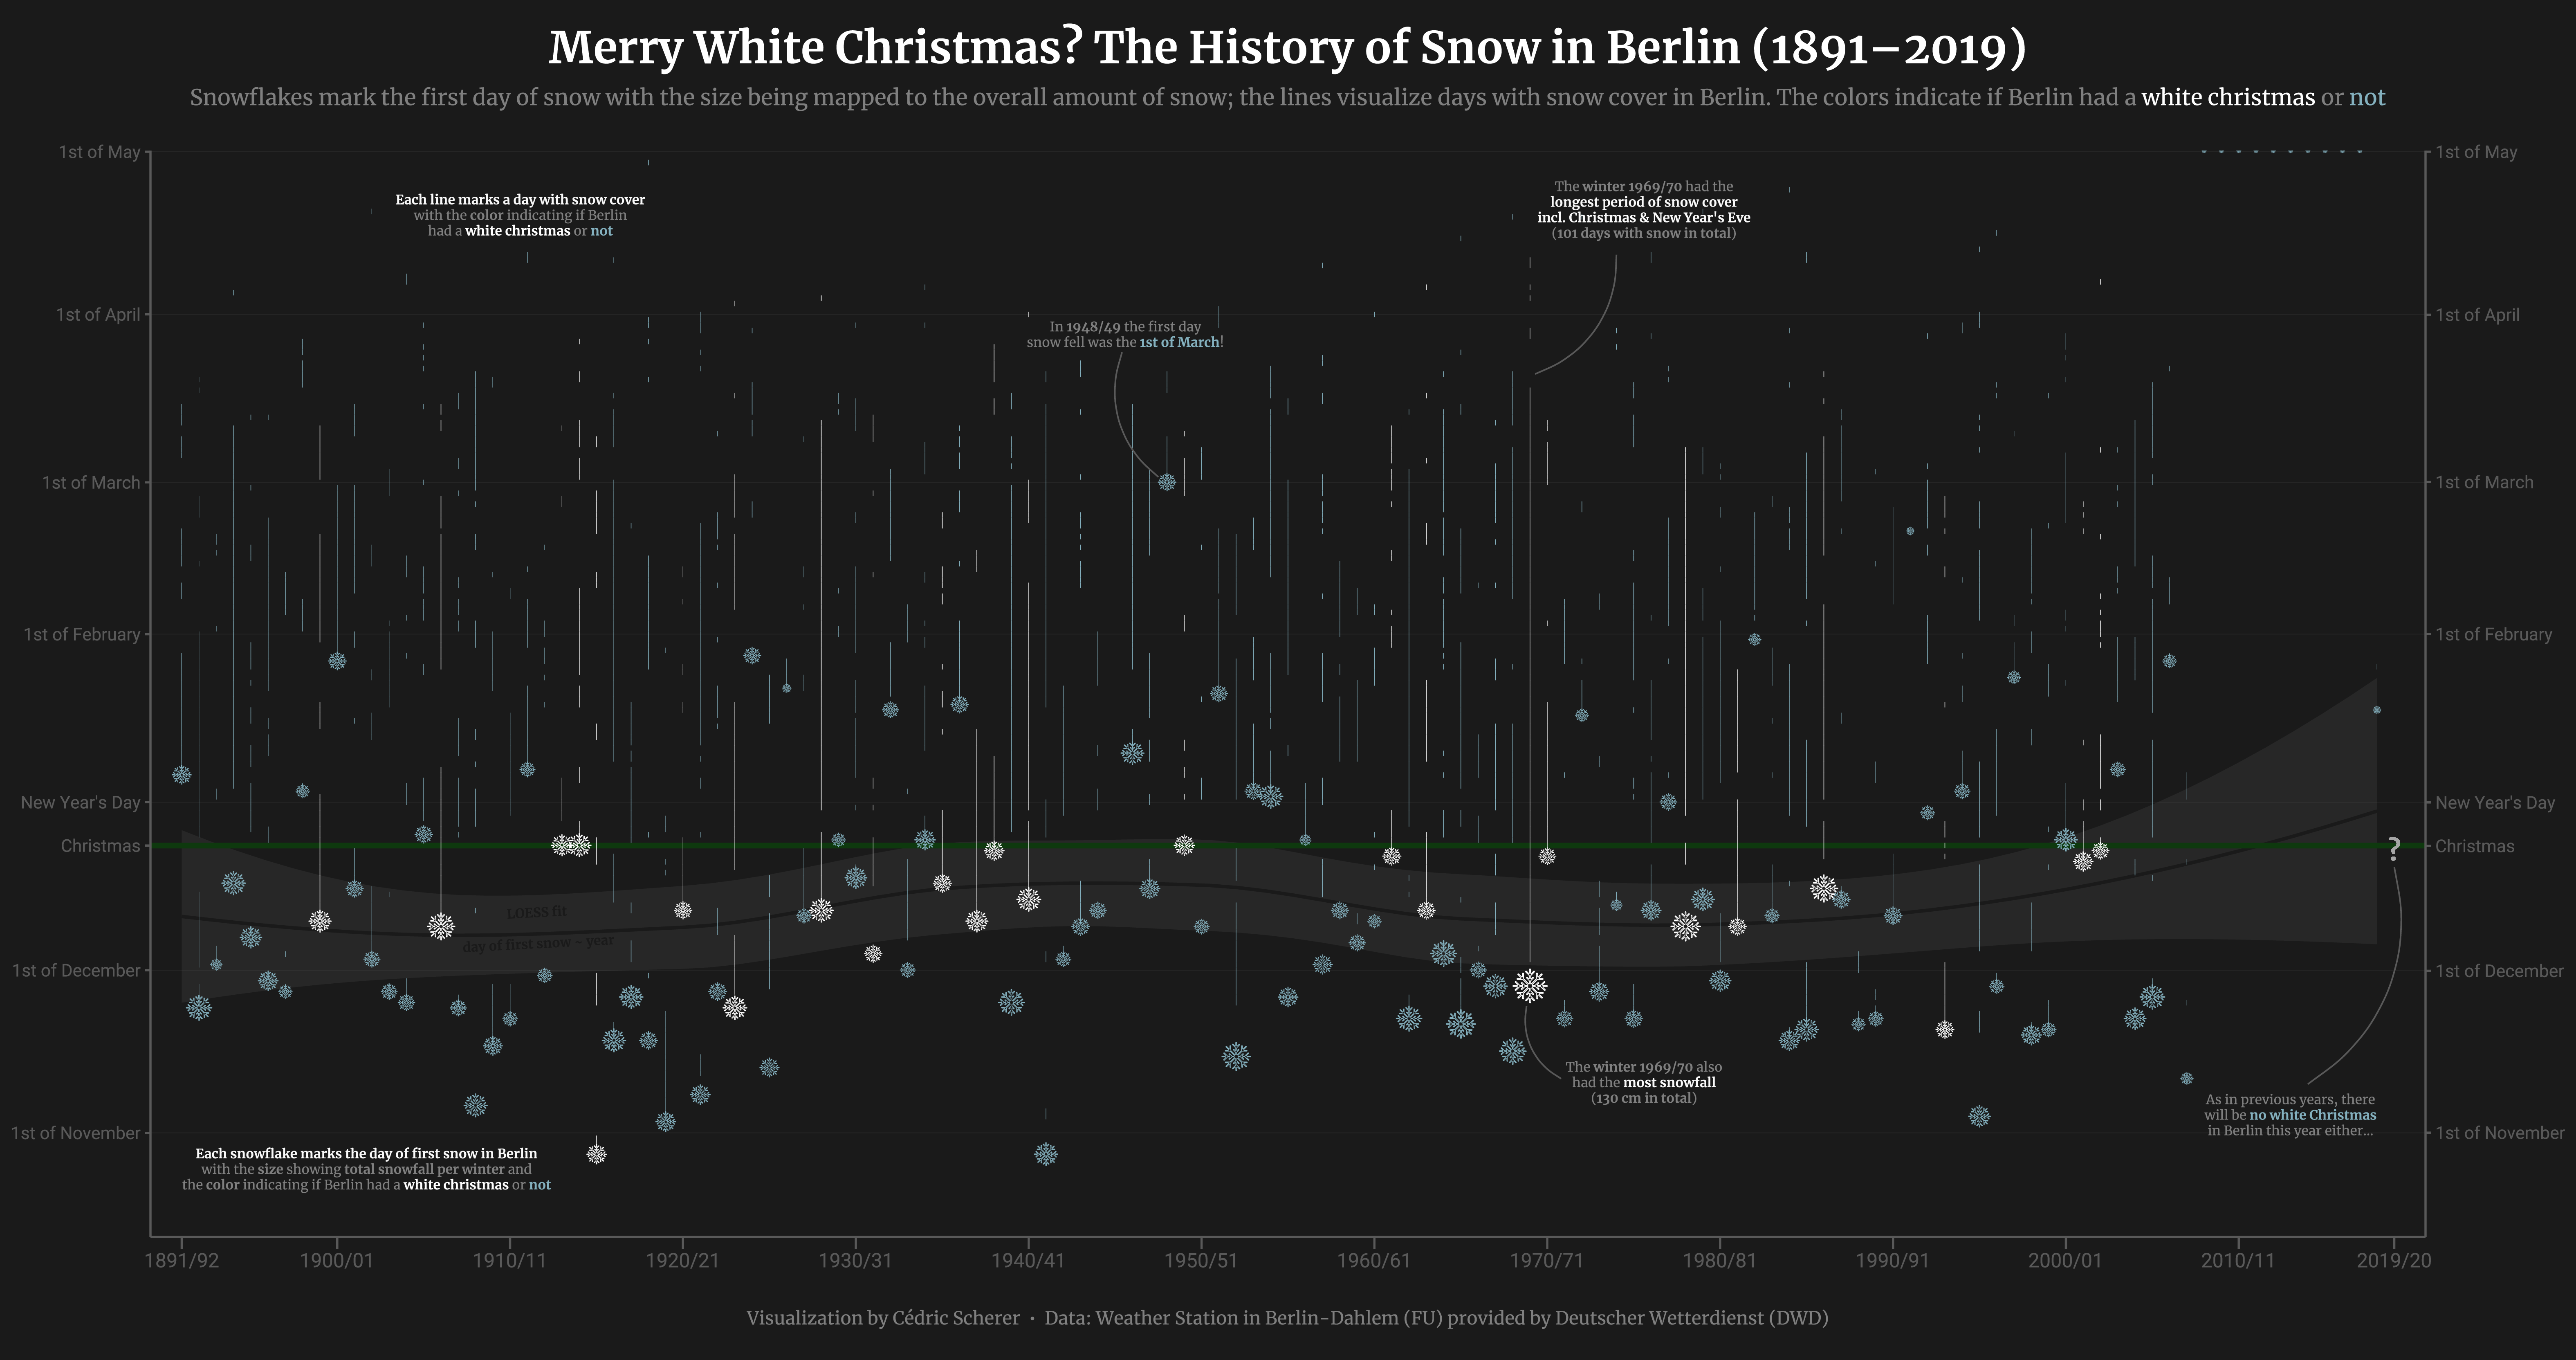
Week 2020/01 ❄️️ White Christmas in Berlin by Deutscher Wetterdienst

./plots/2020_01/2020_01_WhiteXmasBerlin.png


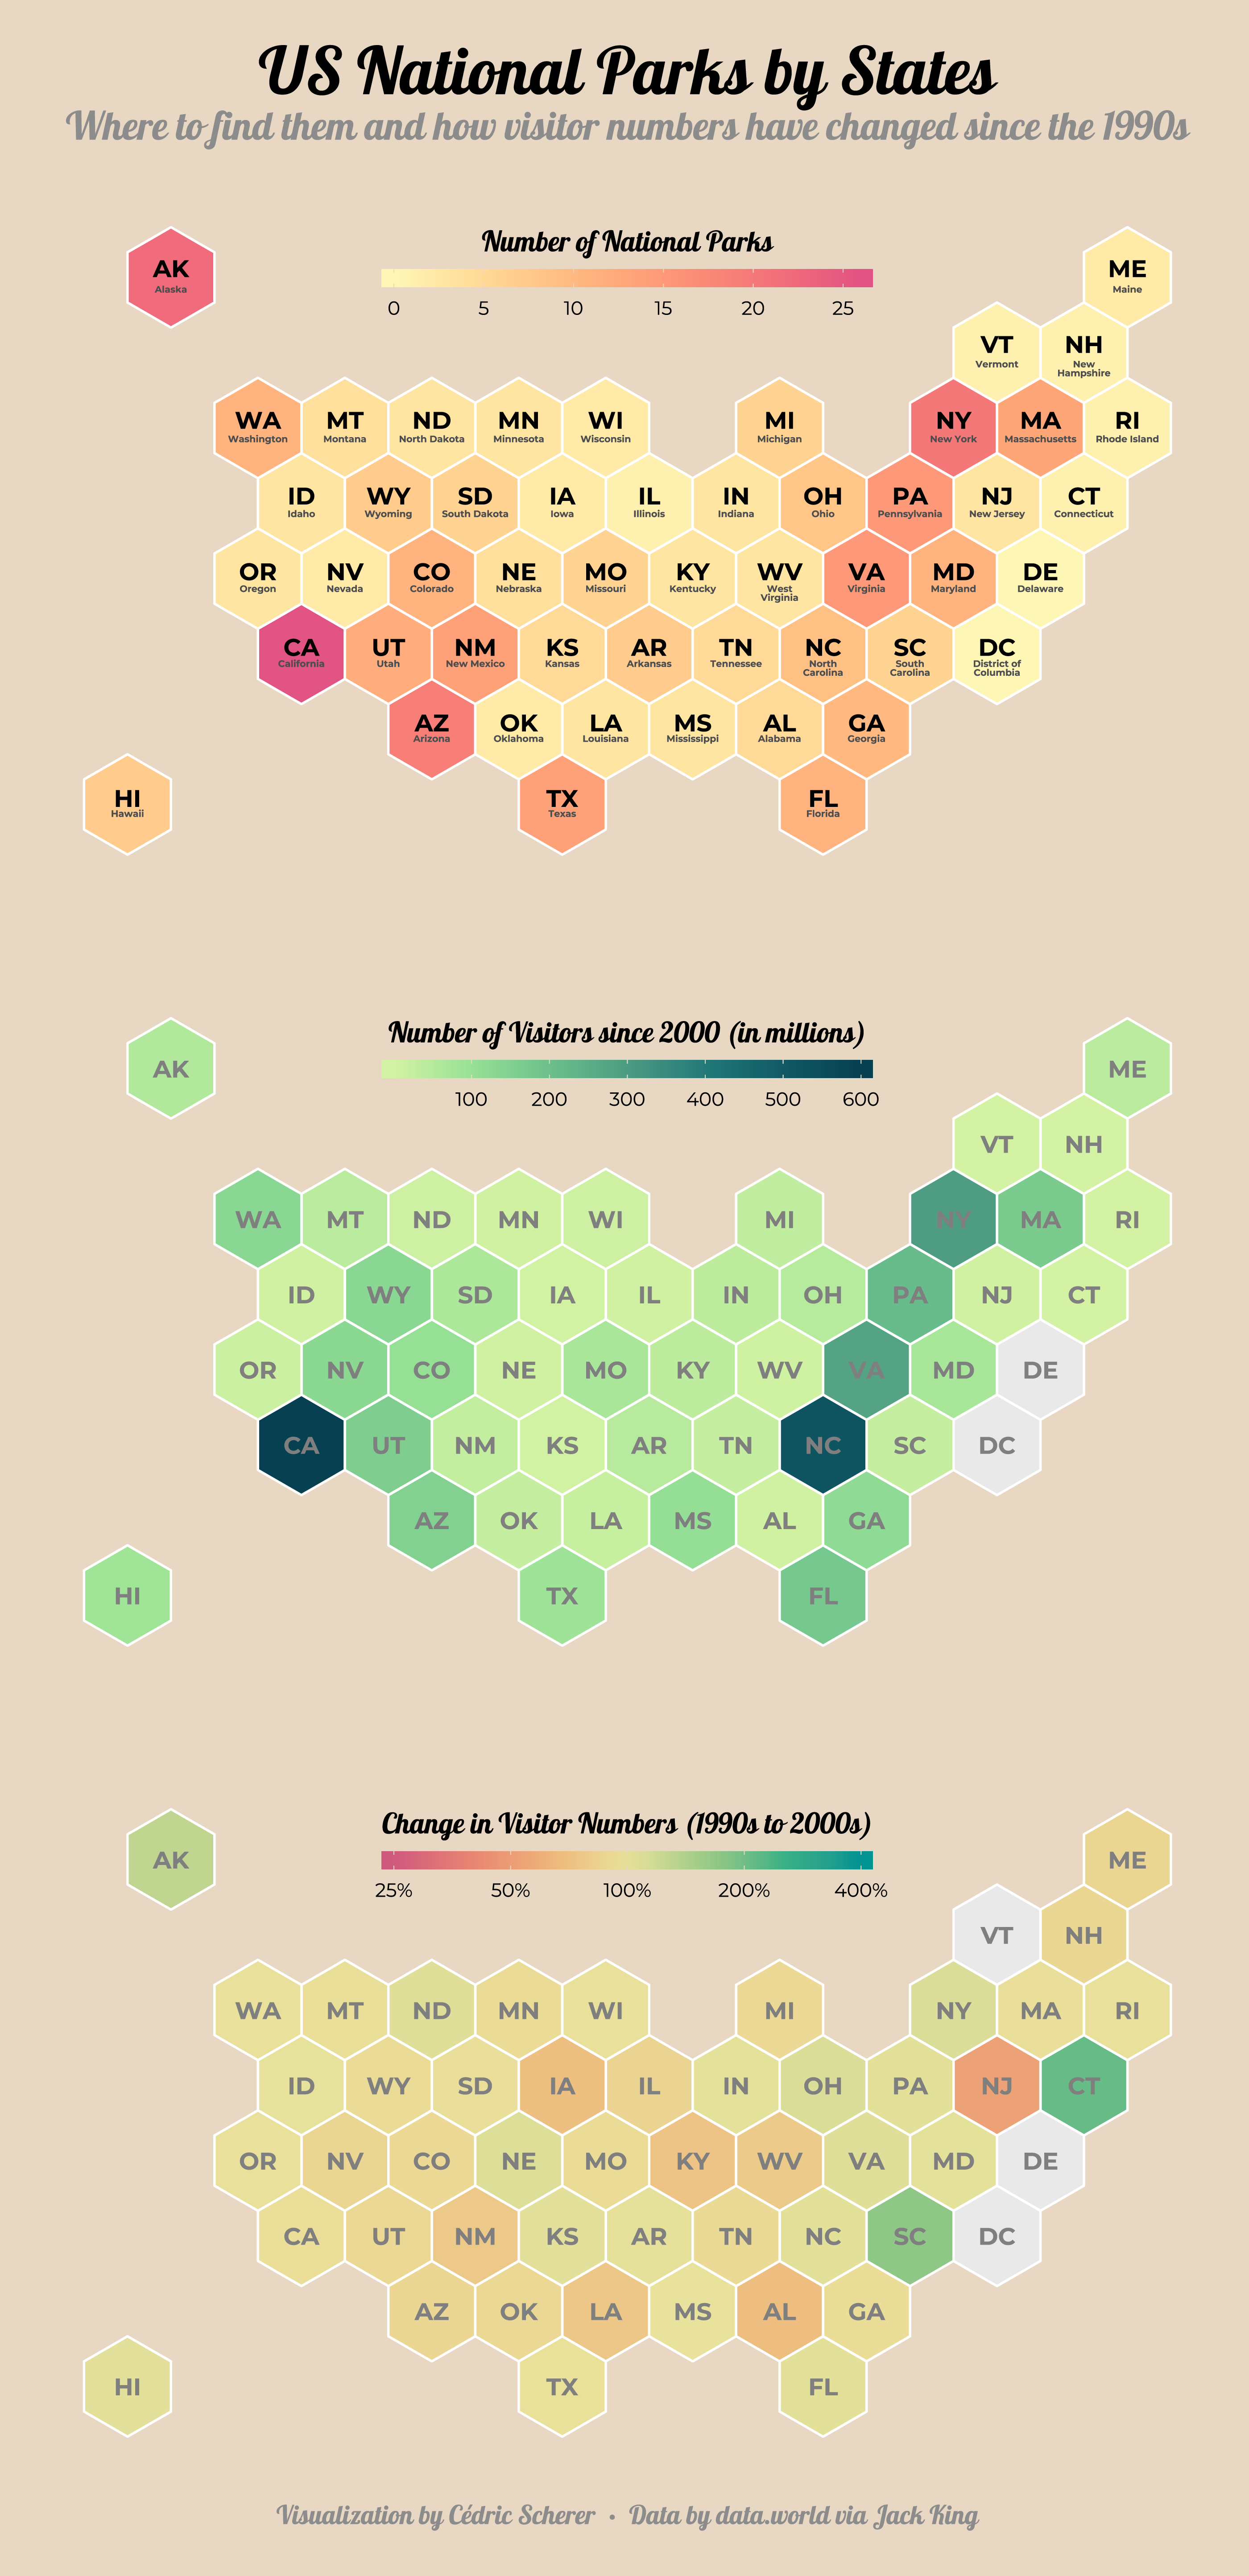
Week 2019/38 🏞️ US National Park Visits by data.world

./plots/2019_38/2019_38_NationalParks.png


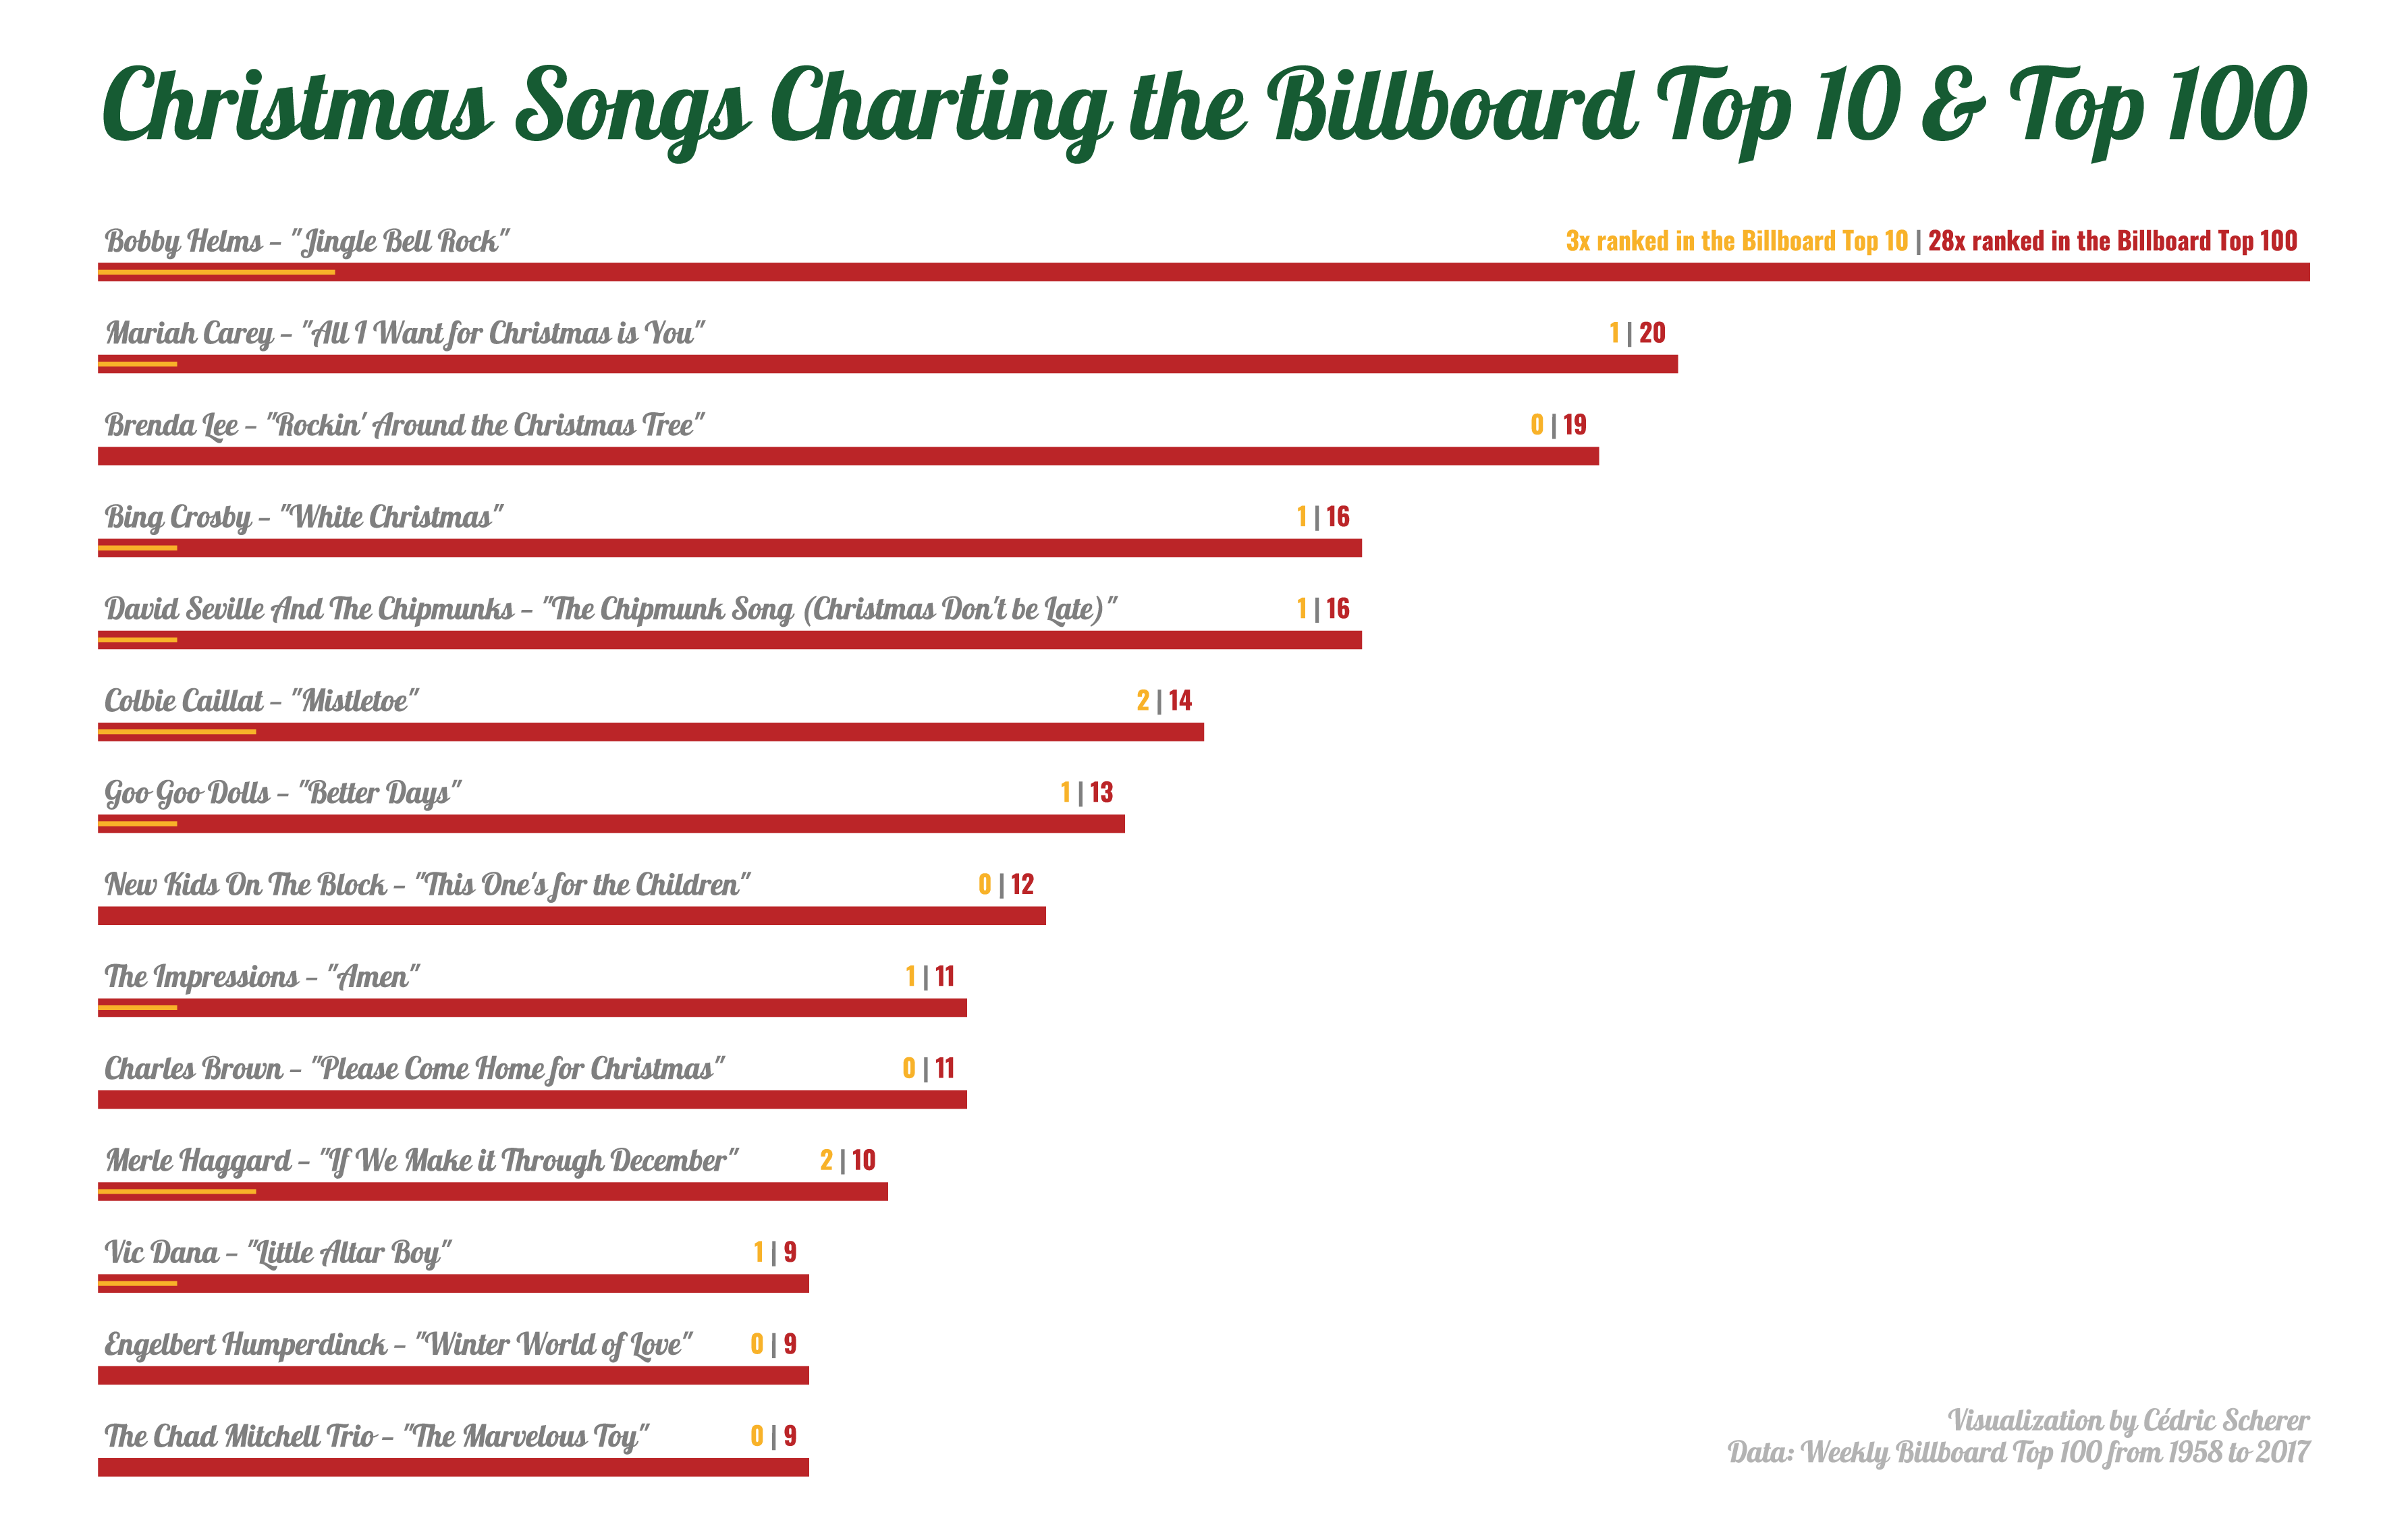
Week 2019/52 🎄 Christmas Songs by Billboard Top 100

./plots/2019_52/2019_52_ChristmasSongs.png


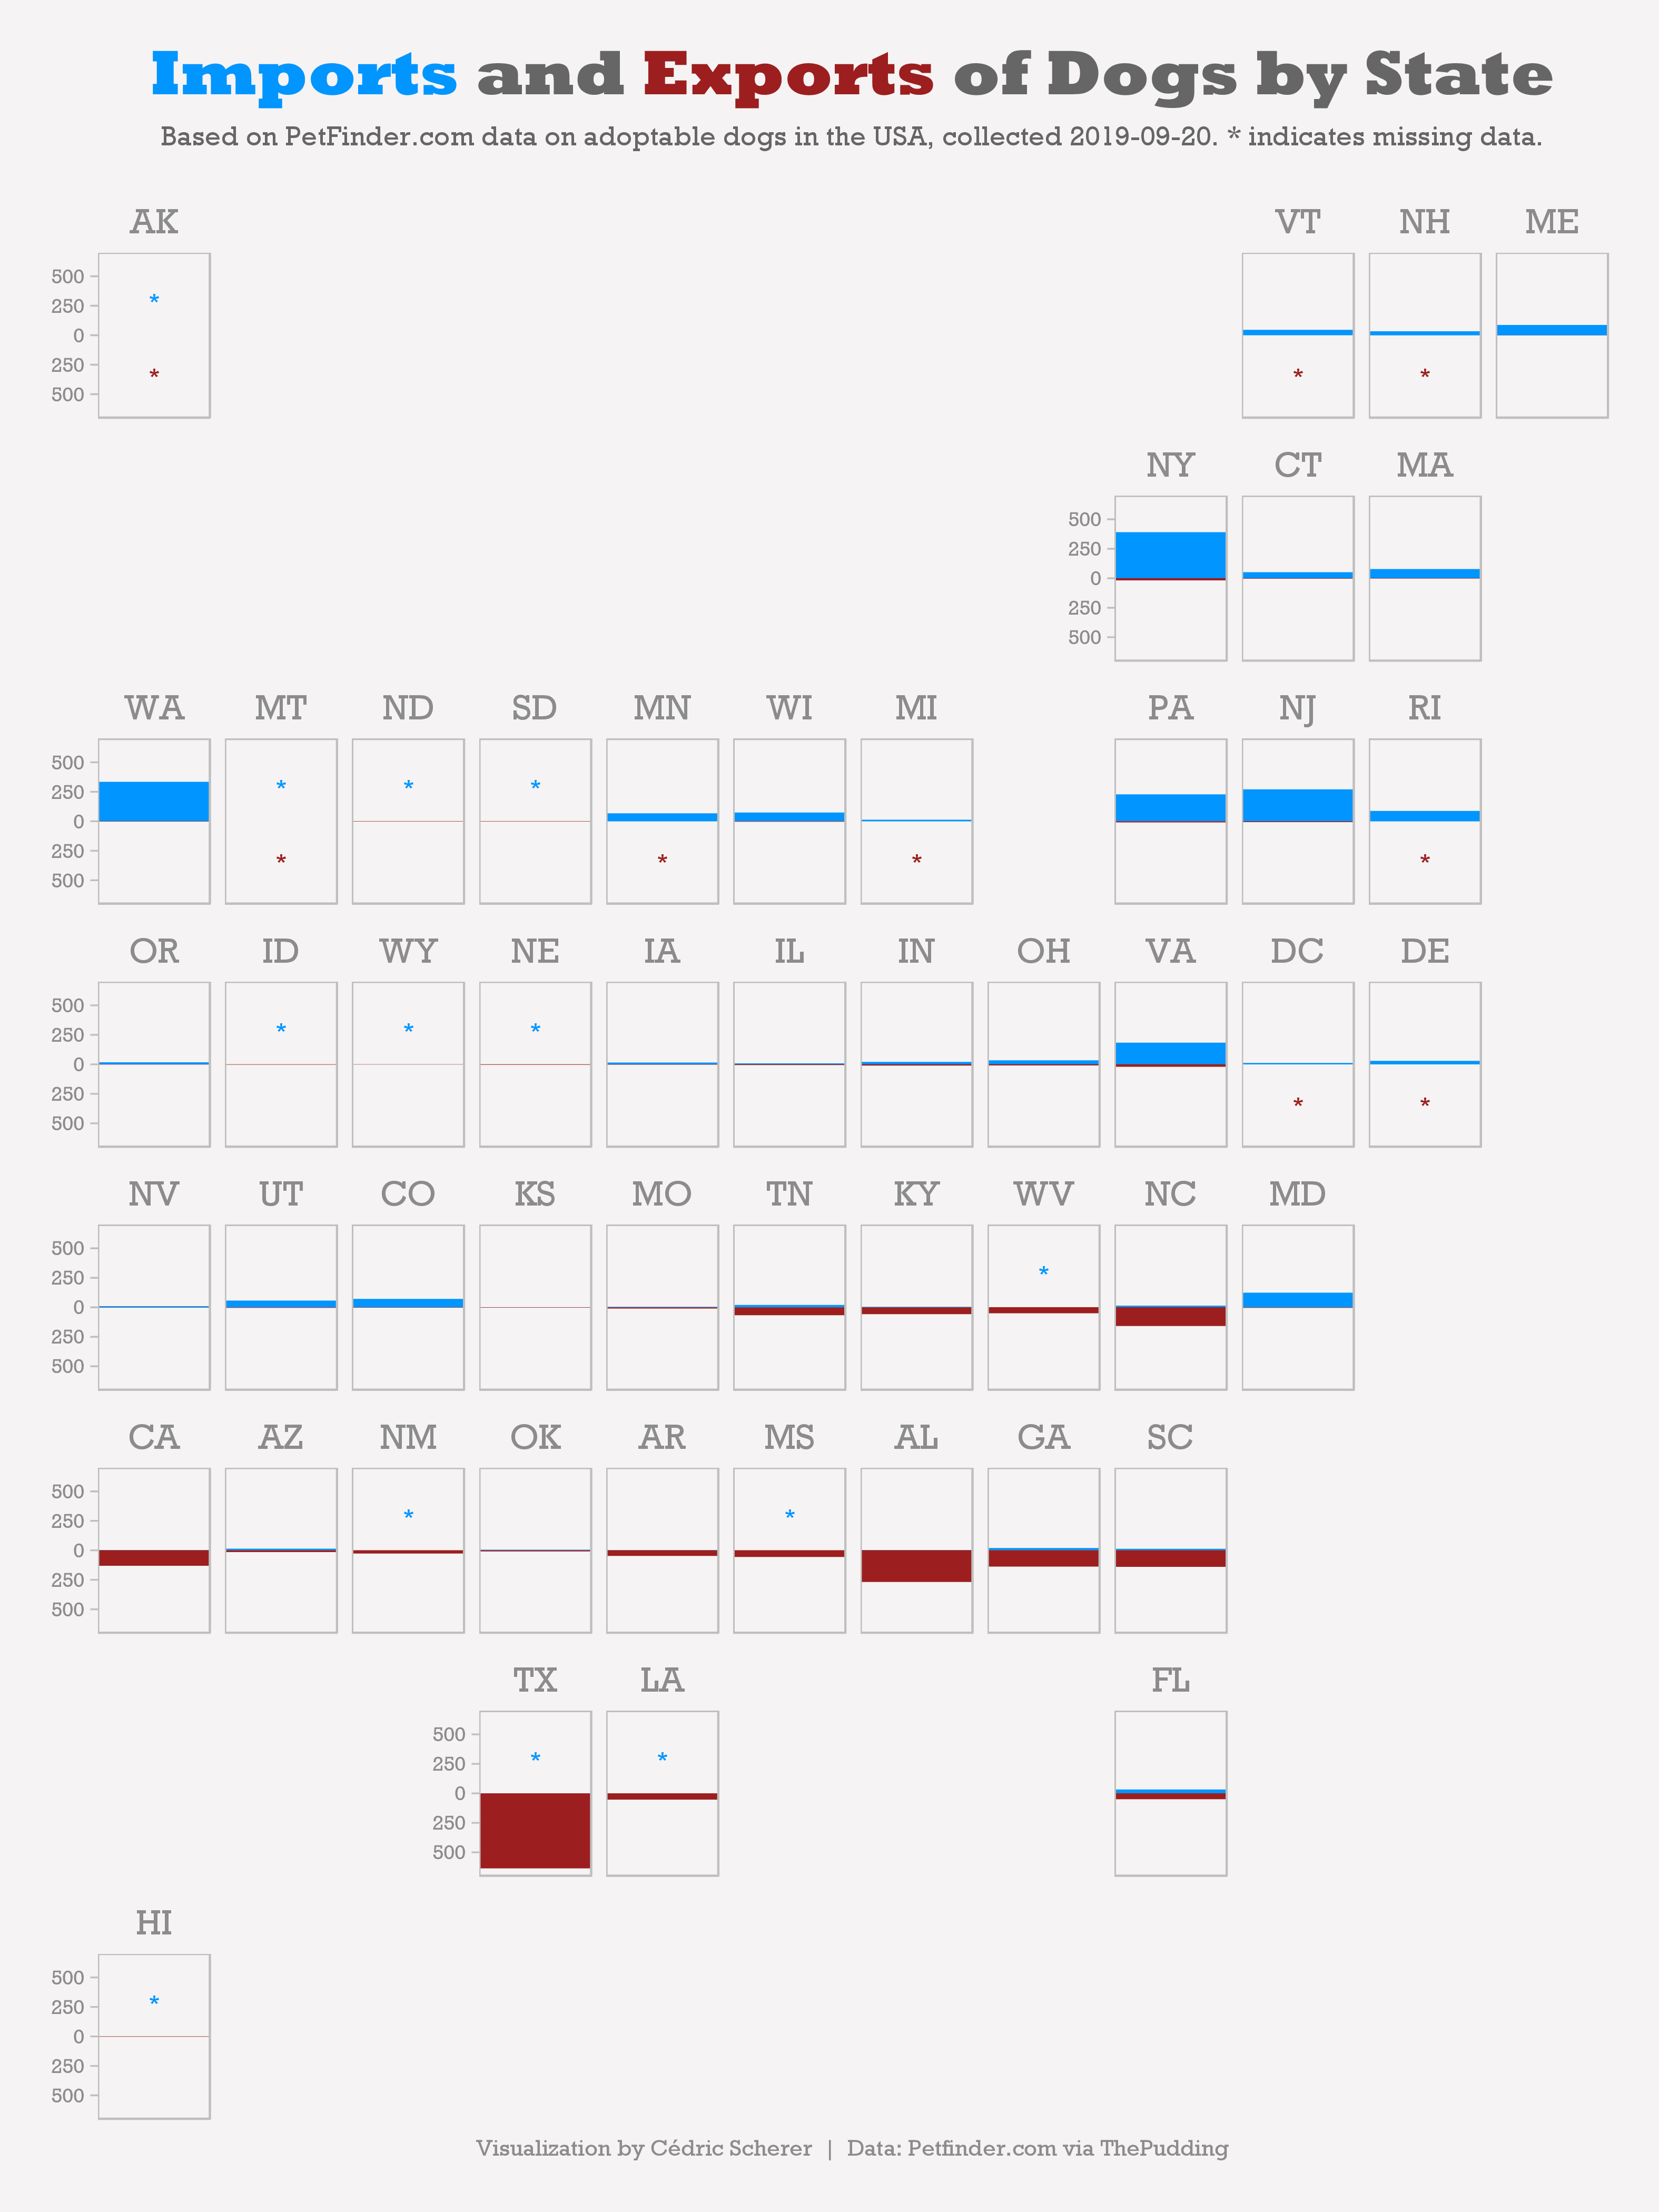
./plots/2019_51/2019_51_DogAdoptions.png


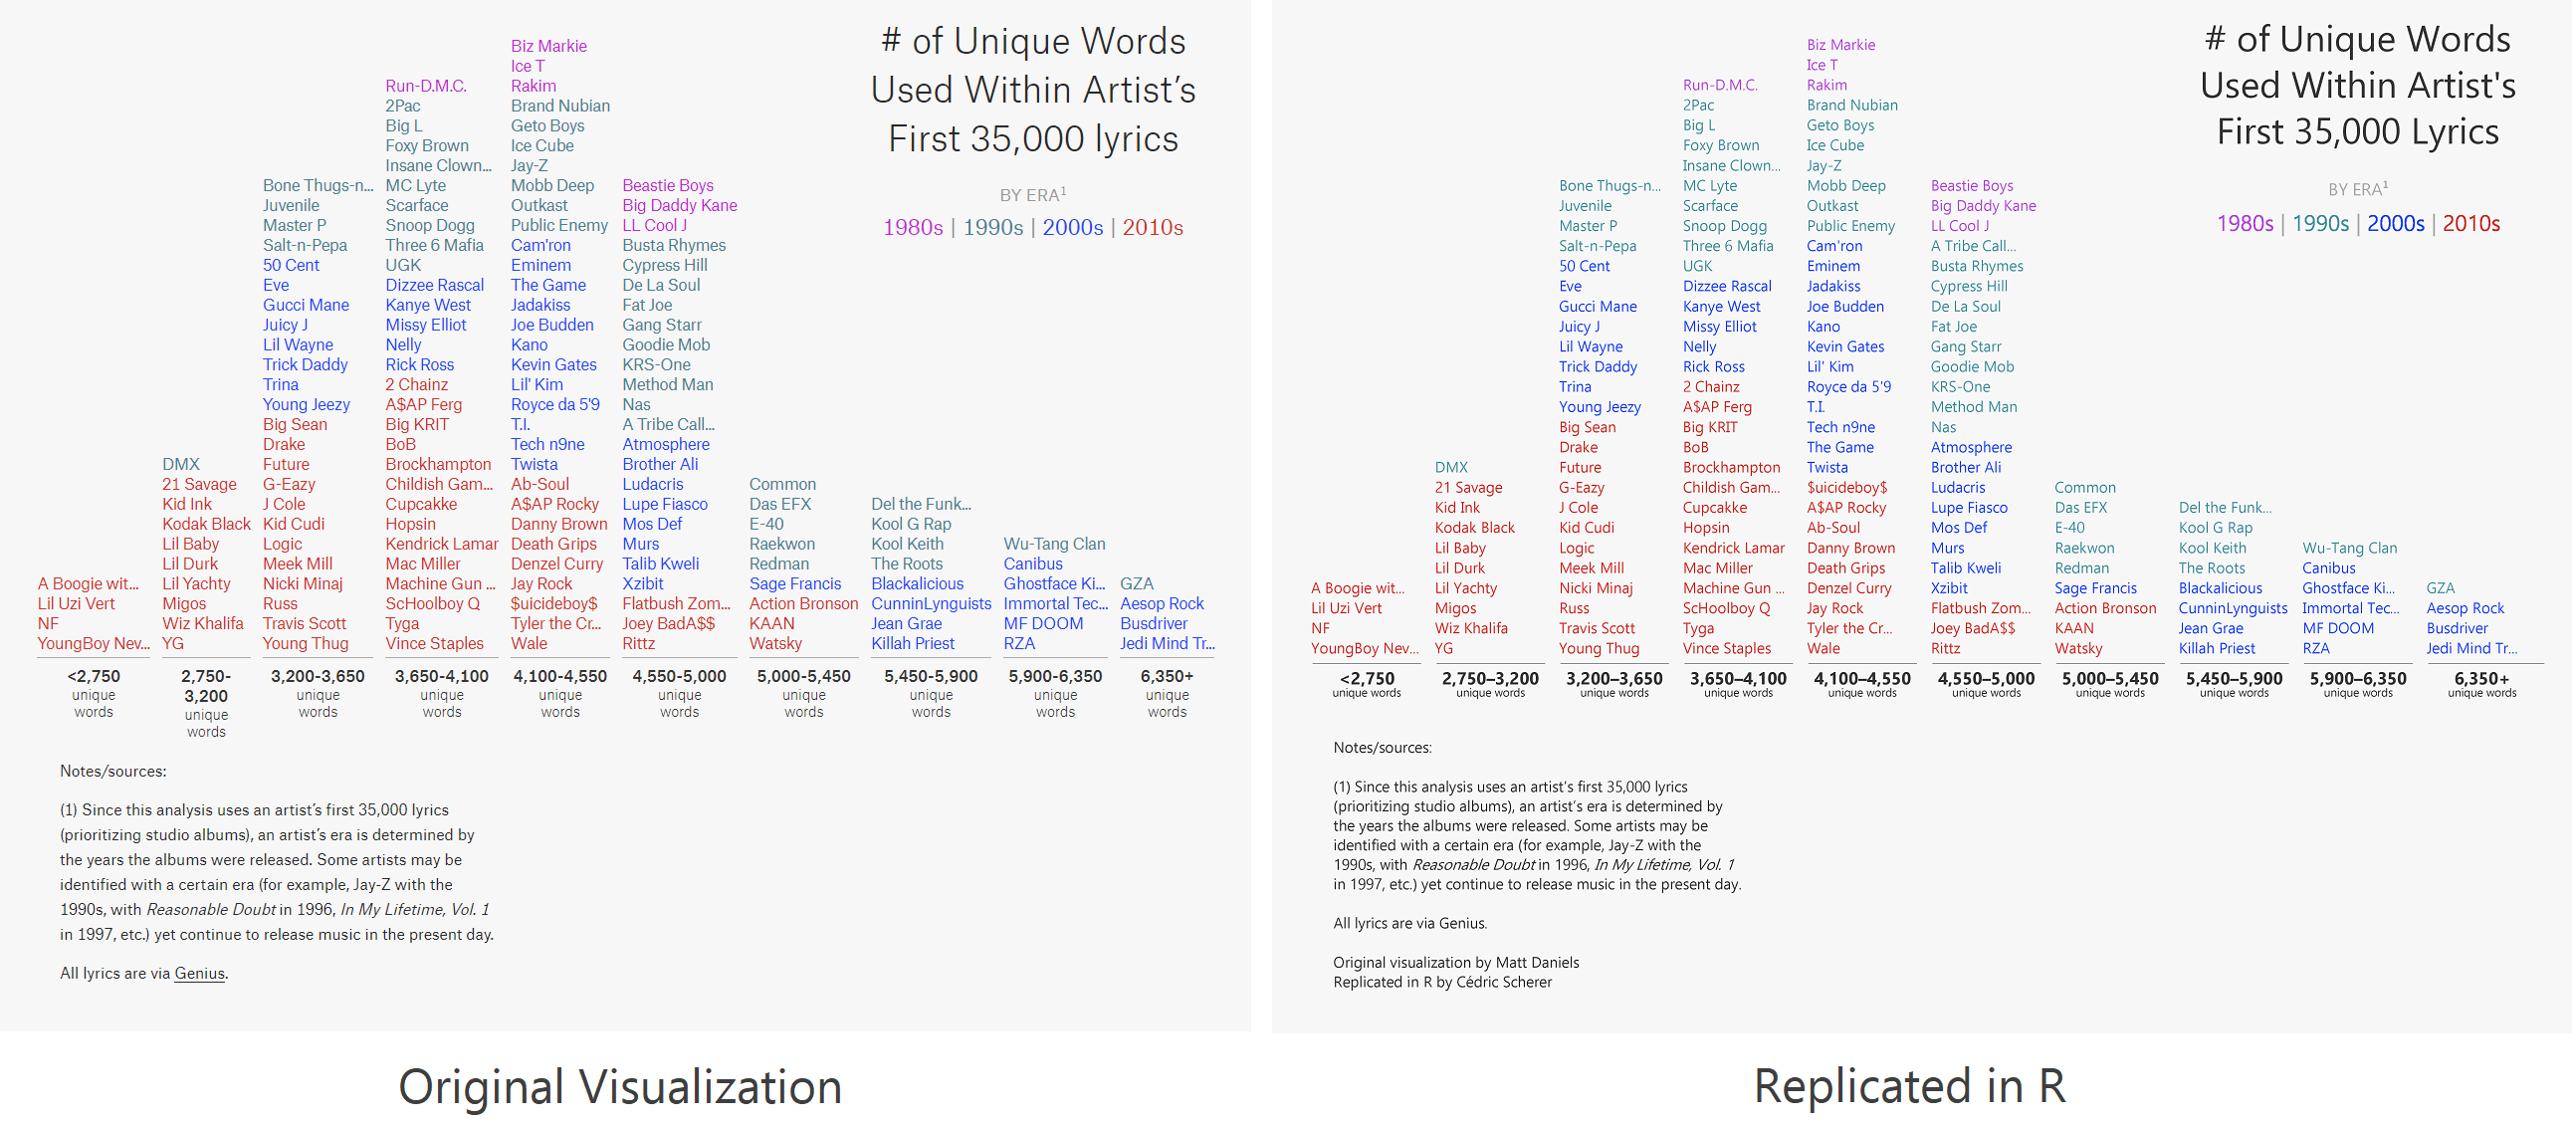
./plots/2019_50/2019_50_Replicate_Rap_bee_original.png
./plots/2019_50/2019_50_Replicate_Rap_text_original.png


./plots/2018_33/2018_33_MalariaDeaths.png


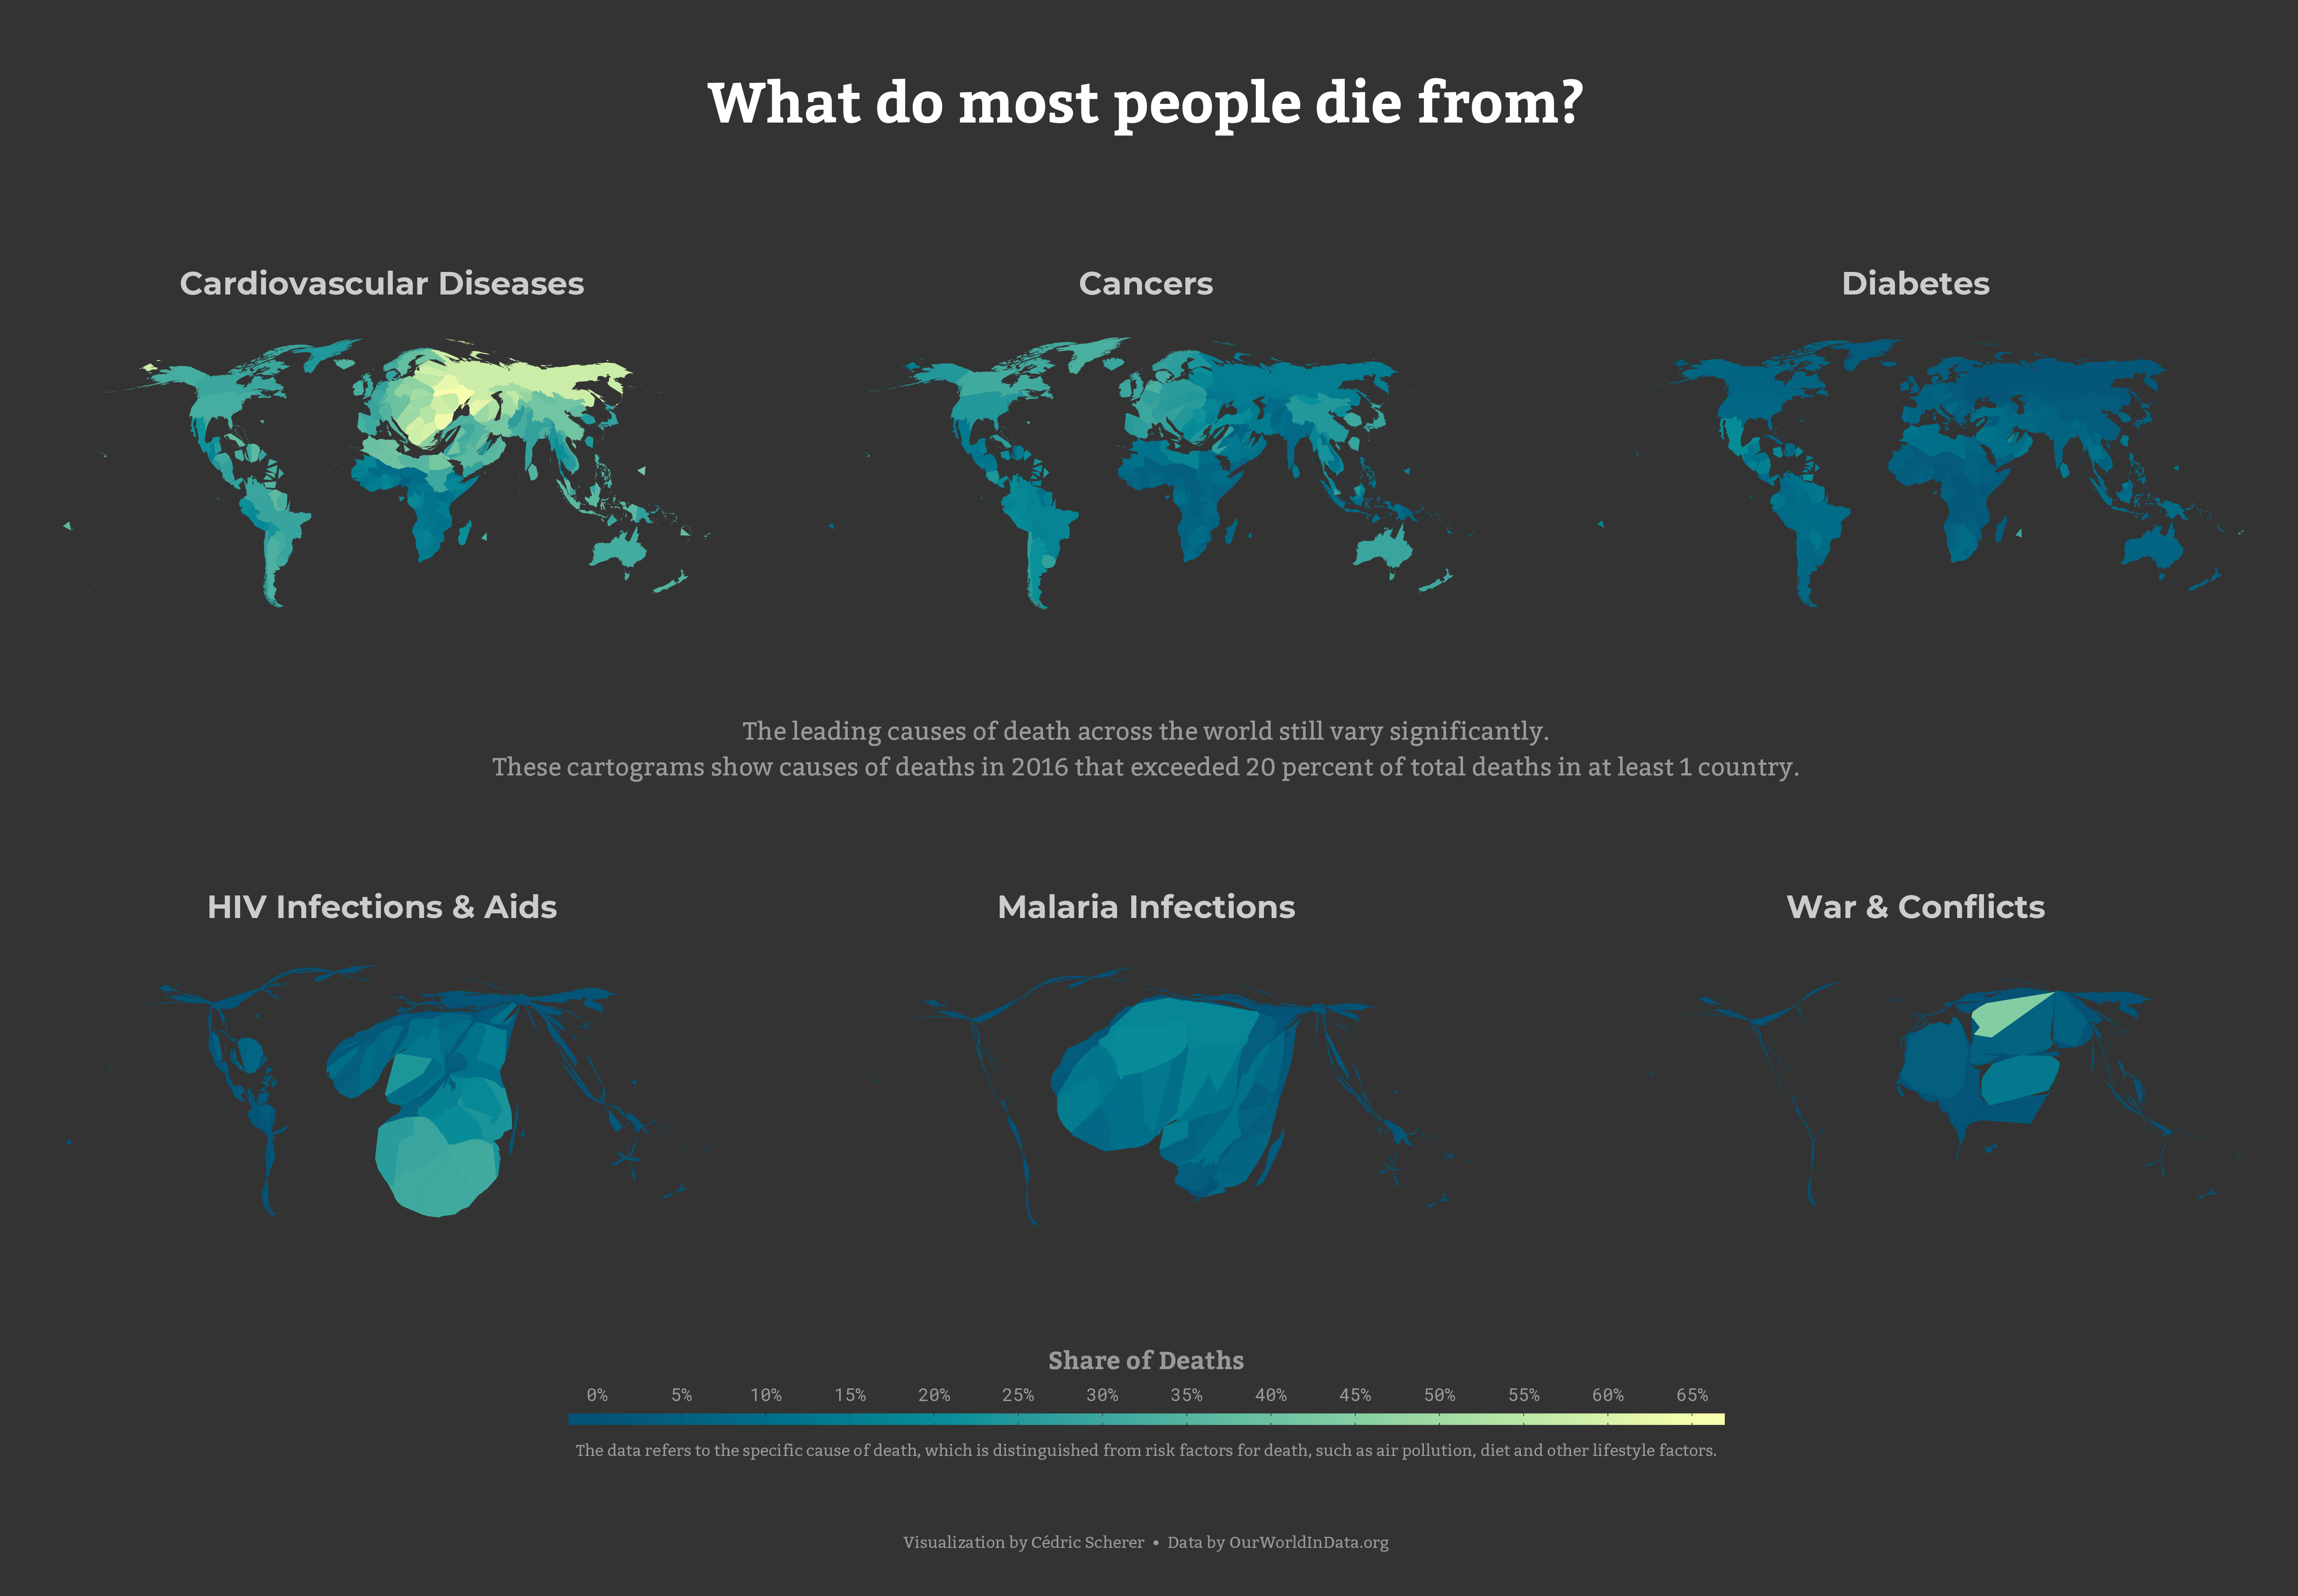
Week 2018/03 ⚱️ Global Mortality by OurWorldInData.org

./plots/2018_03/2018_03_GlobalMortality.png


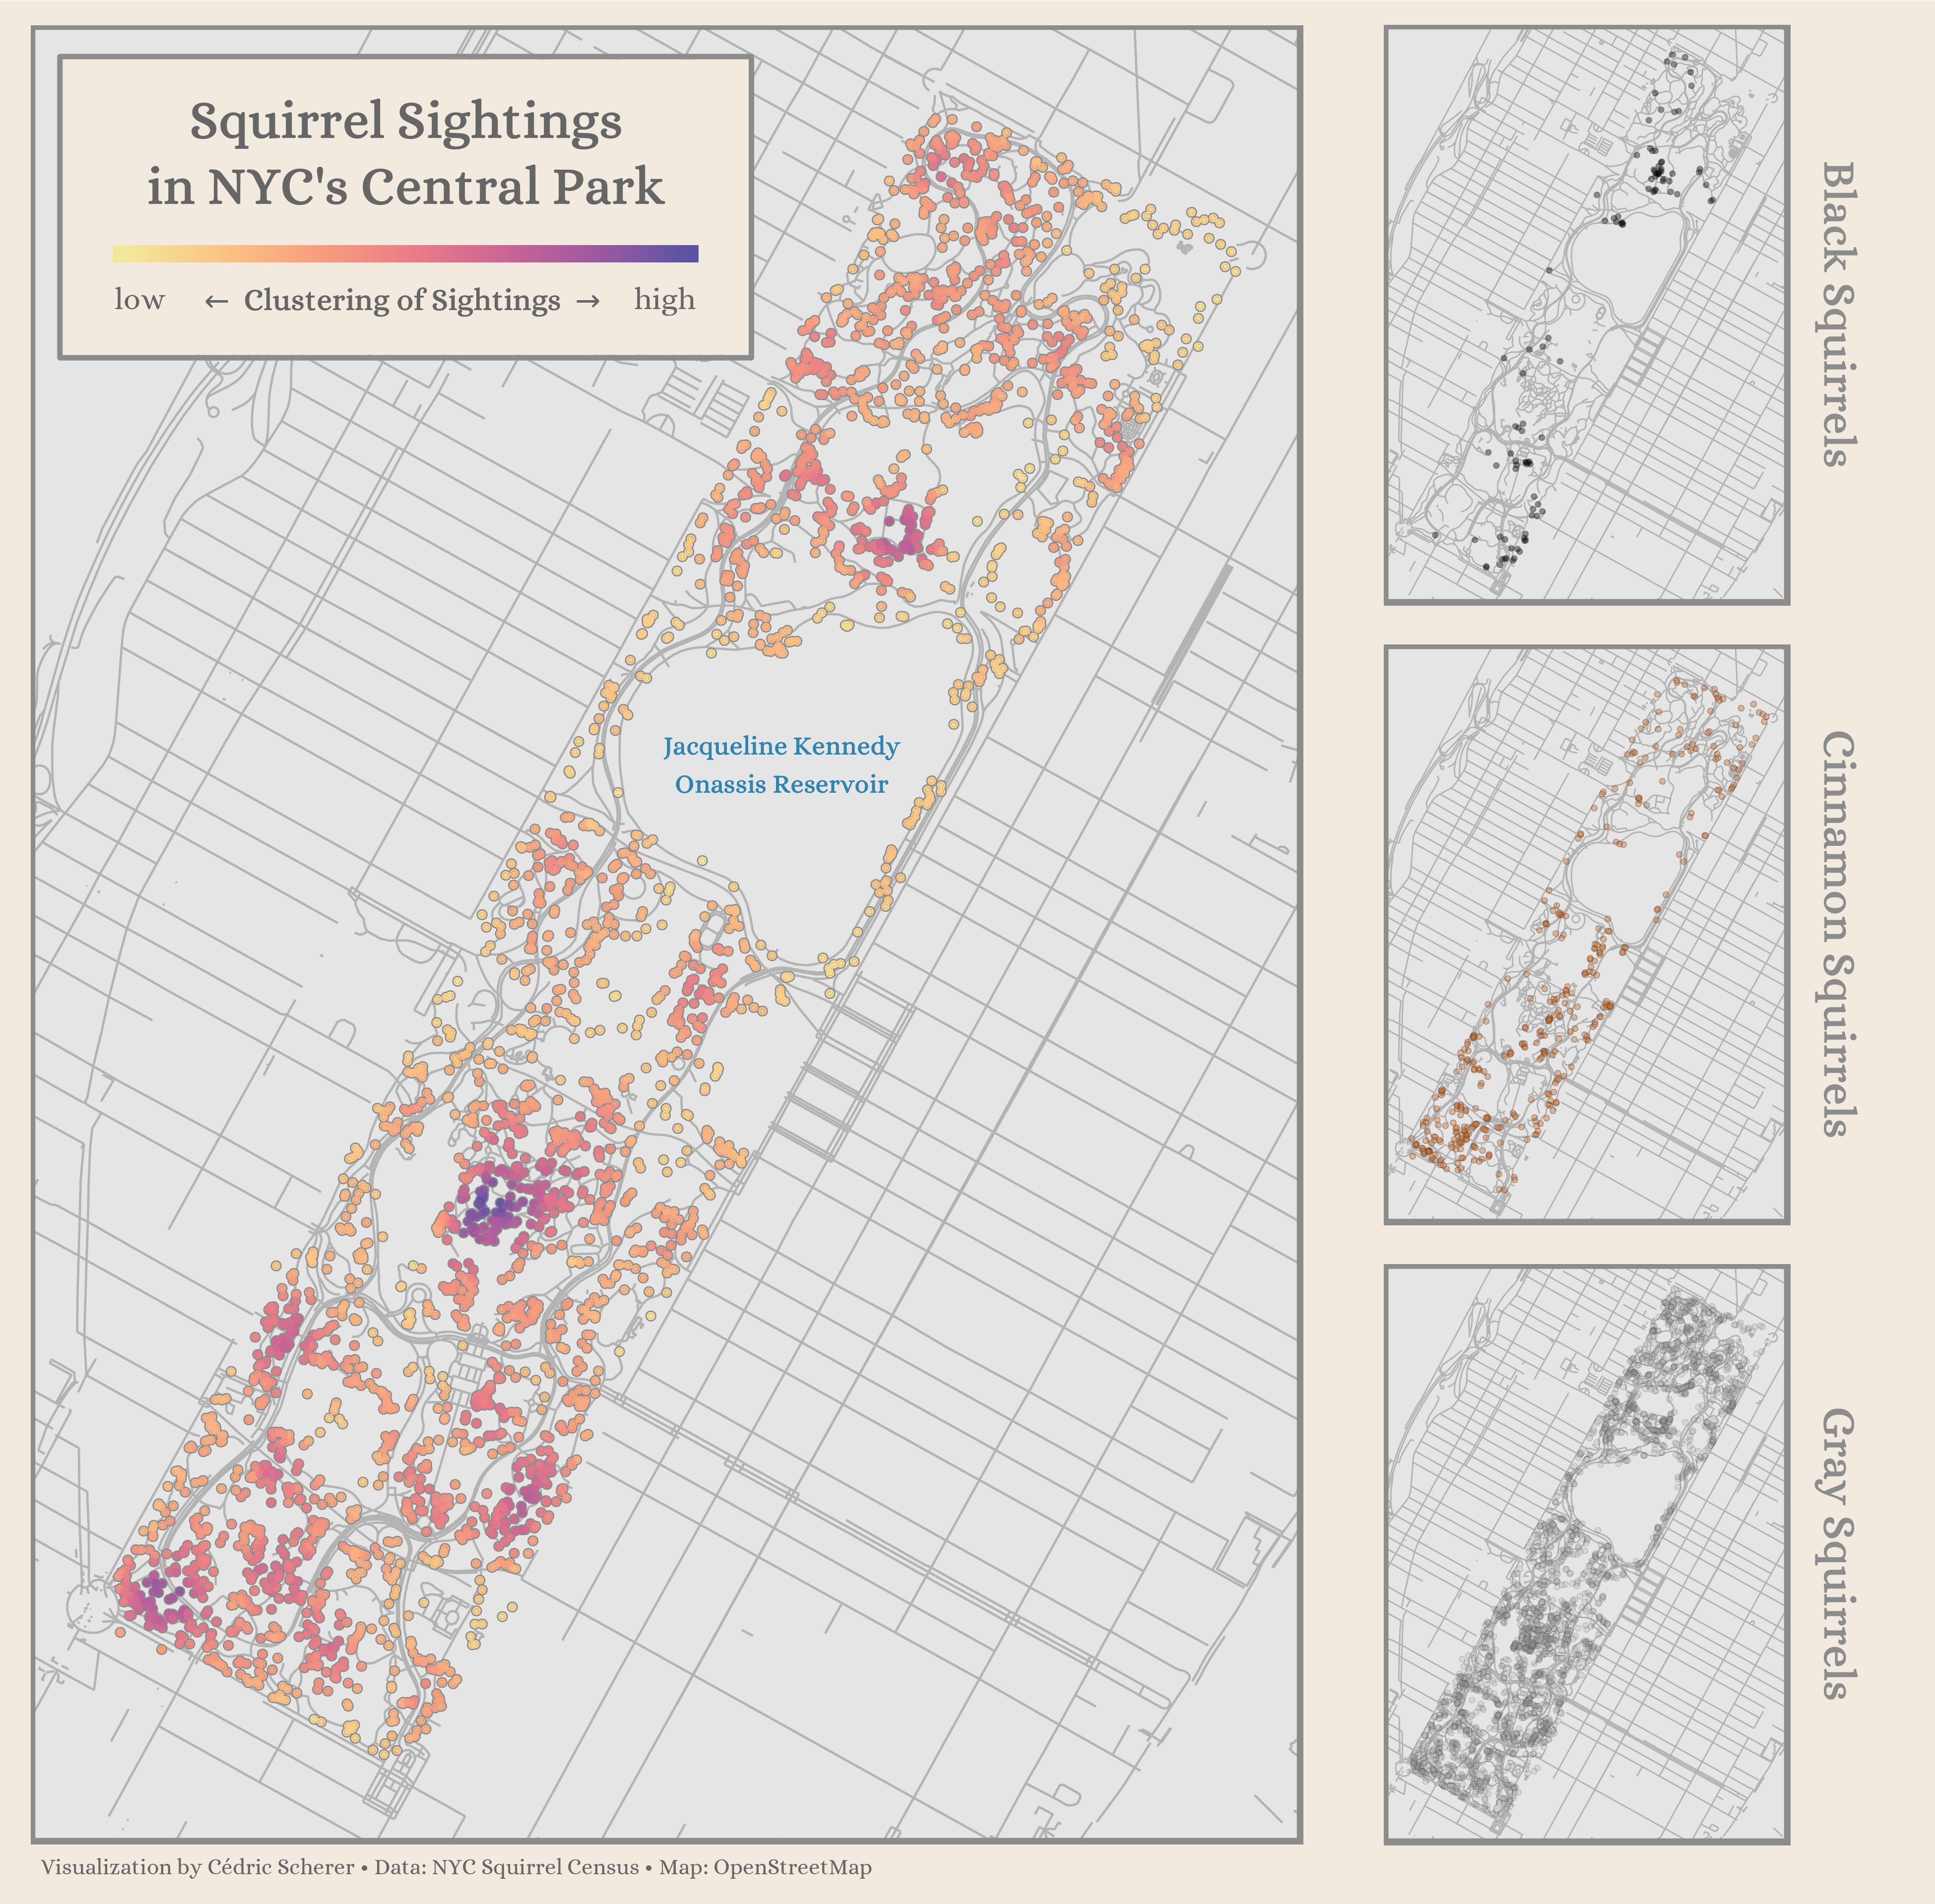
Week 2019/44️ 🐿️ NYC Squirrels by Squirrel Census

./plots/2019_44/2019_44_Squirrels_rev.png


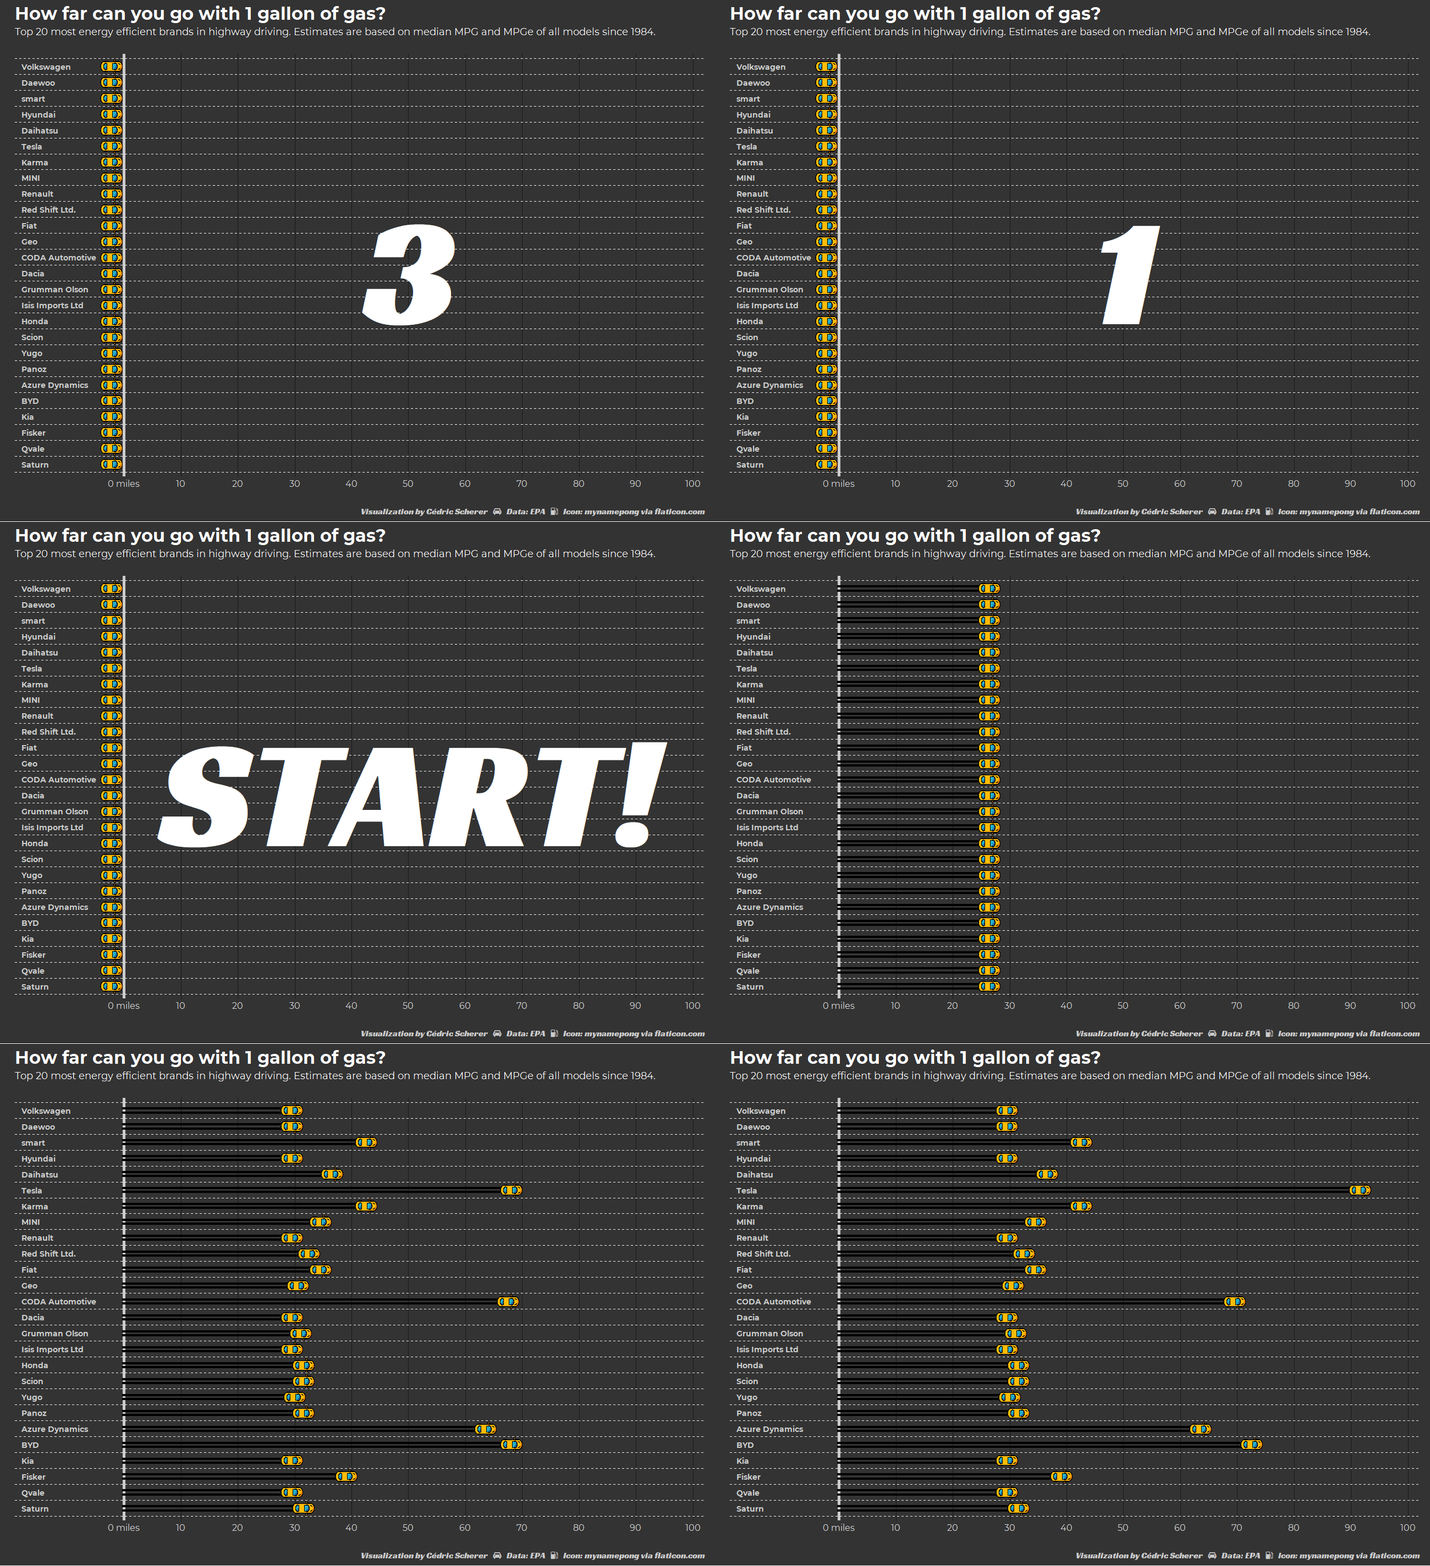
Week 2019/42️ 🚘 Big Cars by EPA

./plots/2019_42/2019_42_BigCars_Highway.gif


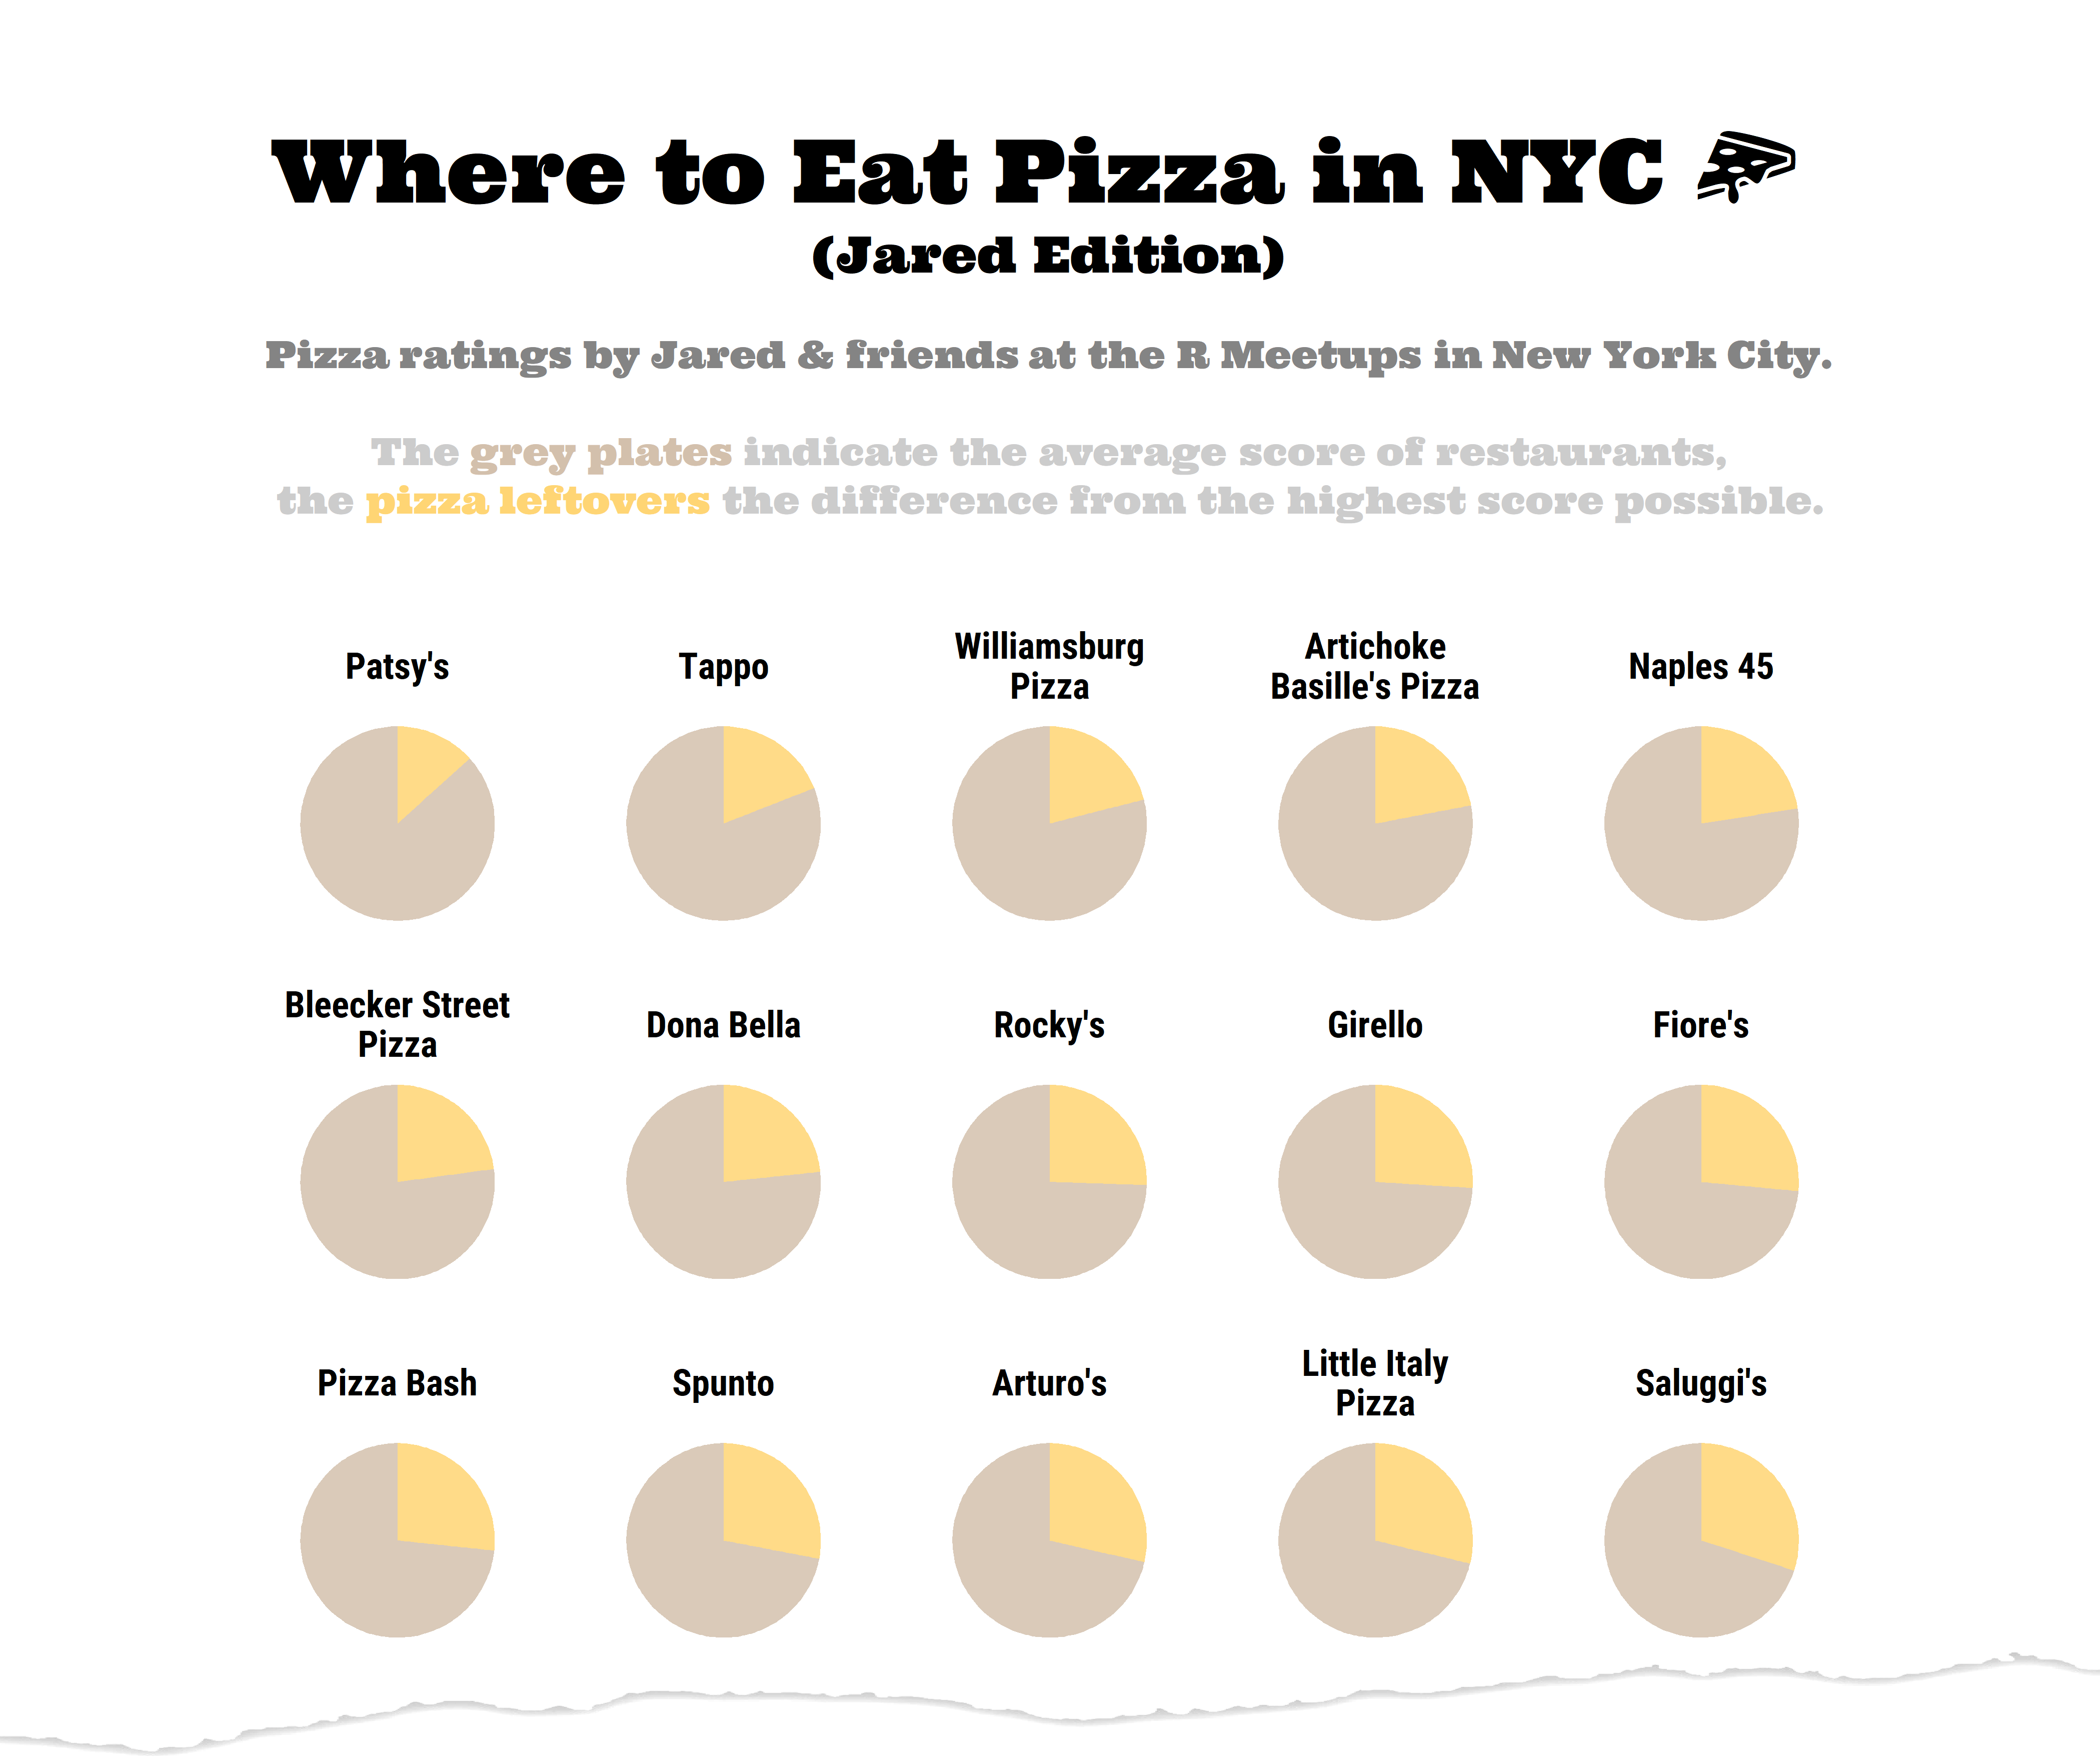
Week 2019/40️ 🍕 Pizza Ratings by Jared Lander & Bartools Sports

./plots/2019_40/2019_40_Pizza_jared.png


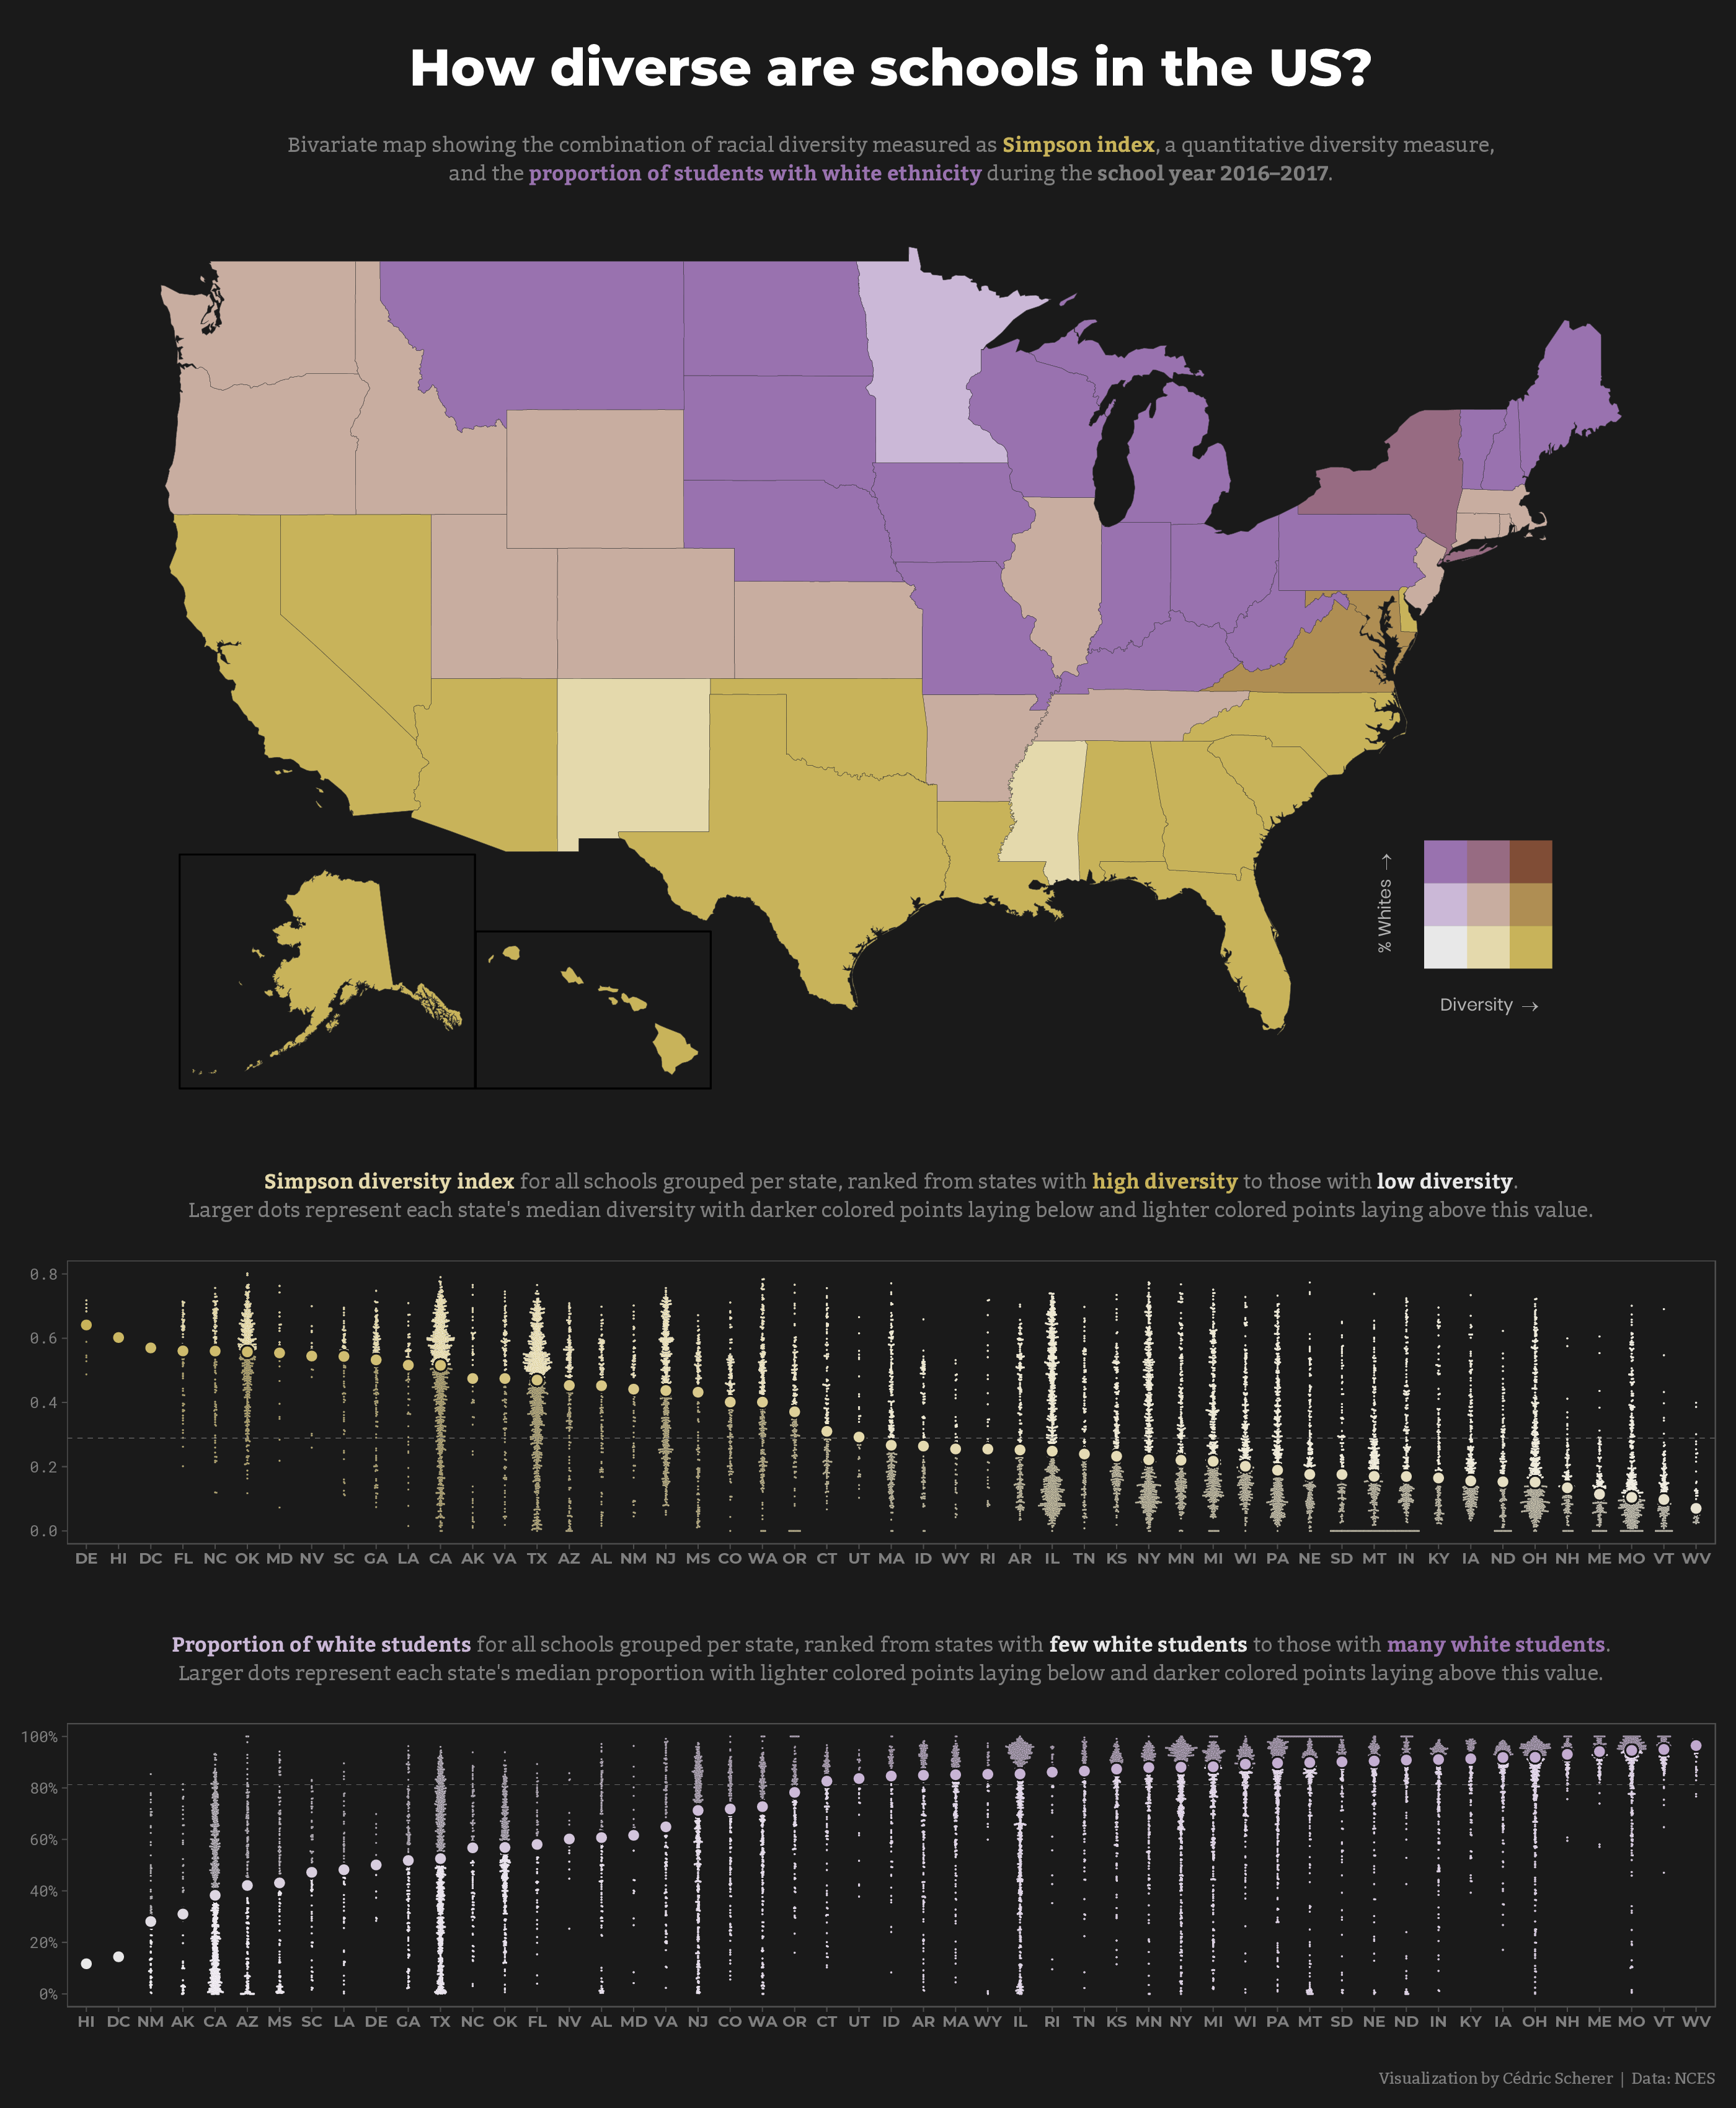
Week 2019/39️ 🏫️ School Diversity by NCES

./plots/2019_39/2019_39_SchoolDiversity_brpurp.png


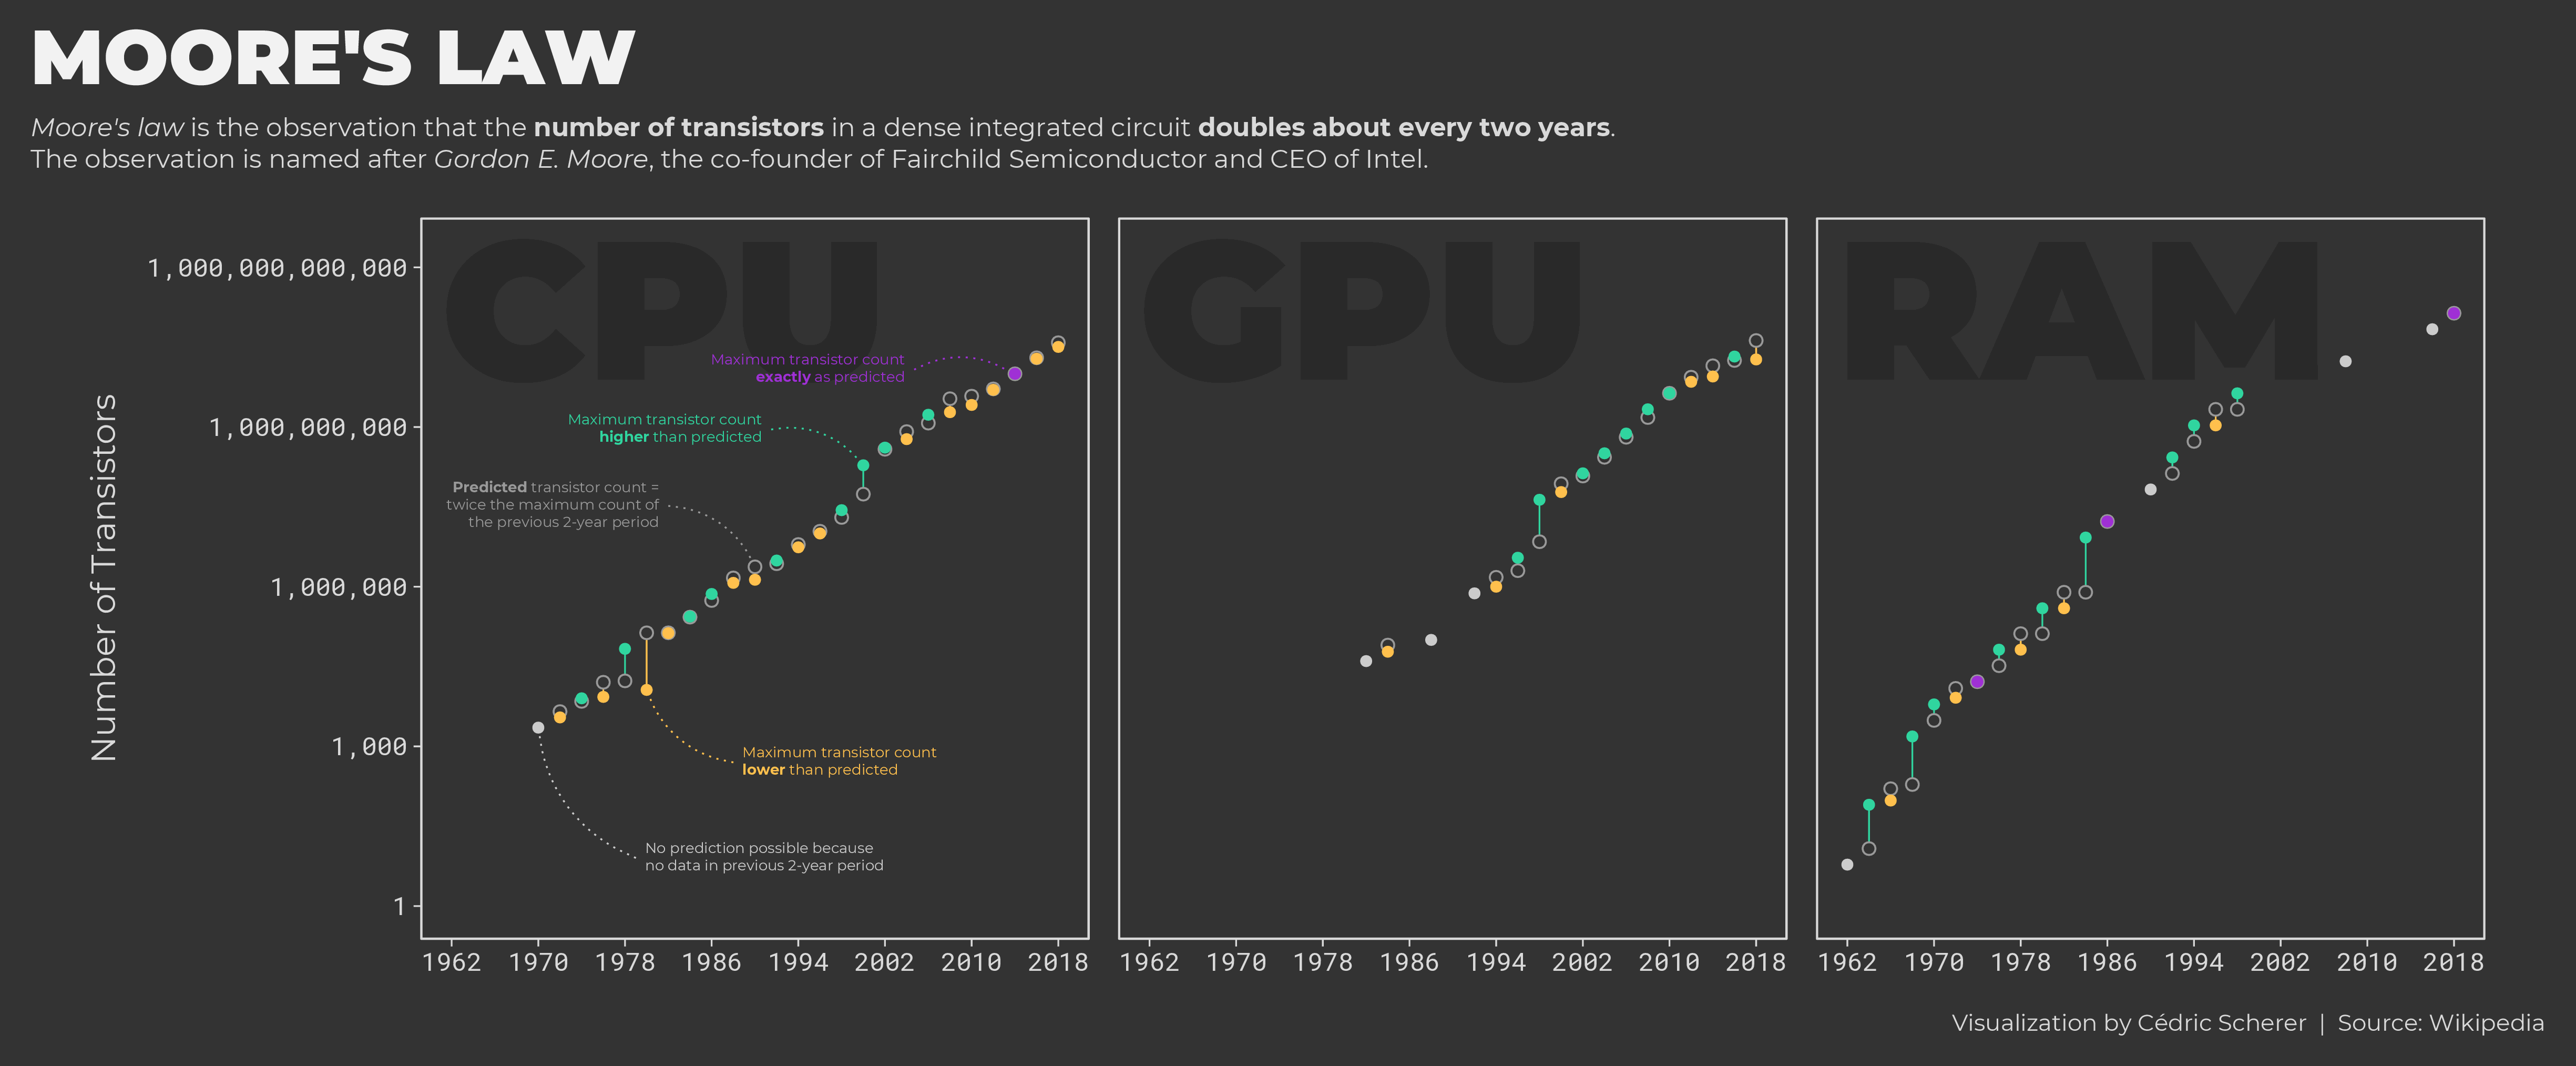
Week 2019/36️ 🖥️ Moore's Law by Wikipedia

./plots/2019_36/2019_36_MooresLaw_double.png


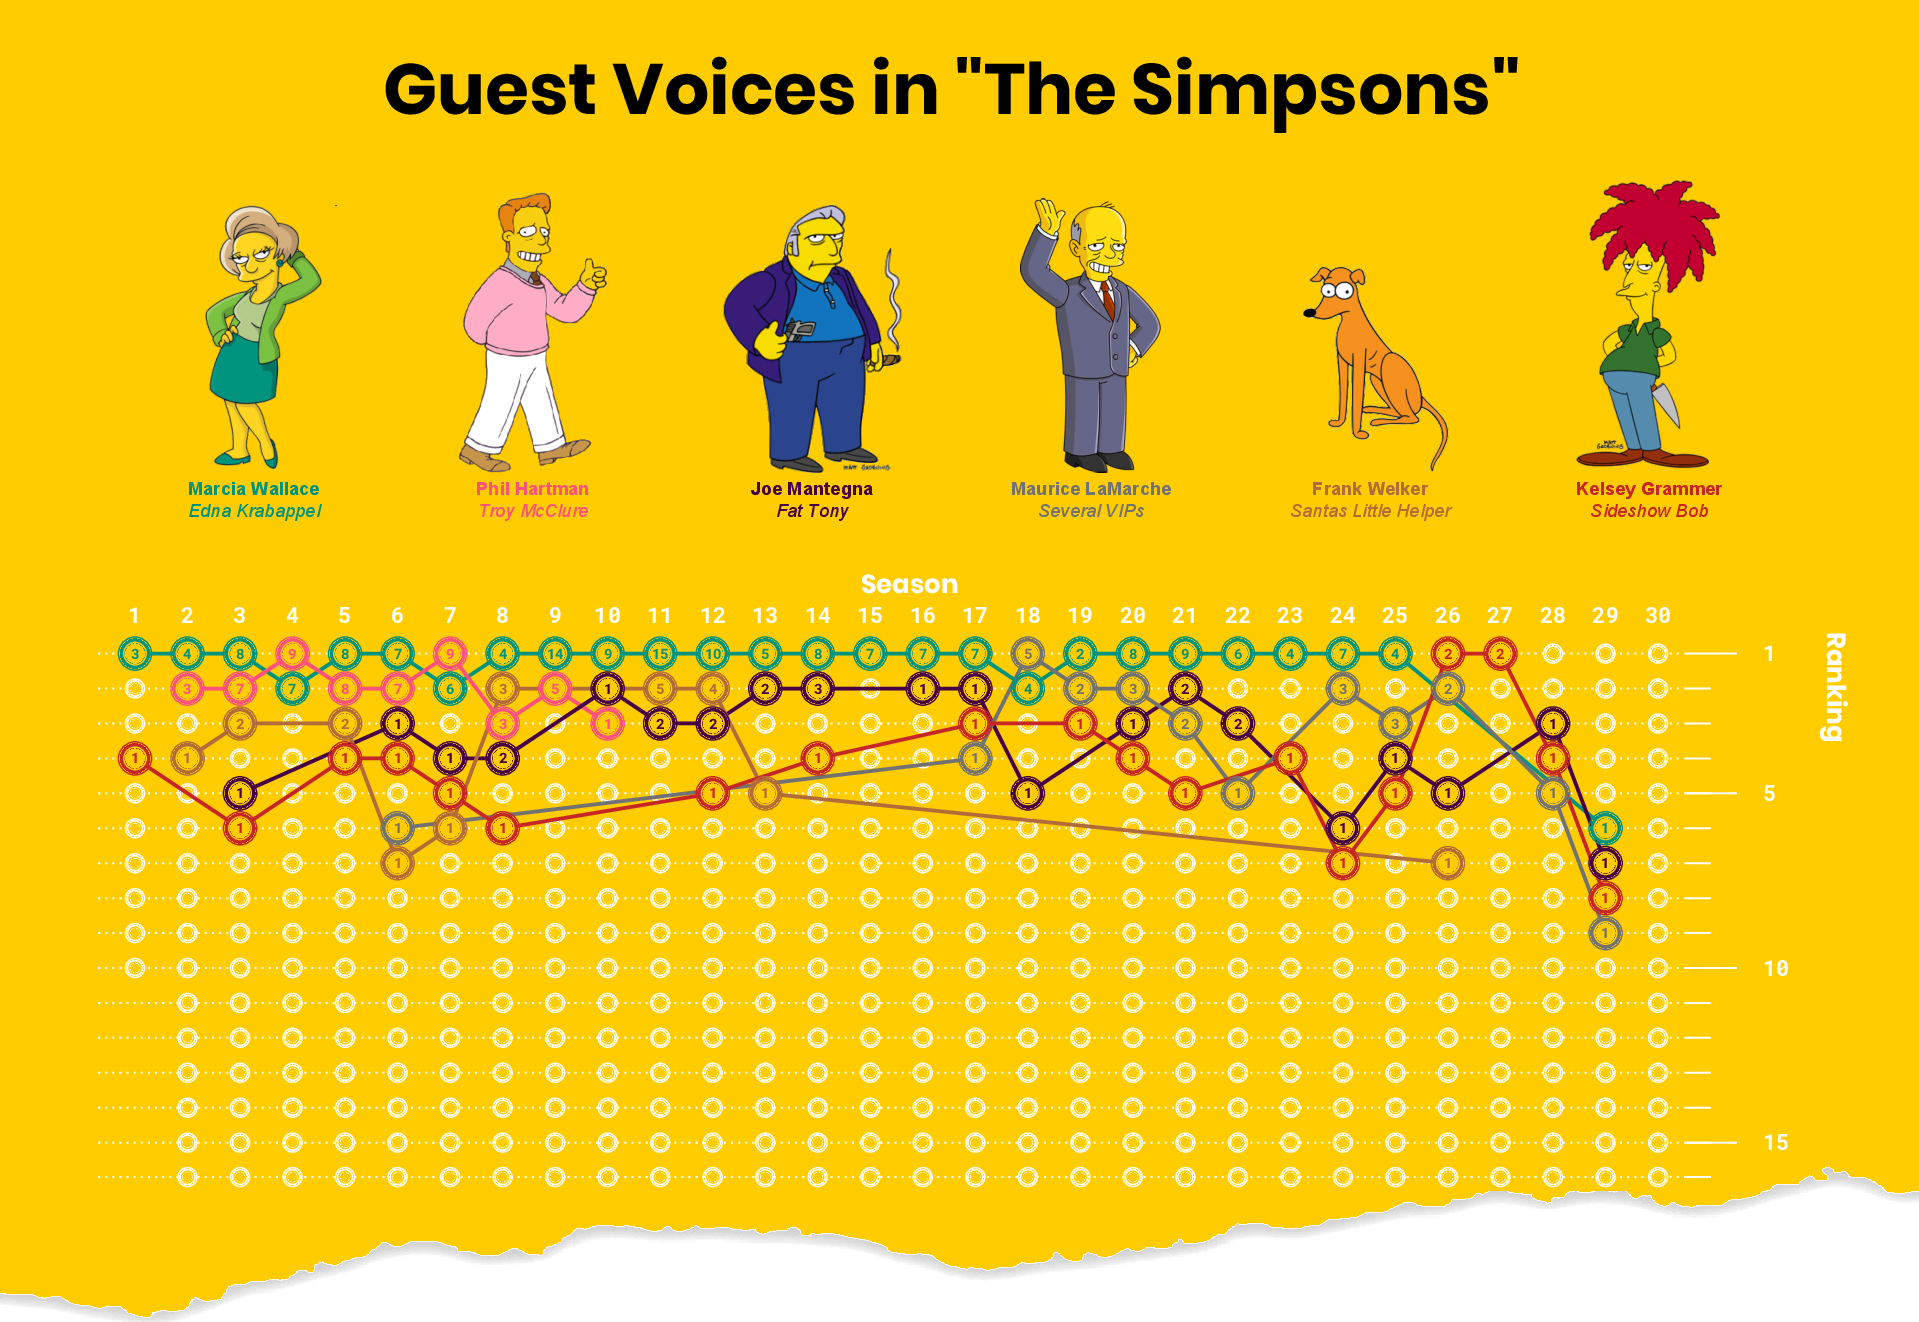
Week 2019/35️ 💛 Simpsons Guest Stars by Wikipedia

./plots/2019_35/2019_35_SimpsonsGuests_teaser.png


Week 2019/34️ ☢️ Nuclear Explosions by SIPRI

./plots/2019_34/2019_34_NuclearExplosions.png


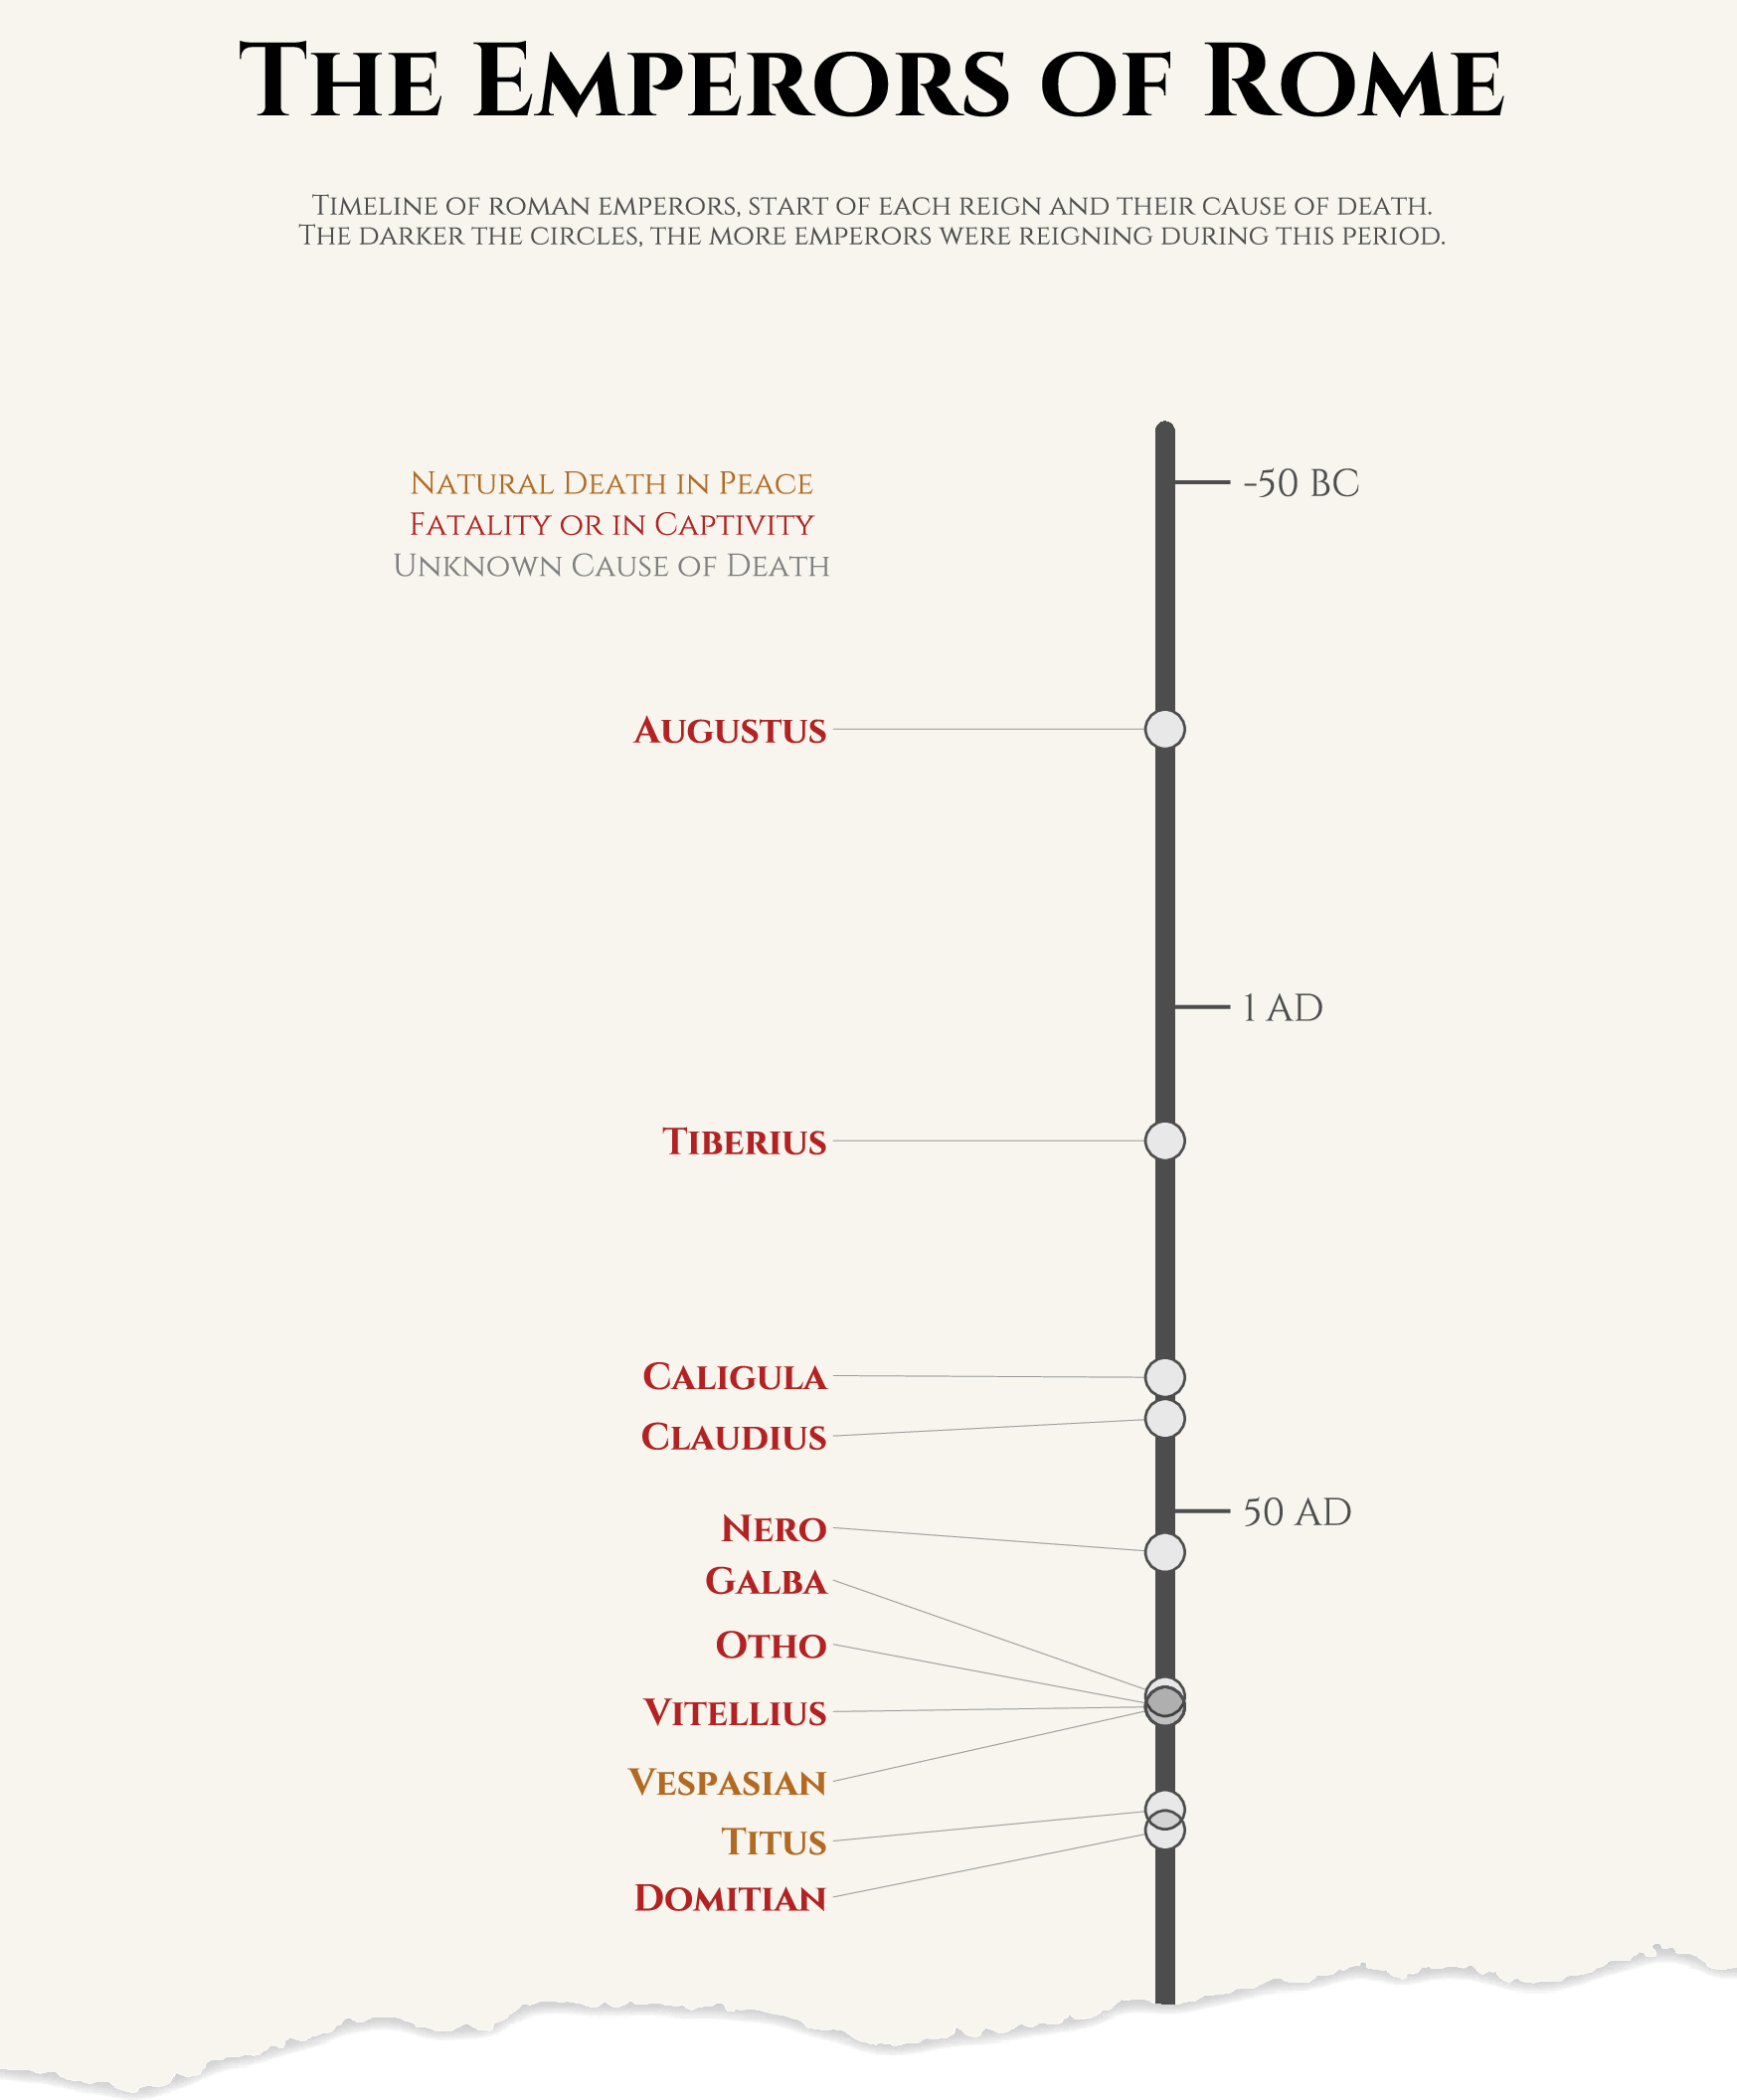
Week 2019/33️ 🌿 Roman Emperors by Wikipedia

./plots/2019_33/2019_33_RomanEmperors_teaser.png


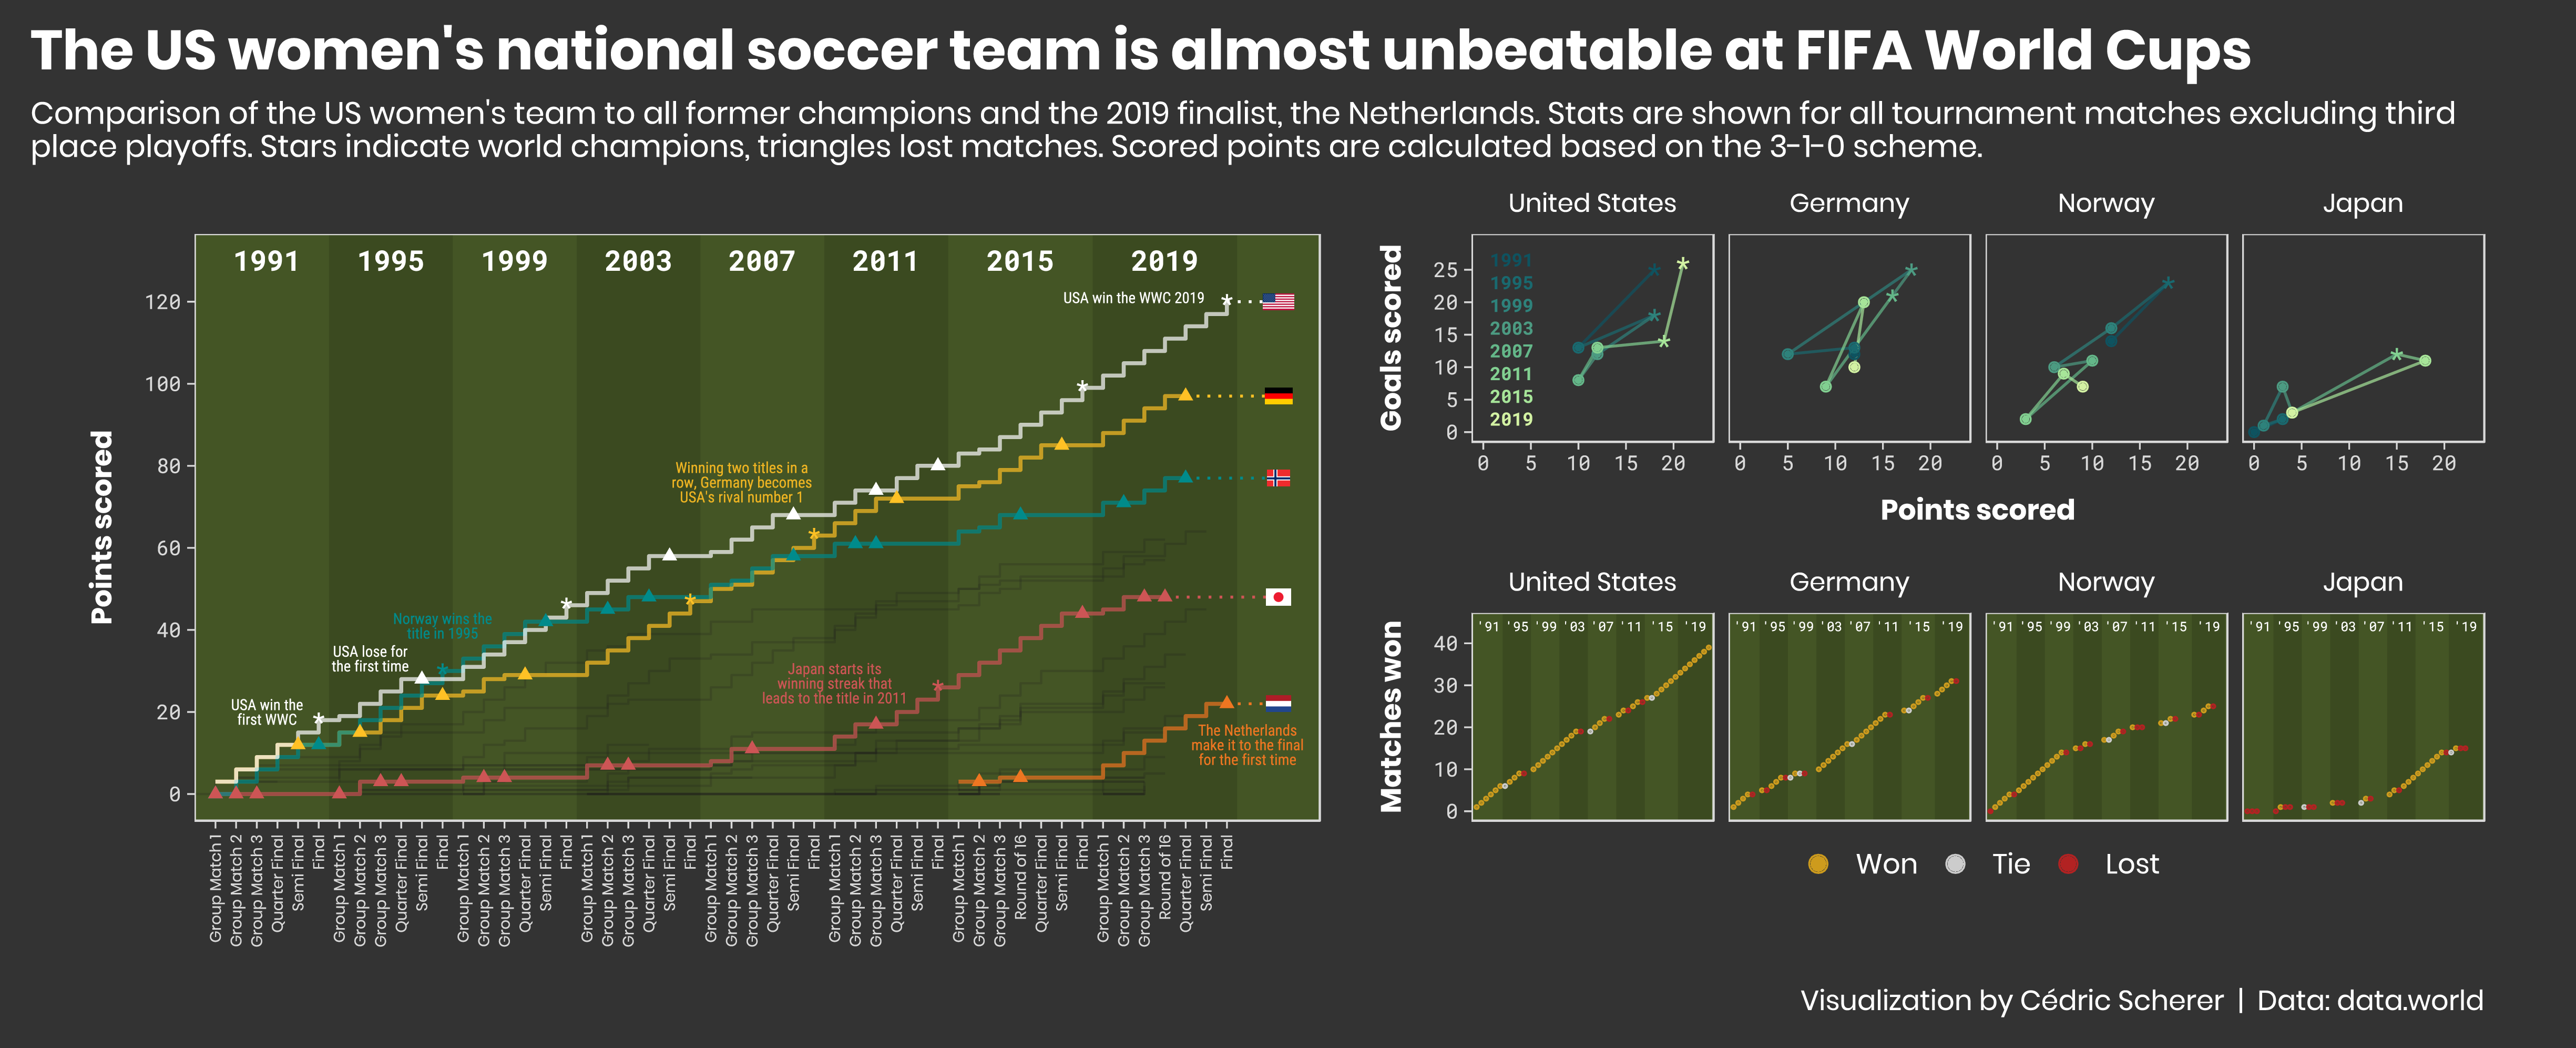
Week 2019/28️ ⚽ FIFA Women's World Cups by data.world

./plots/2019_28/2019_28_FIFA_WWCs.png ./plots/2019_28/2019_28_FIFA_WWCs_stellar_teaser.png


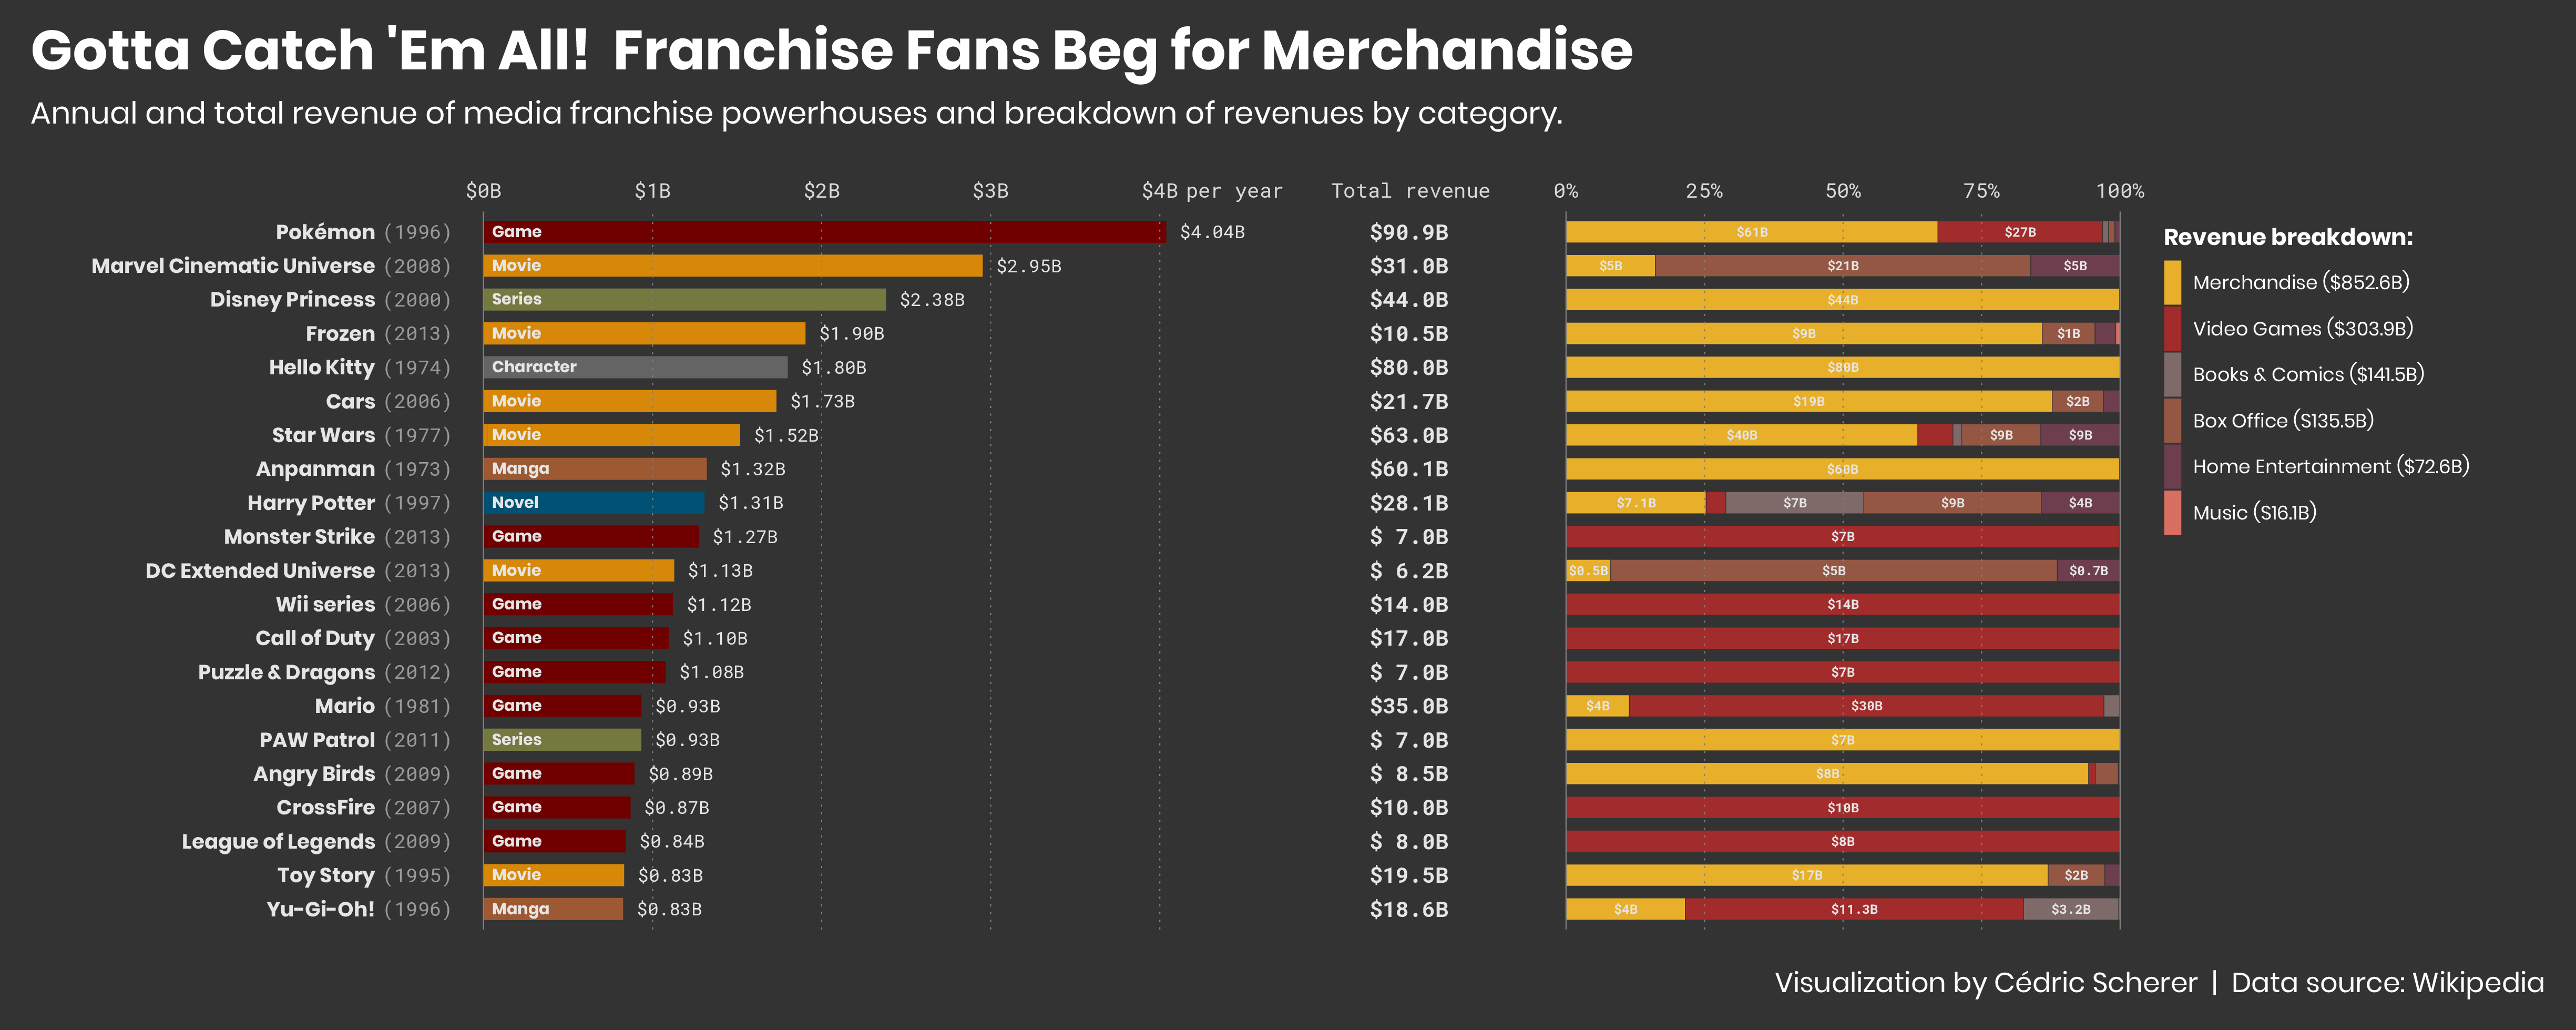
Week 2019/27️ 💰 Media Franchise Revenues by Wikipedia

./plots/2019_27/2019_27_FranchiseRevenue.png


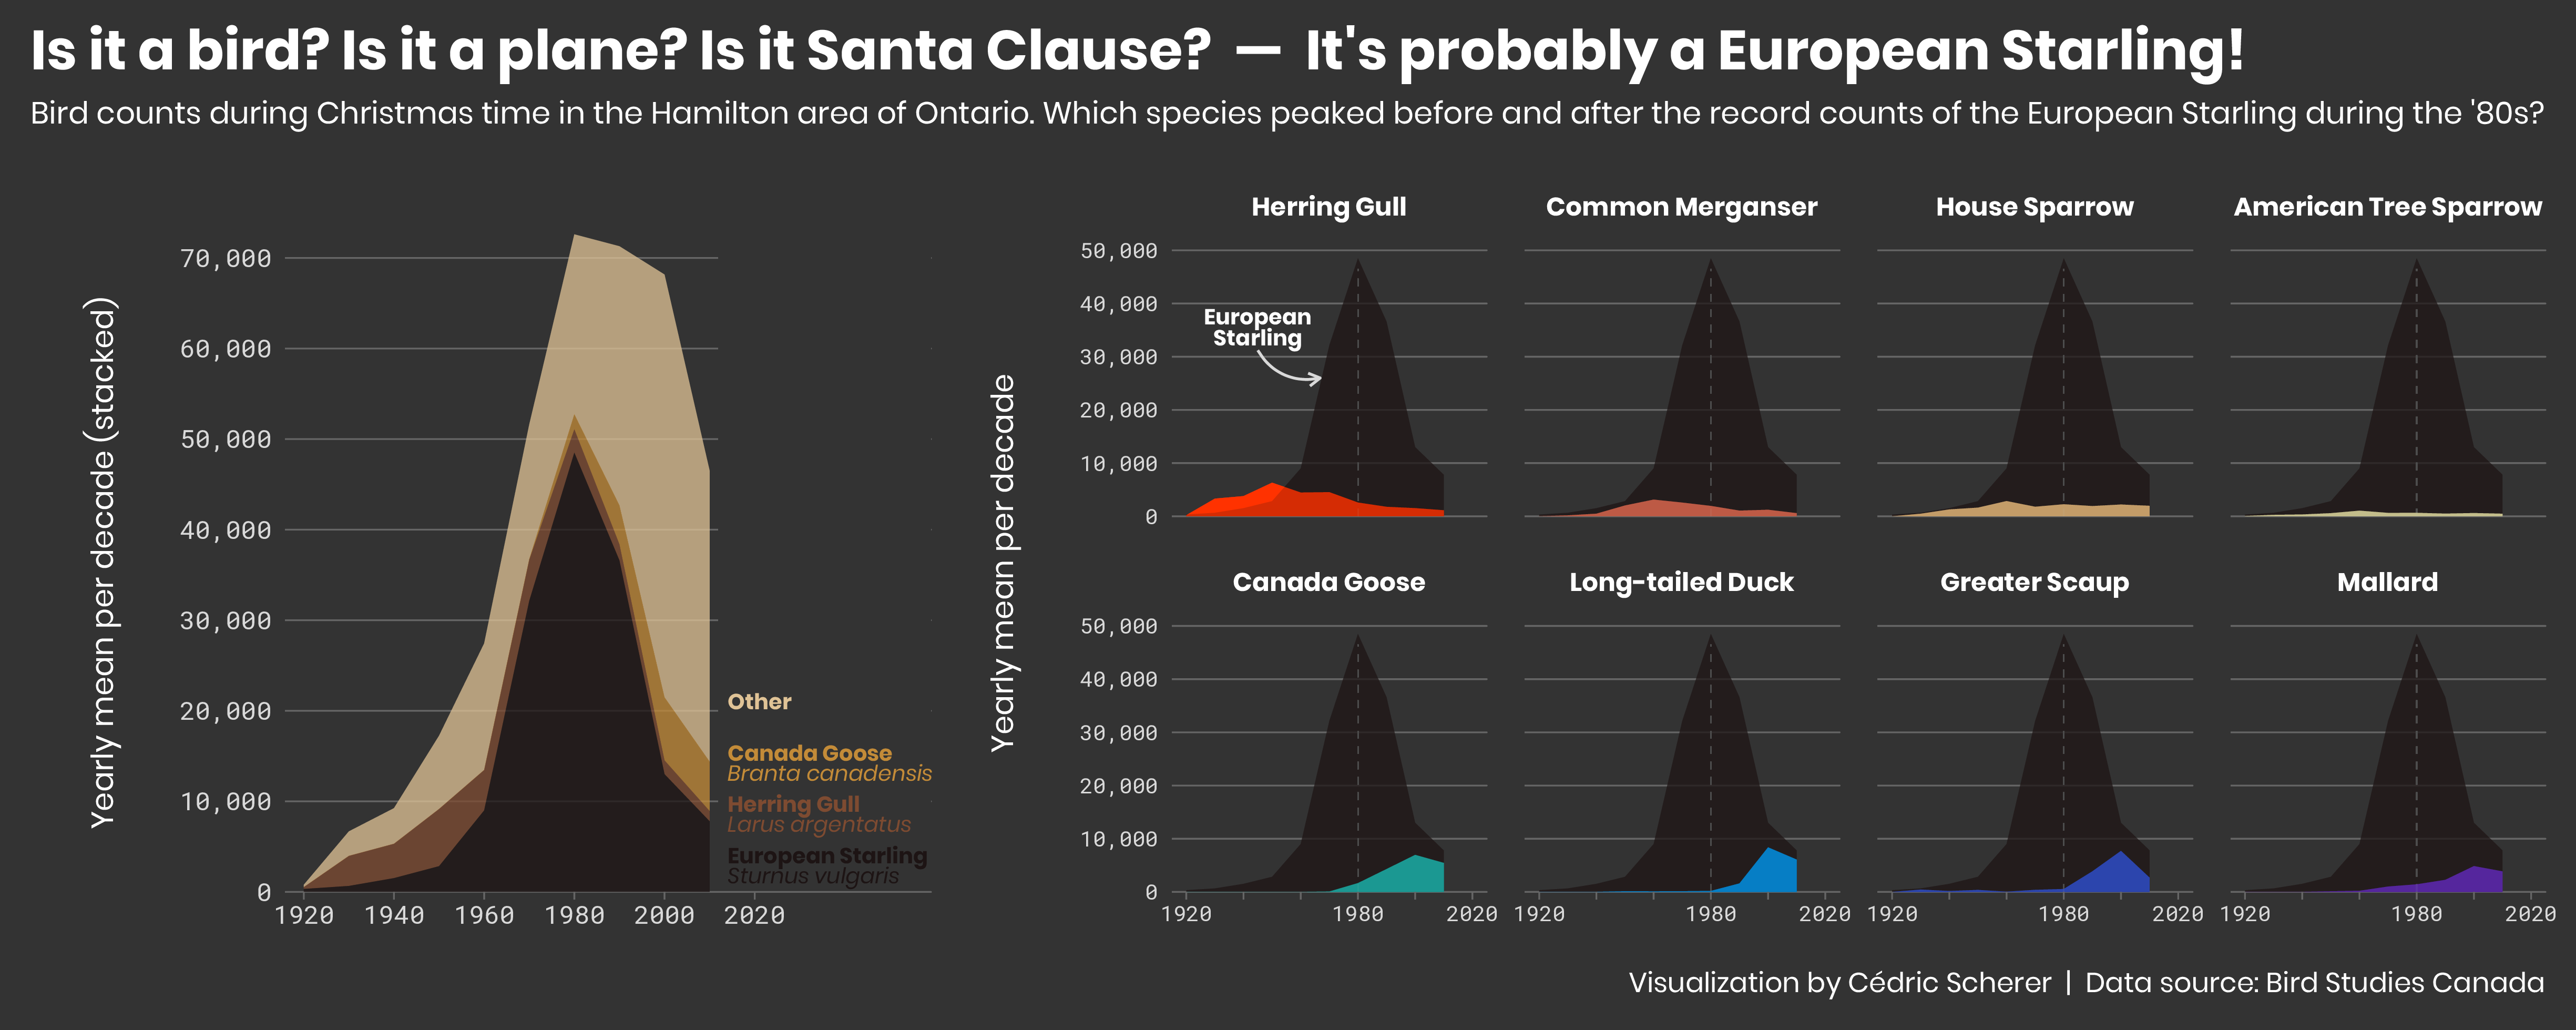
Week 2019/25 🐦 Christmas Bird Counts by Bird Studies Canada

./plots/2019_25/2019_25_BirdsXmas.png


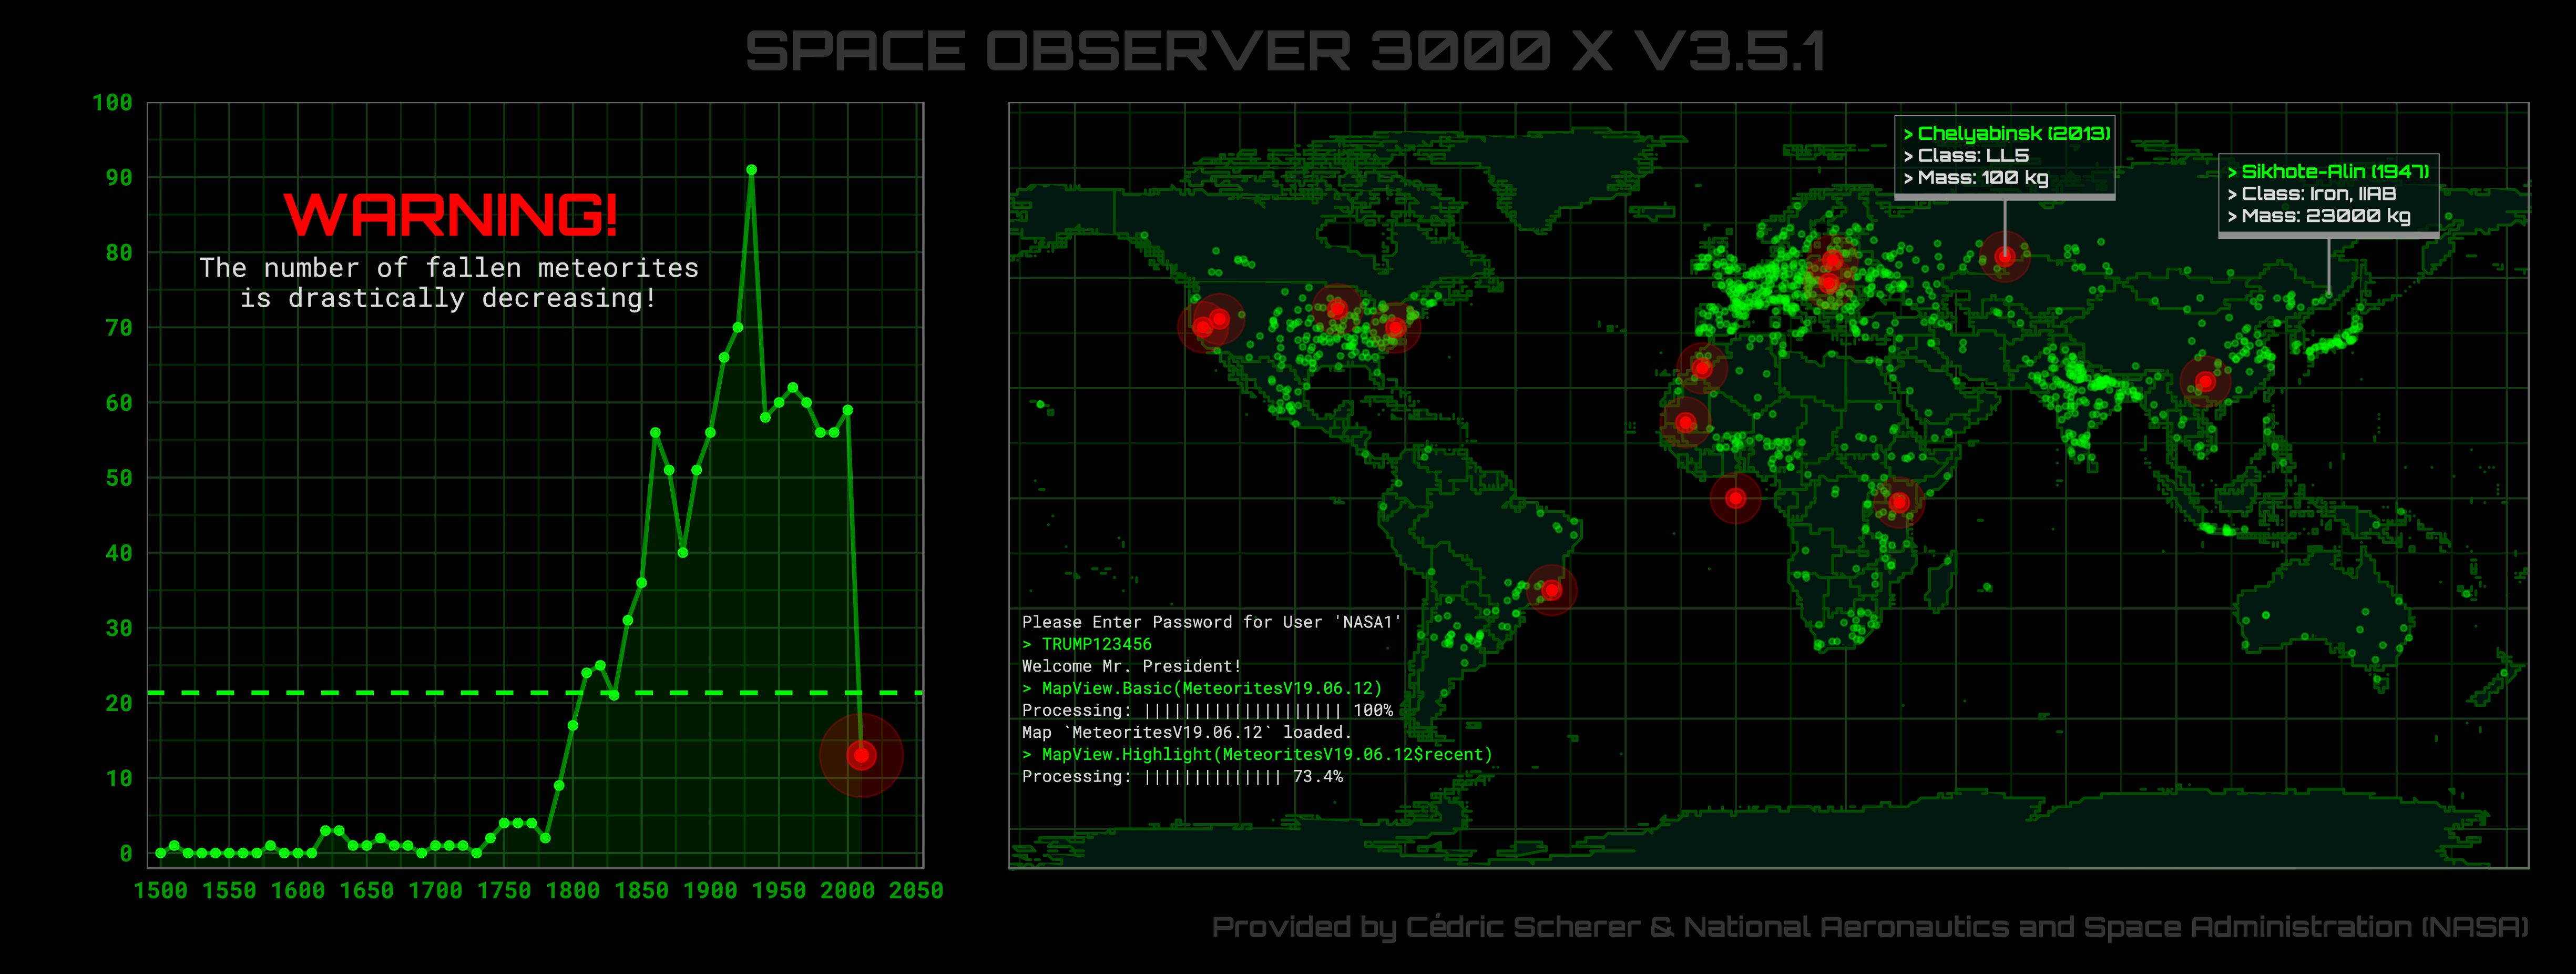
Week 2019/24 🌠 Meteorites by NASA

./plots/2019_24/2019_24_Meteorites.png


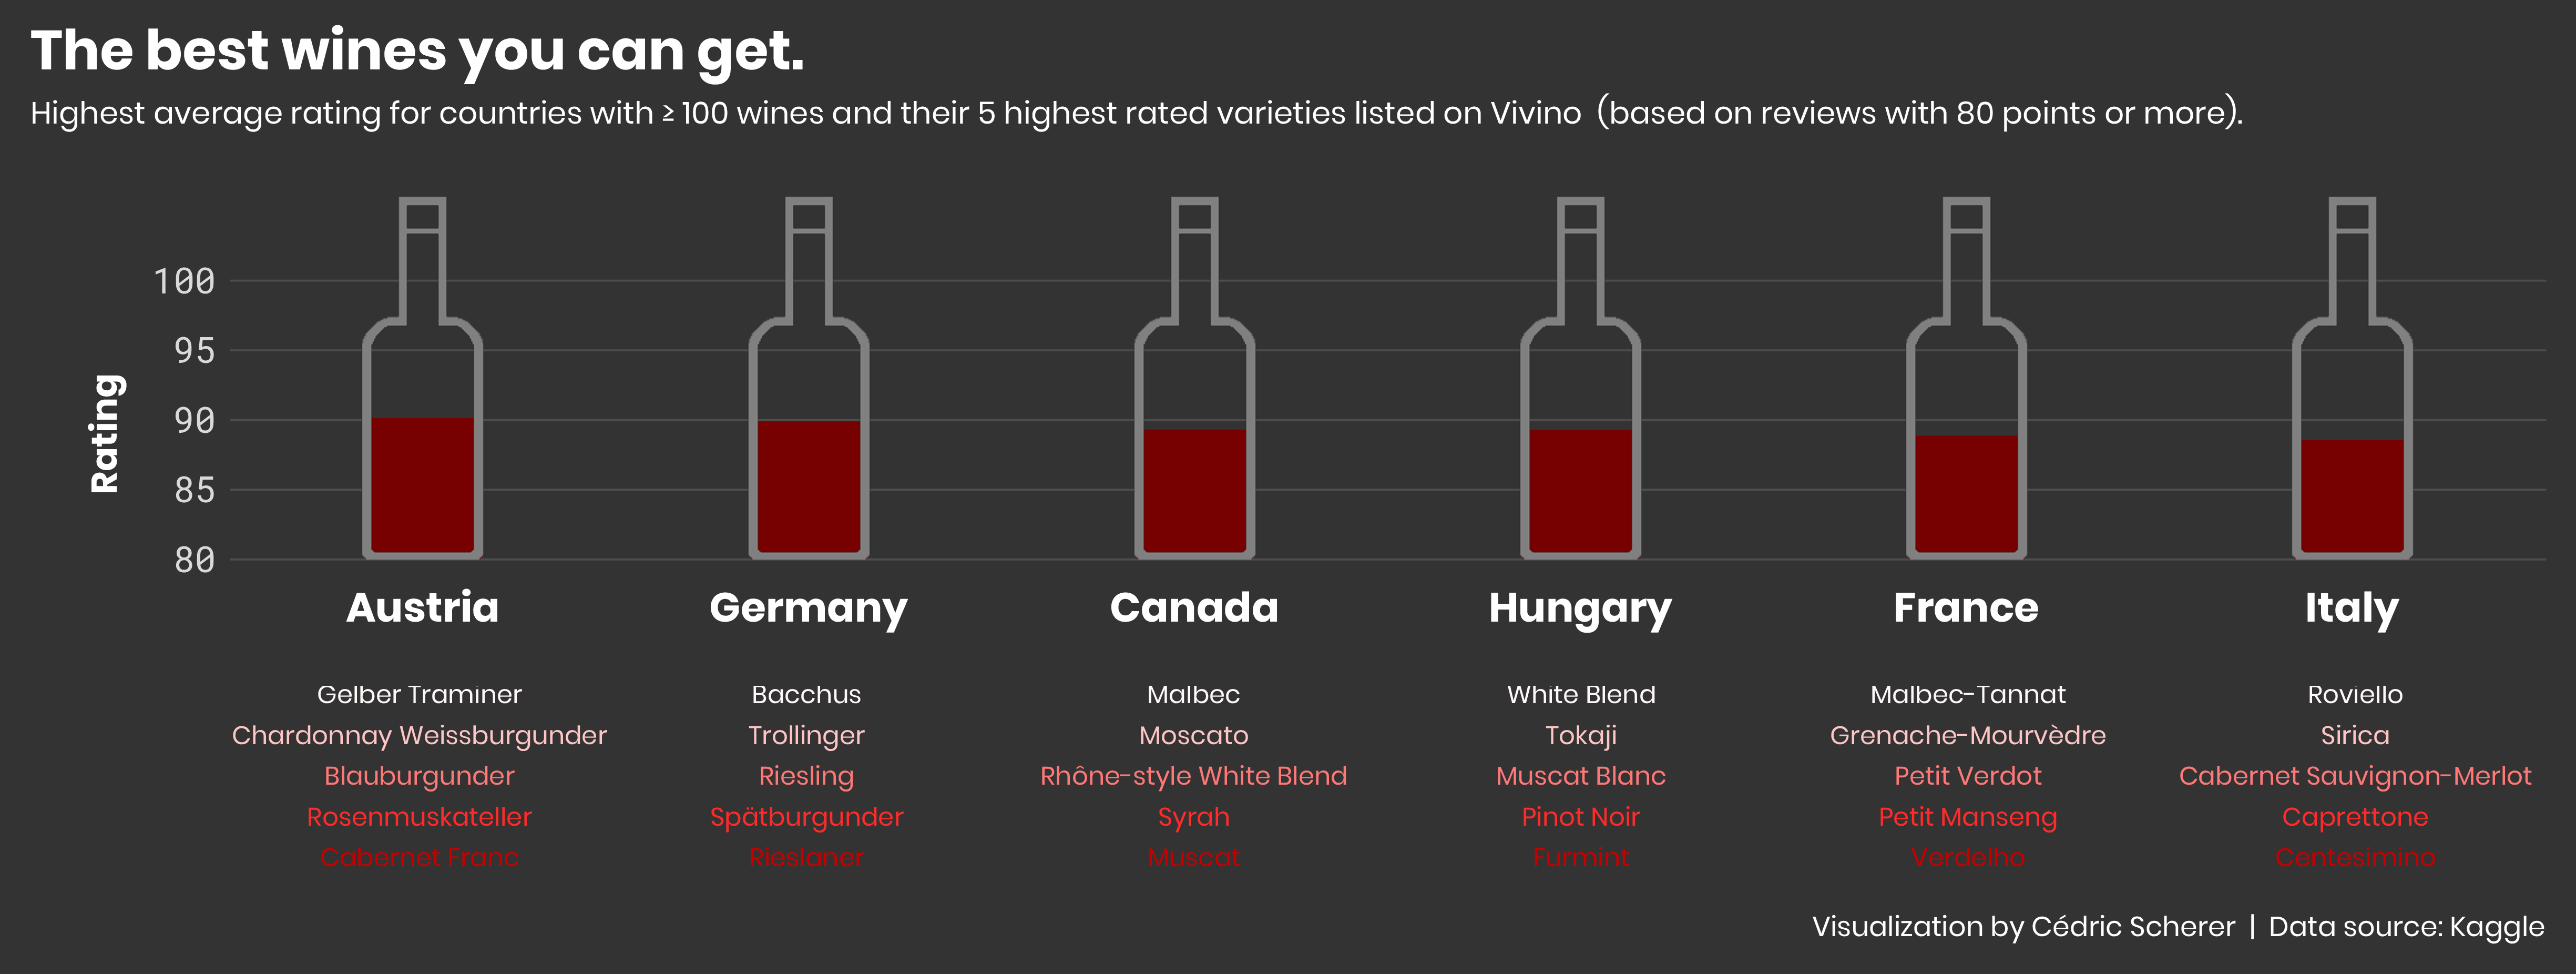
Week 2019/22 🍷️ Wine Ratings by Vivino

./plots/2019_22/2019_22_Wines.png


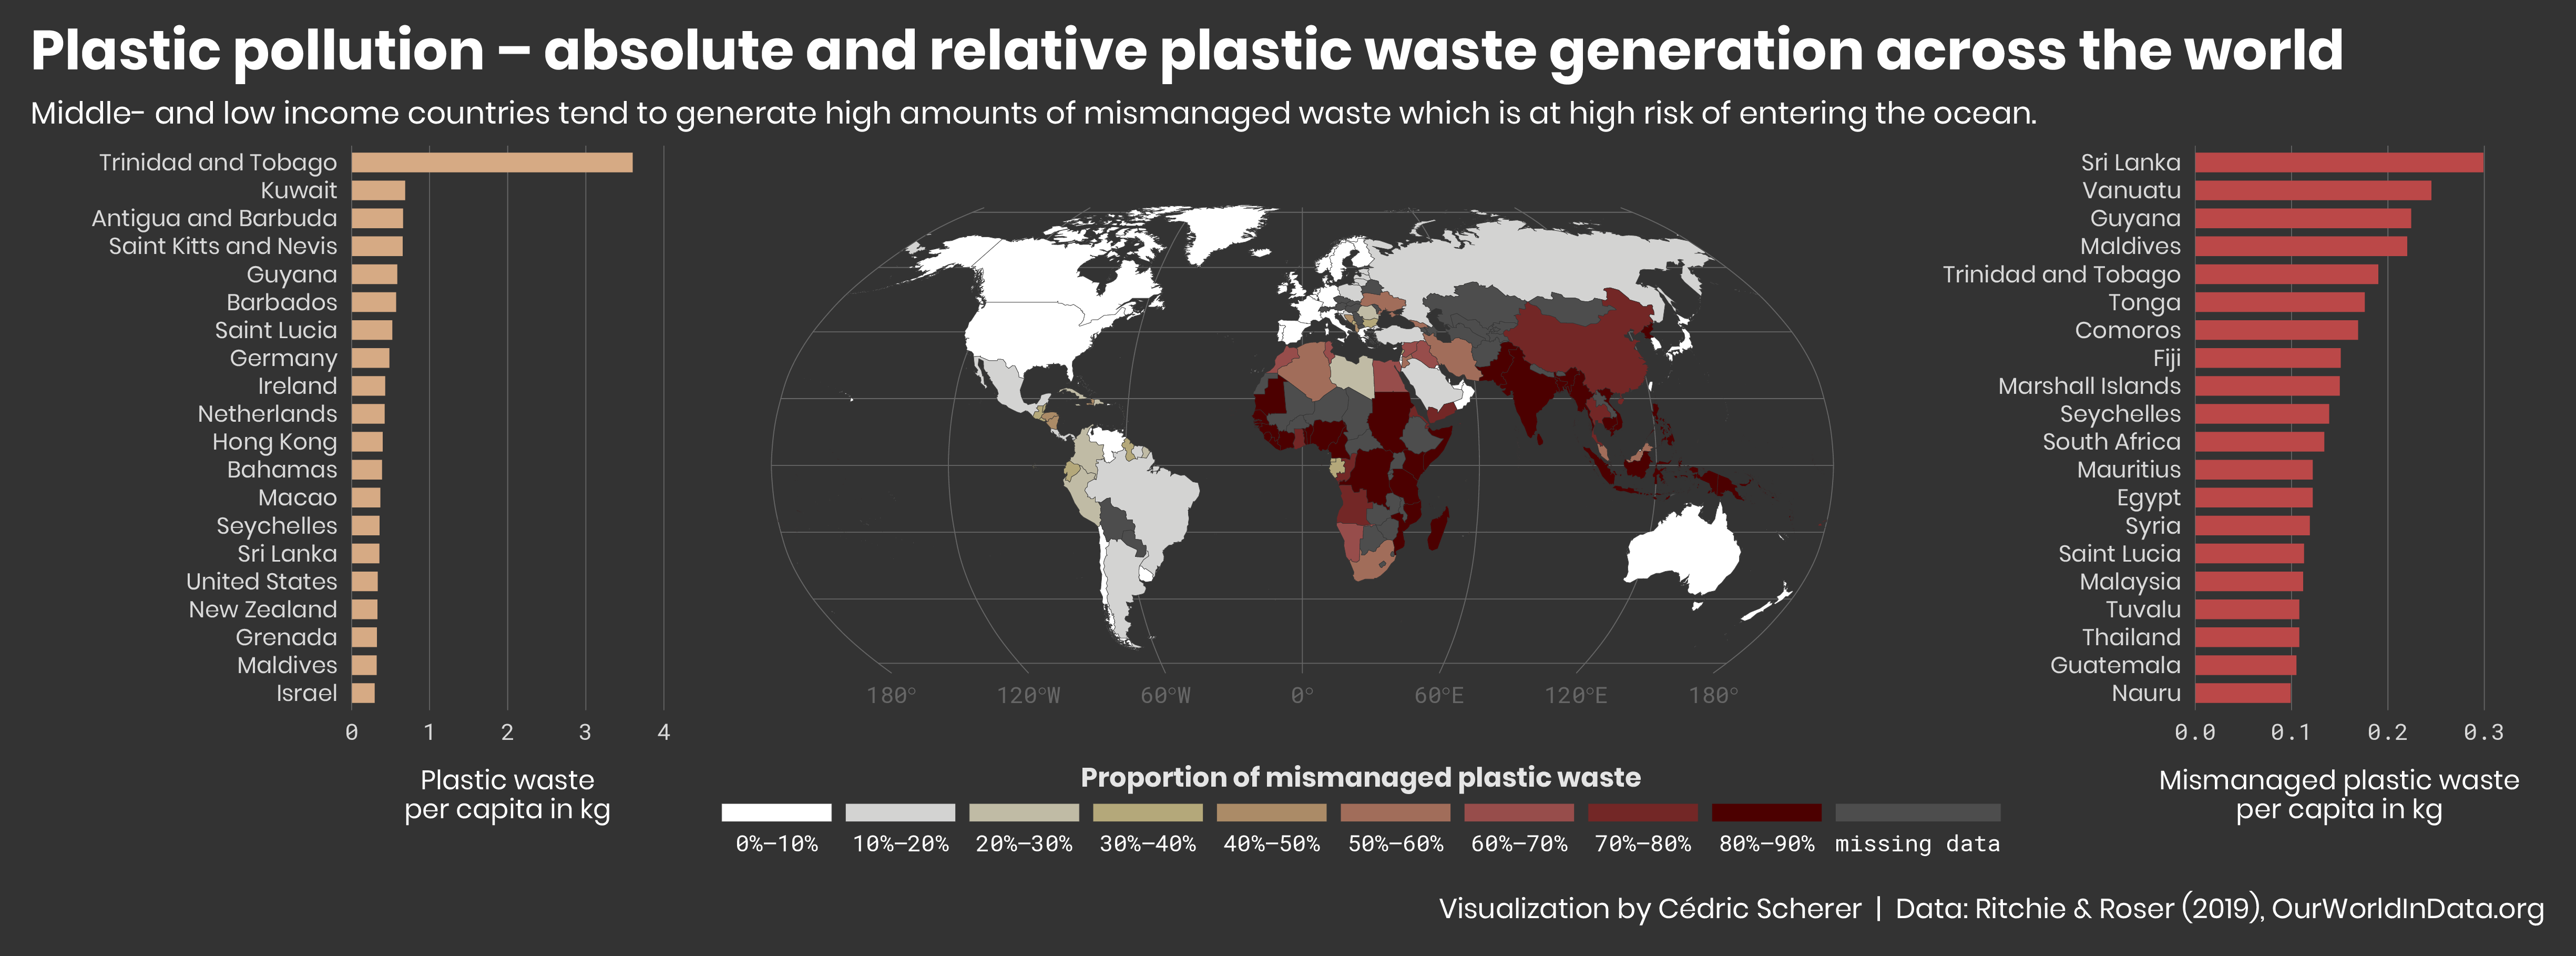
Week 2019/21️ 🚮 Global Plastic Waste by OurWorldInData.org

./plots/2019_21/2019_21_PlasticWaste.png


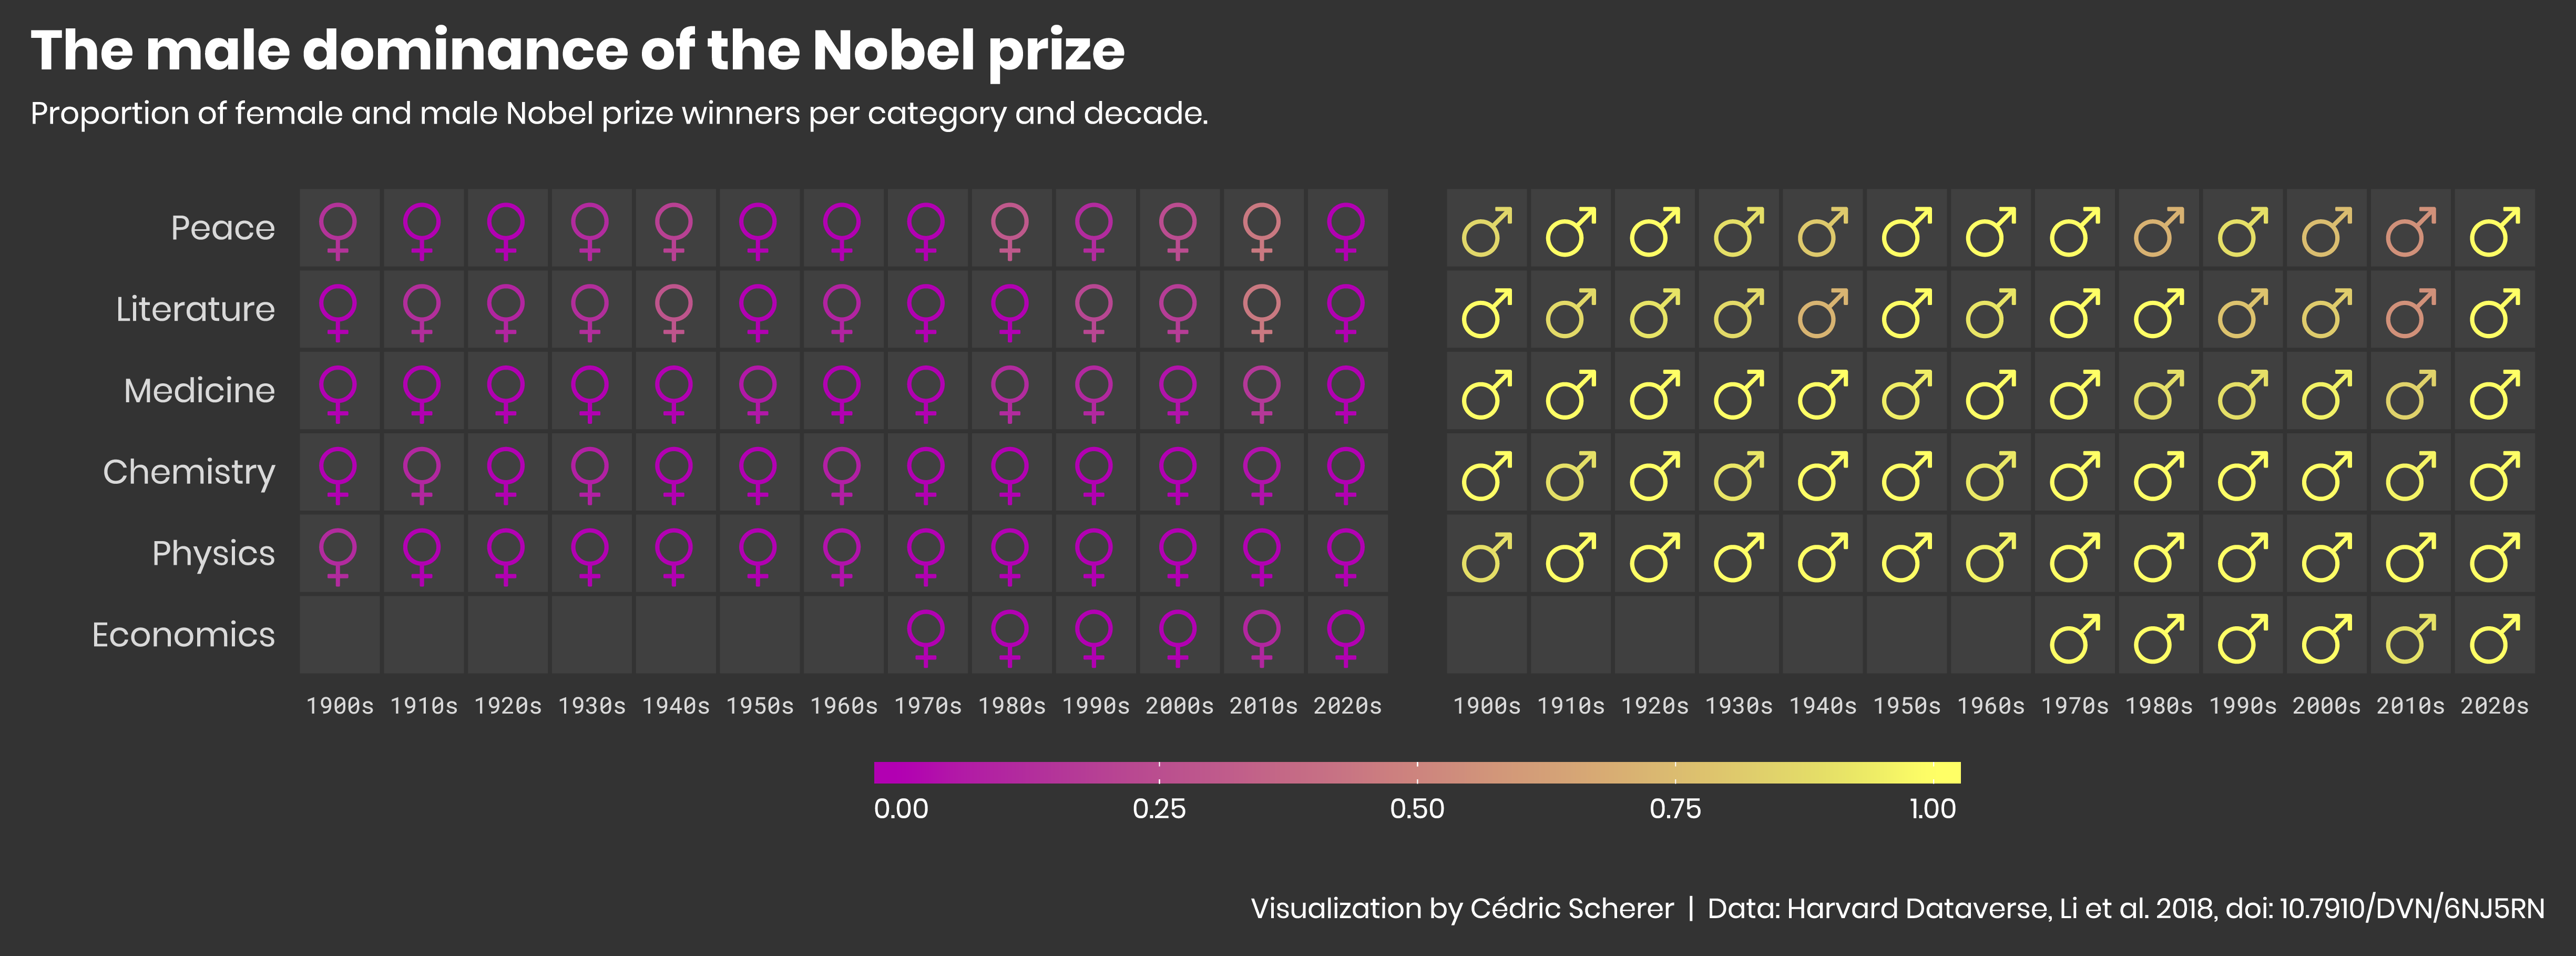
Week 2019/20 🎖️ Nobel Prize Winners by Harvard Dataverse

./plots/2019_20/2019_20_NobelPrizeWinners.png


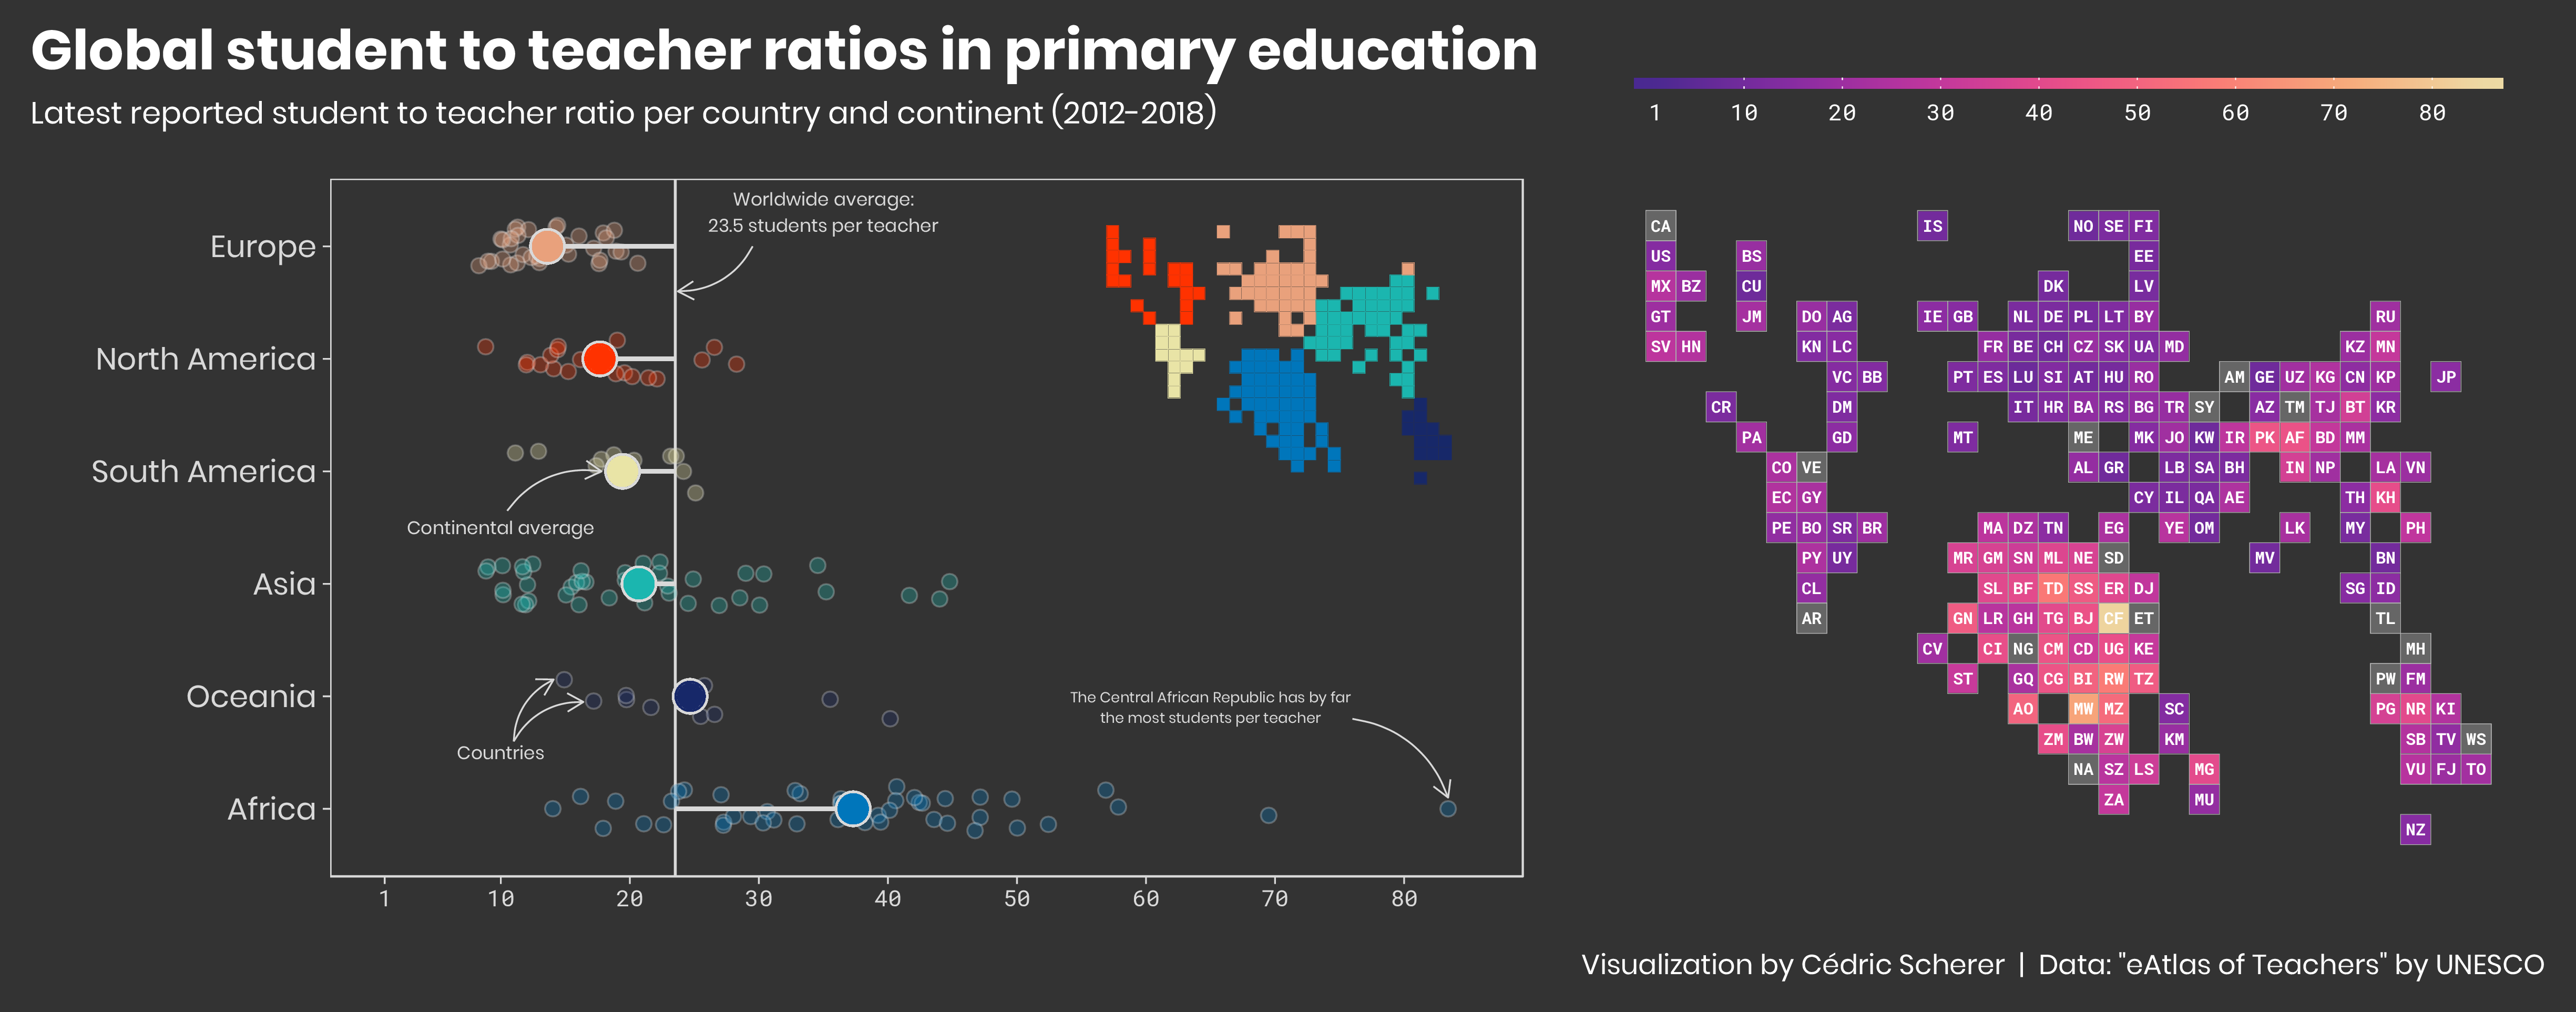
Week 2019/19️ 👨‍🏫 Global Student to Teachers Ratios by UNESCO's "eAtlas of Teachers"

./plots/2019_19/2019_19_StudentTeacher.png


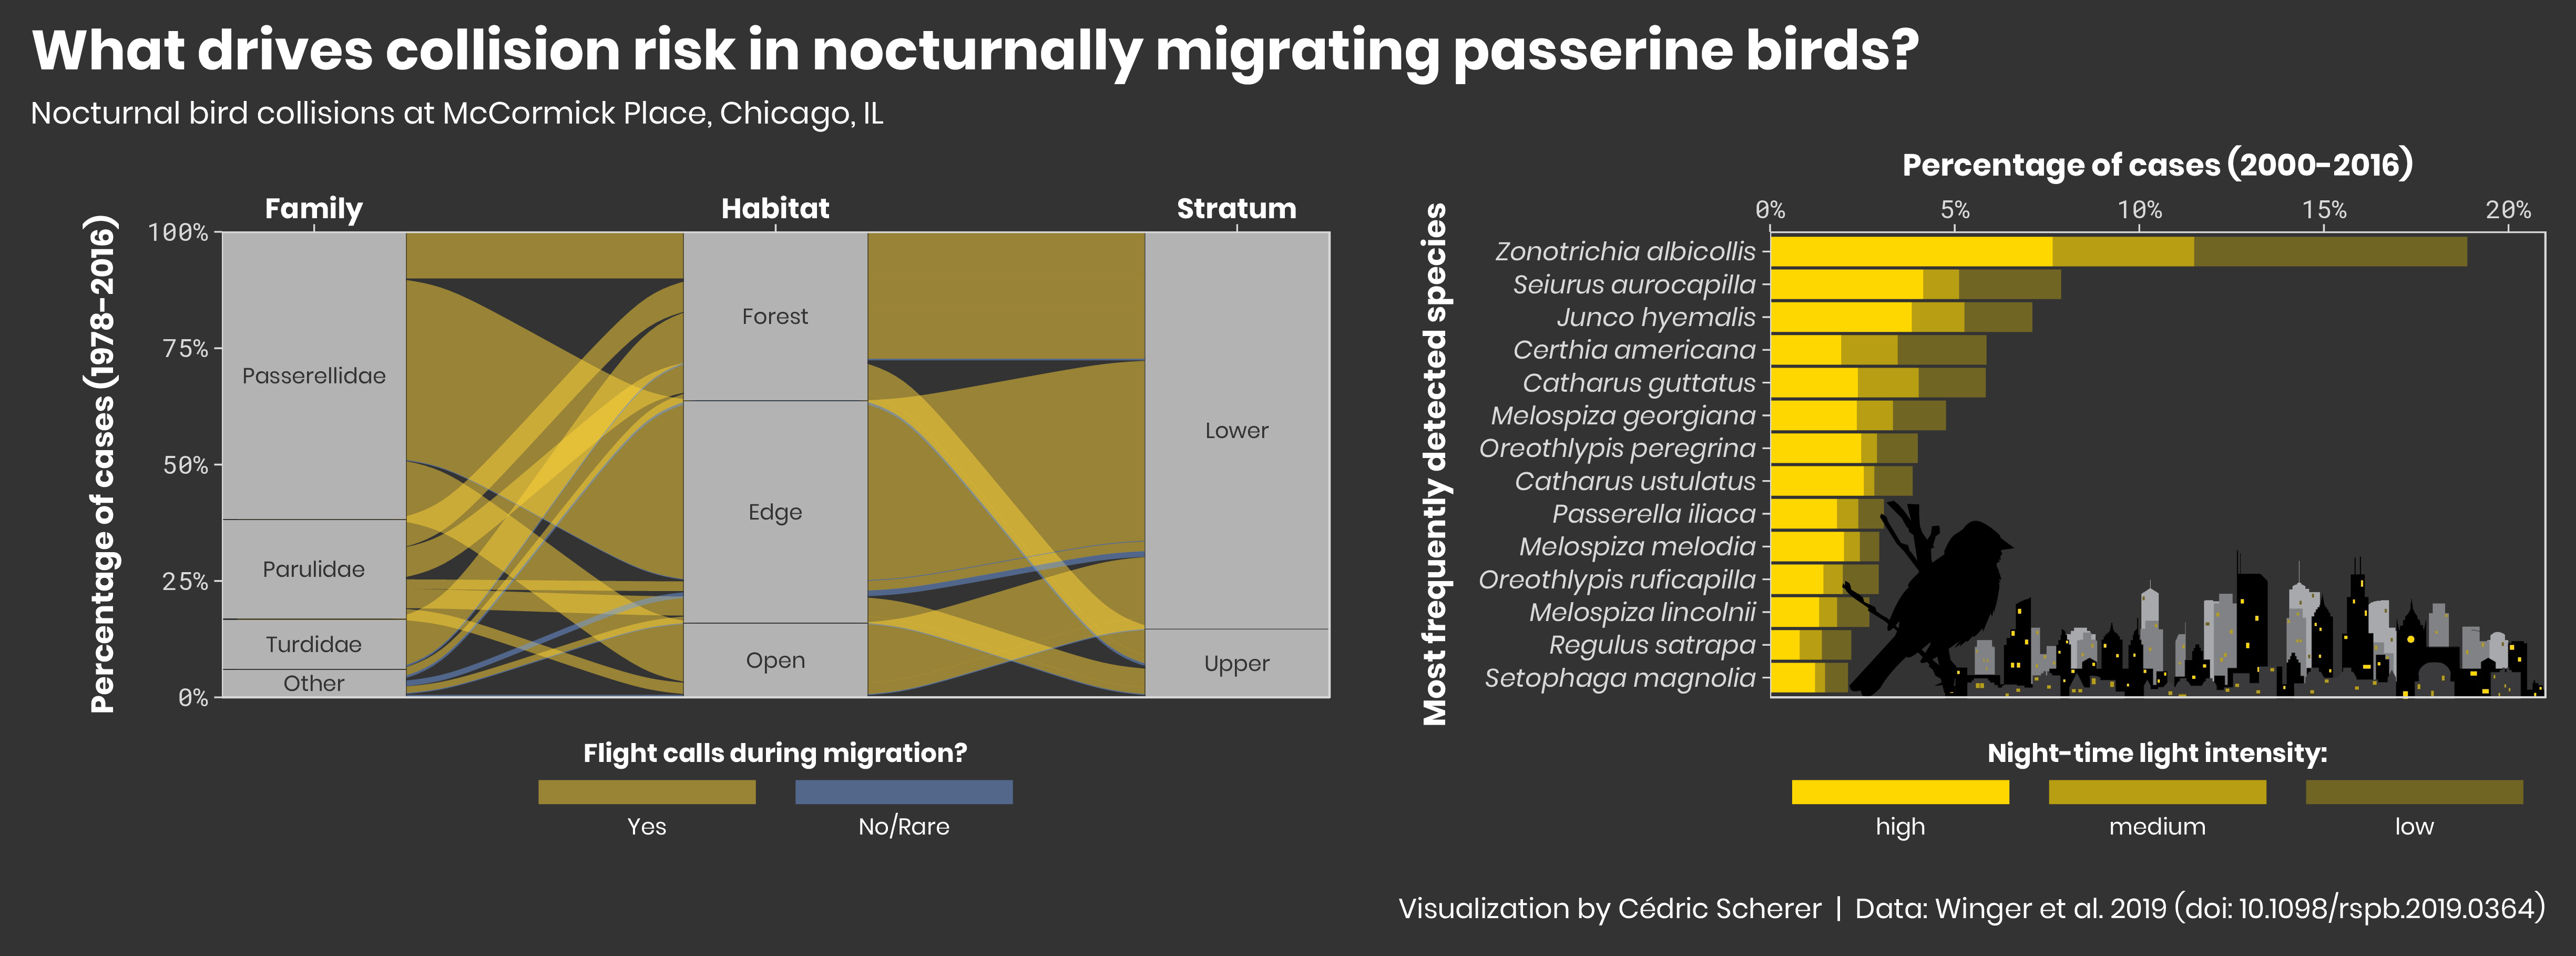
Week 2019/18️ 🐥 Chicago Bird Collisions by Winger et al. 2019

./plots/2019_18/2019_18_BirdCollisions.png


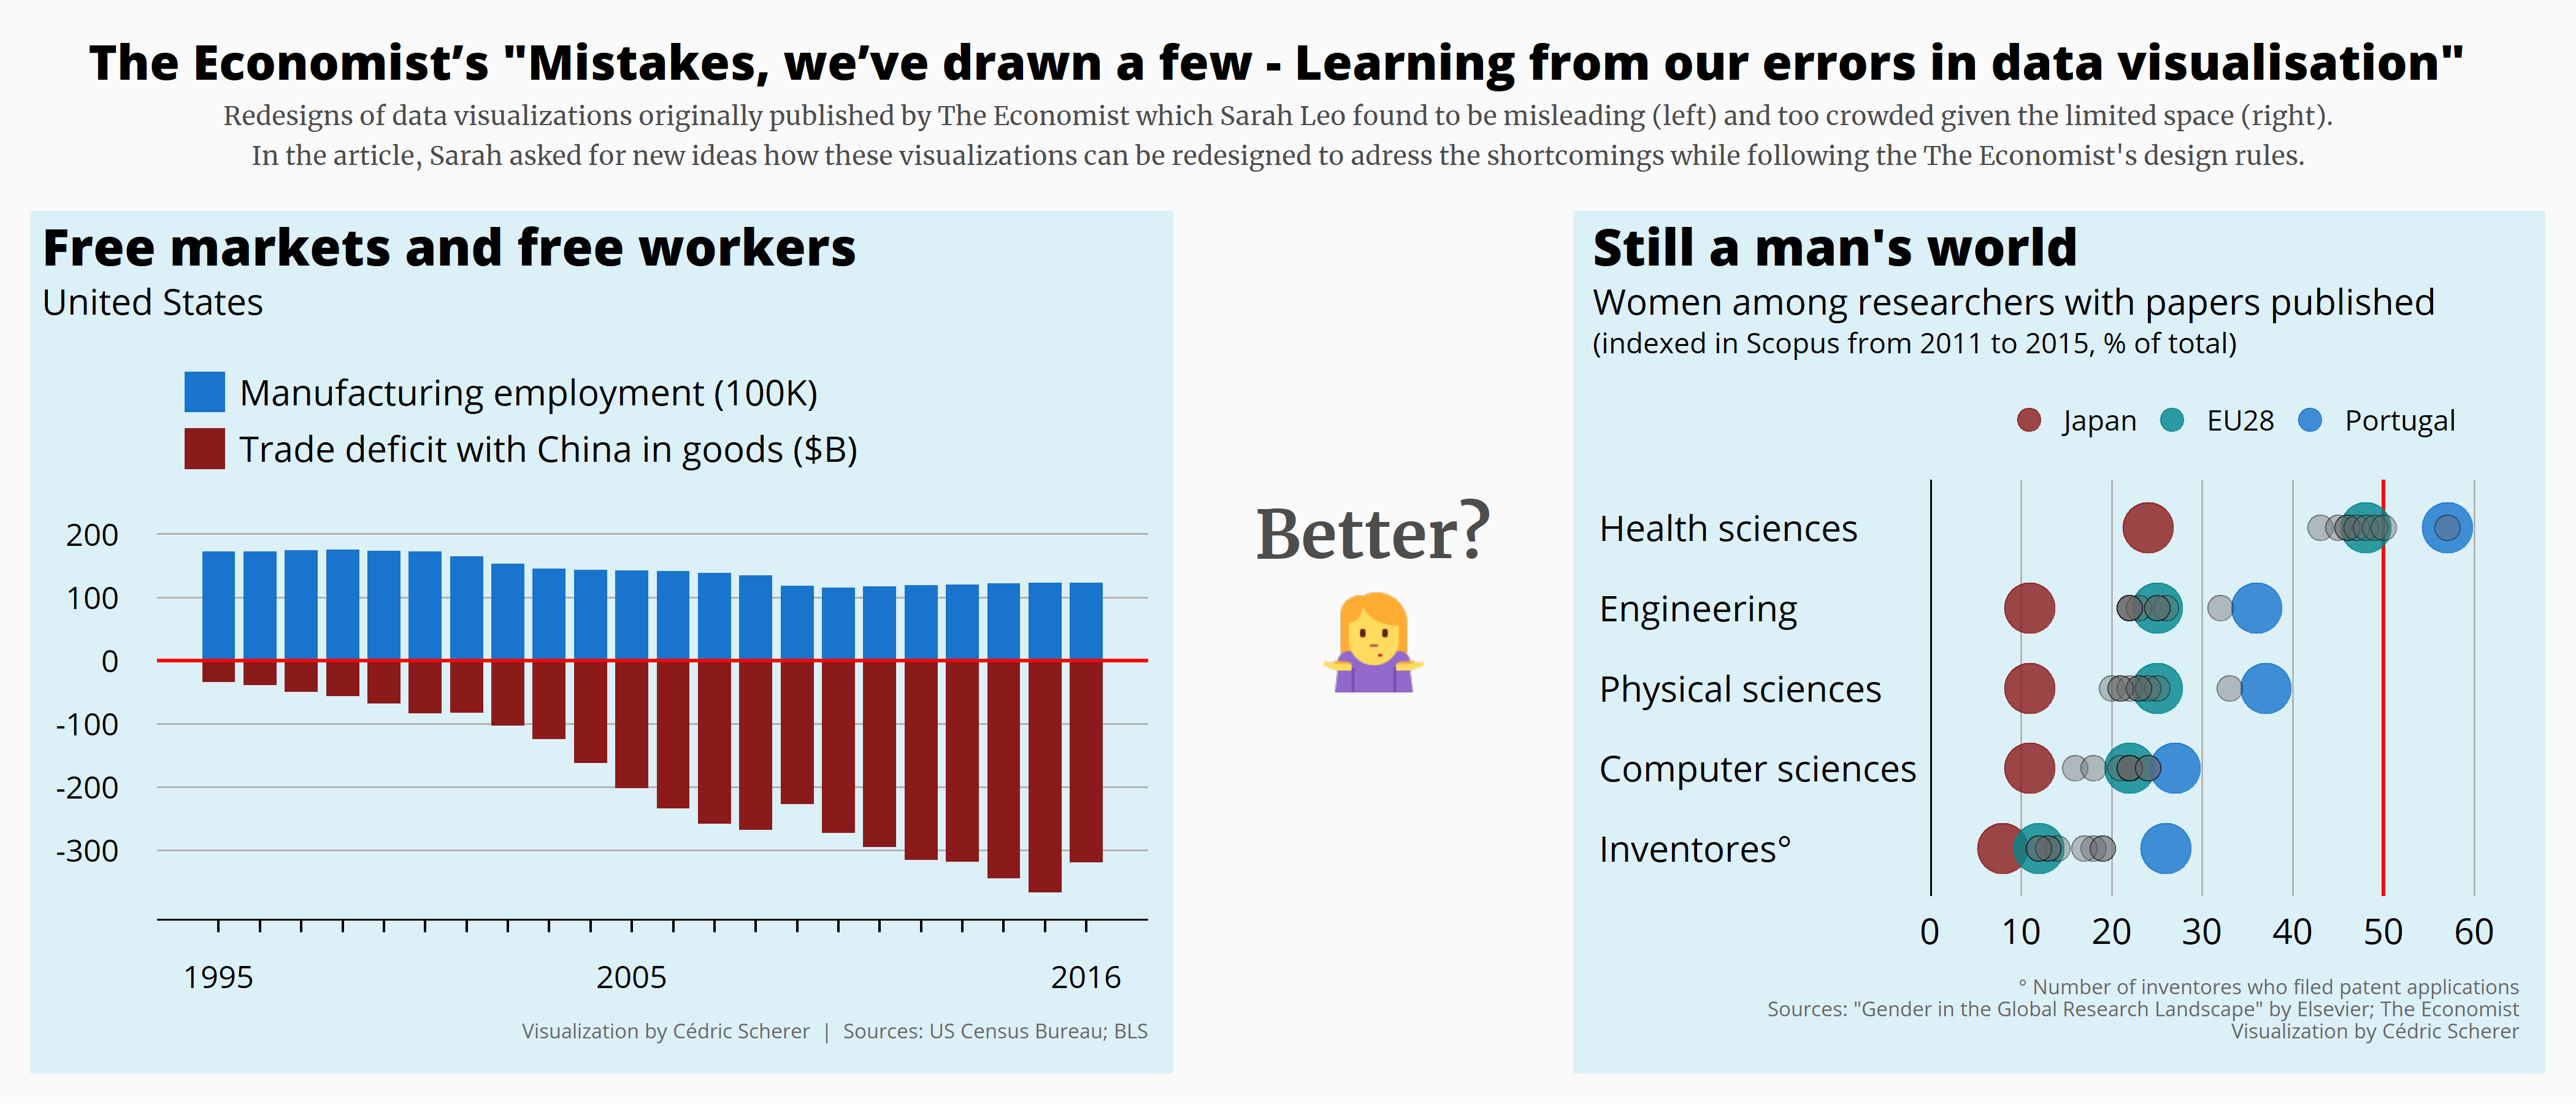
Week 2019/16️ 📊 Data Viz Mistakes by The Economist

./plots/2019_16/2019_16_DataVizMistakes_light.png


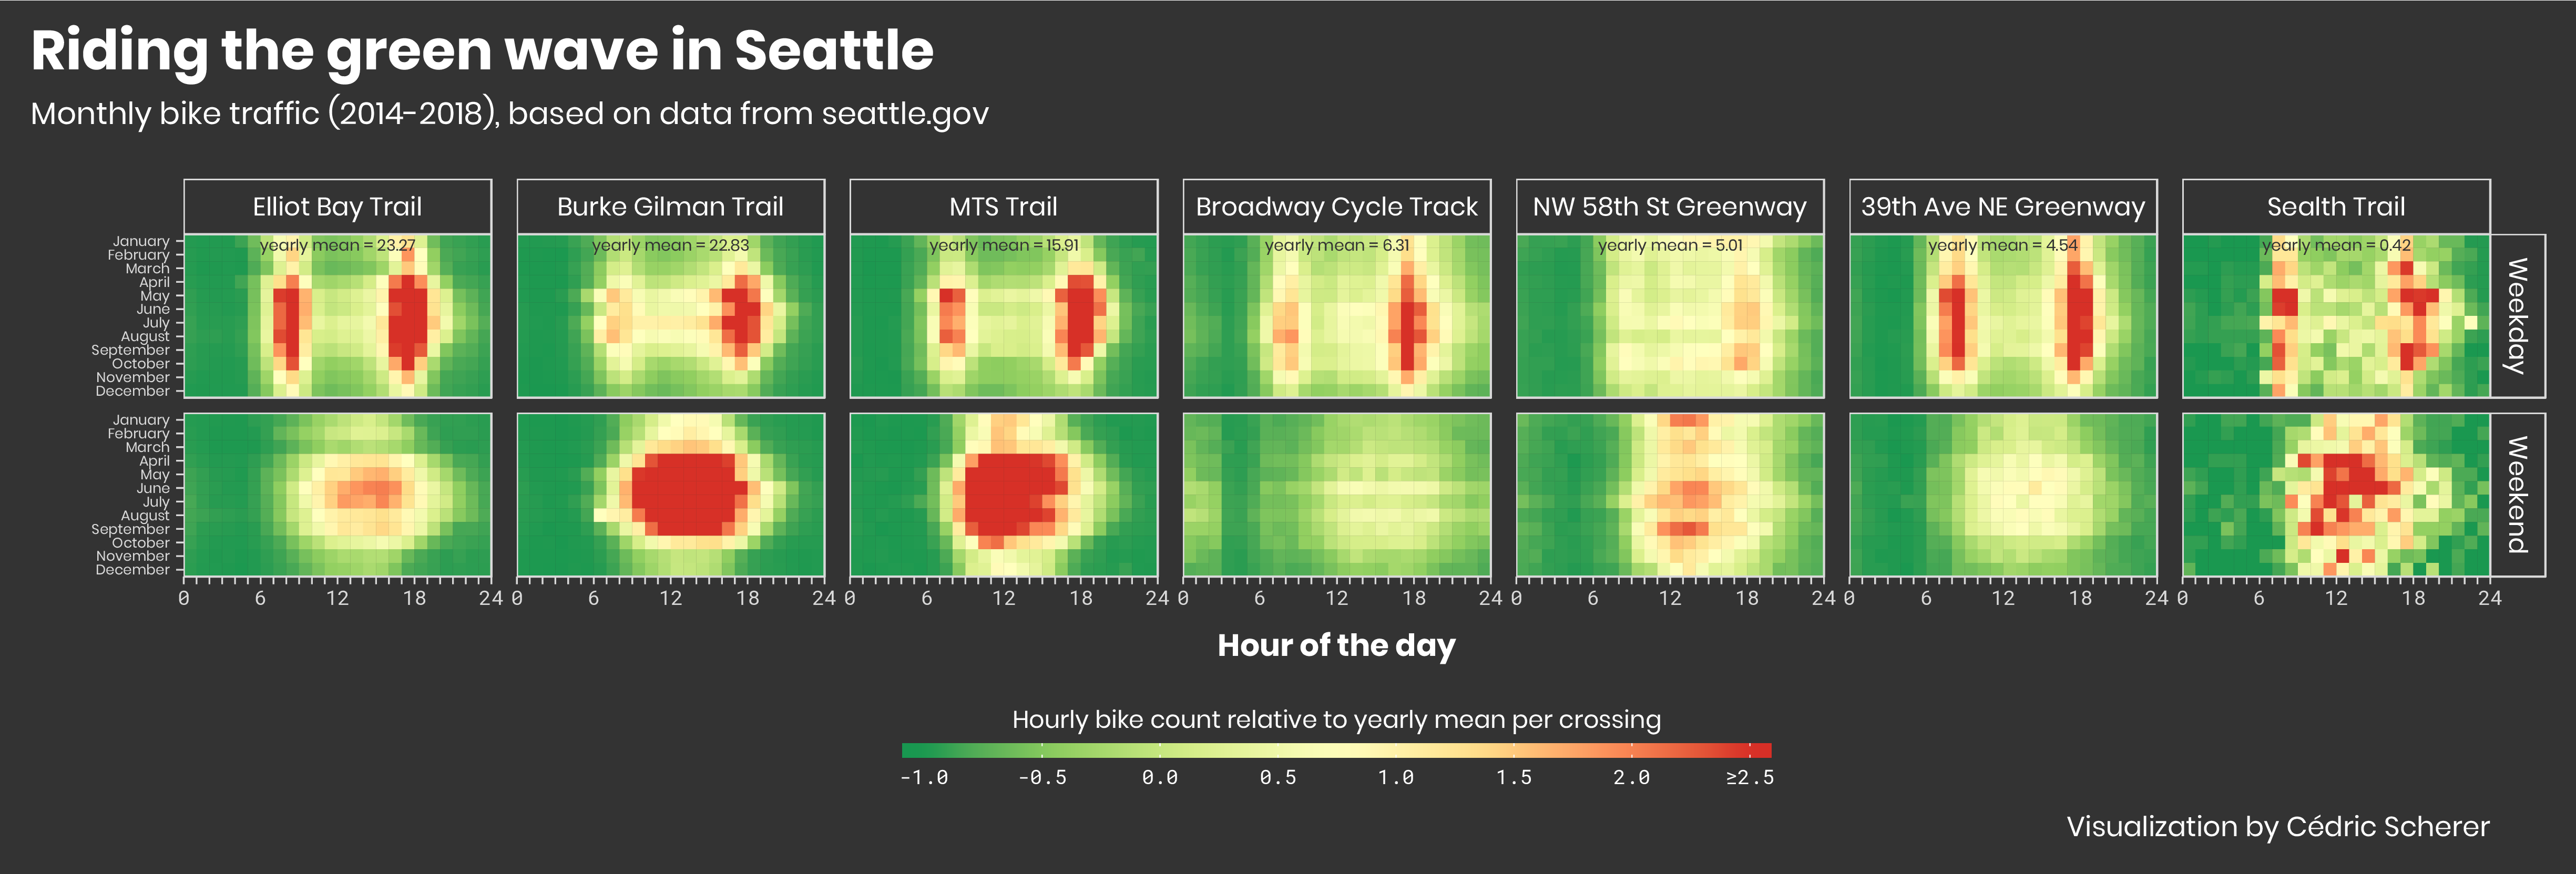
Week 2019/14️ 🚴 Seattle Bike Traffic by seattle.gov

./plots/2019_14/2019_14_bikes_month.png


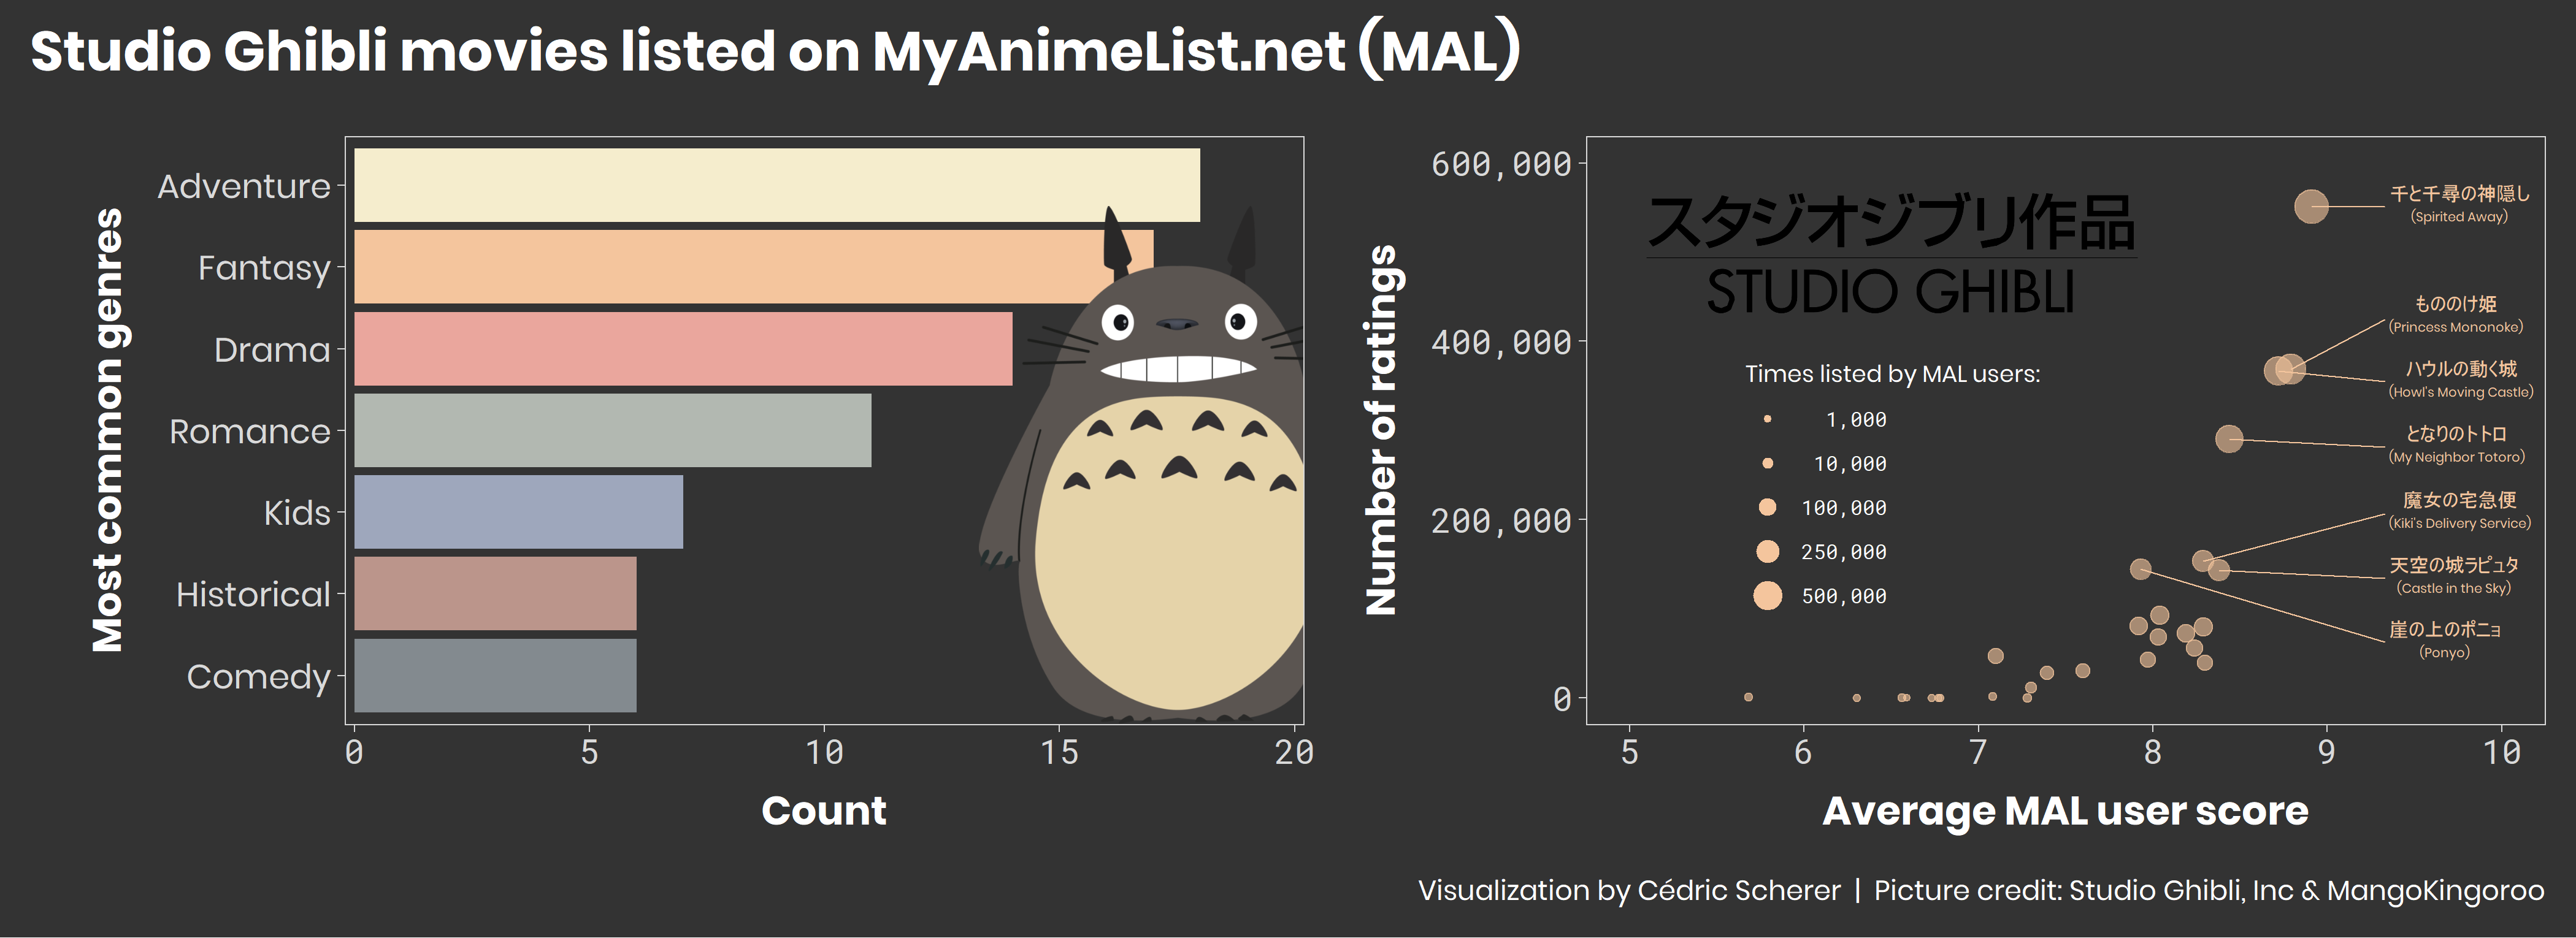
Week 2019/17 🐉 Anime Data by MyAnimeList.net

./plots/2019_17/2019_17_Animes.png


Attribution-NonCommercial-ShareAlike 4.0 International (CC BY-NC-SA 4.0)
tidytuesday's People

Contributors

z3tt avatar gkaramanis avatar

Watchers

James Cloos avatar

Recommend Projects

  • React photo React

    A declarative, efficient, and flexible JavaScript library for building user interfaces.

  • Vue.js photo Vue.js

    🖖 Vue.js is a progressive, incrementally-adoptable JavaScript framework for building UI on the web.

  • Typescript photo Typescript

    TypeScript is a superset of JavaScript that compiles to clean JavaScript output.

  • TensorFlow photo TensorFlow

    An Open Source Machine Learning Framework for Everyone

  • Django photo Django

    The Web framework for perfectionists with deadlines.

  • D3 photo D3

    Bring data to life with SVG, Canvas and HTML. 📊📈🎉

Recommend Topics

  • javascript

    JavaScript (JS) is a lightweight interpreted programming language with first-class functions.

  • web

    Some thing interesting about web. New door for the world.

  • server

    A server is a program made to process requests and deliver data to clients.

  • Machine learning

    Machine learning is a way of modeling and interpreting data that allows a piece of software to respond intelligently.

  • Game

    Some thing interesting about game, make everyone happy.

Recommend Org

  • Facebook photo Facebook

    We are working to build community through open source technology. NB: members must have two-factor auth.

  • Microsoft photo Microsoft

    Open source projects and samples from Microsoft.

  • Google photo Google

    Google ❤️ Open Source for everyone.

  • D3 photo D3

    Data-Driven Documents codes.