Sparkline SVG is simple yet customizable, zero-dependency, Elixir library to generate SVG sparkline charts.
A sparkline is a small, simple chart that is drawn without axes or coordinates. It presents the general shape of the variation of a dataset at a glance.
Sparkline SVG allows you to create a sparkline chart from various data shapes and show the dots, the line, and the area under the line. You can also add markers to the chart to highlight specific spots as well as show common reference lines.
This library follow the Unix philosophy: Make each program do one thing well. It only generates SVG sparkline charts. The library is highly customizable and allows you to use CSS to style the chart as well as keyword options.
Datapoints are the values that will be used to draw the chart. They can be:
- A list of numbers, where each number is a value for the y axis.
- A list of tuples with two values. The first value is the x axis and the second value is the y axis.
Markers are used to highlight specific spots on the chart. There are two types of markers:
- A single marker that will be rendered as a vertical line.
- A range marker that will be rendered as a rectangle.
Reference lines are used to show common reference lines on the chart. There are five types of
currently supported reference lines (maximum, minimum, average, median, and percentile/1)
that will be rendered as horizontal lines. You can also add custom reference line.
Normally the window is automatically calculated based on the datapoints. However, you can set the min or the max value of the window or both to show only a specific part of the chart or to always display the same amount of data.
Sparkline SVG allows you to customize the chart showing or hiding the dots, the line, and the area under the line. There are two ways to customize the chart:
- Using the options like color or width.
- Using the CSS classes option to give classes to SVG elements and then using CSS to style them.
For all the customization options, visit the options documentation.
# Datapoints and general options
datapoints = [1, 3, 2, 2, 5]
options = [width: 100, height: 40]

# A very simple line chart
sparkline = SparklineSvg.new(datapoints, options)

# Display what you want
line_options = [width: 0.25, color: "black"]
sparkline = SparklineSvg.show_line(sparkline, line_options)

# Render the chart to an SVG string
{:ok, svg} = SparklineSvg.to_svg(sparkline)
For more usage examples, visit the documentation.
The package can be installed by adding :sparkline_svg to your list of dependencies in mix.exs:
def deps do
  [
    {:sparkline_svg, "~> 0.5.0"}
  ]
endThis library is currently under active development and it’s API is likely to change.
A more complete example list can be found in the documentation.
A cyan sparkline with a line, area, and markers
# Data source
data = [4, 4, 6, 3, 2, 1, 3, 5, 7, 7, 7, 6, 9, 11, 11, 5, 7, 6, 9, 19, 19, 20, 21, 20, 17, 20, 19, 17]

# Arbitrary marker and marker area
marker = 25
marker_area = {10, 15}

data
|> SparklineSvg.new(smoothing: 0.05)
|> SparklineSvg.show_line(color: "rgba(6, 182, 212, 0.5)", width: 0.4)
|> SparklineSvg.show_area(color: "rgba(6, 182, 212, 0.2)")
|> SparklineSvg.add_marker(marker, stroke_color: "rgba(236, 72, 153, 0.8)", stroke_width: 0.4)
|> SparklineSvg.add_marker(marker_area, stroke_color: "rgba(236, 72, 153, 0.4)", stroke_width: 0.4, fill_color: "rgba(236, 72, 153, 0.2)")
|> SparklineSvg.to_svg!()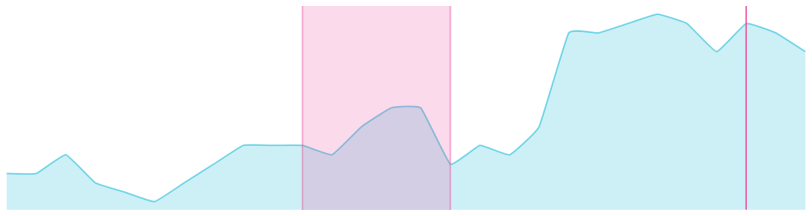
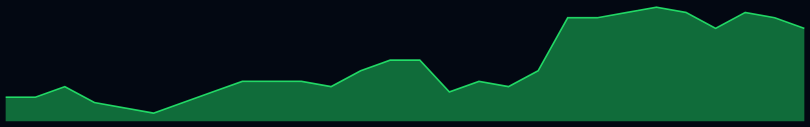
A green sparkline, on dark background, with a line, and area
# Data source
data = [4, 4, 6, 3, 2, 1, 3, 5, 7, 7, 7, 6, 9, 11, 11, 5, 7, 6, 9, 19, 19, 20, 21, 20, 17, 20, 19, 17]

data
|> SparklineSvg.new(width: 200, height: 30, smoothing: 0)
|> SparklineSvg.show_line(color: "rgba(40, 255, 118, 0.8)", width: 0.4)
|> SparklineSvg.show_area(color: "rgba(40, 255, 118, 0.4)")
|> SparklineSvg.to_svg!()