
Compute & Graph Confidence Distributions and Likelihood Functions

Sample image taken from Schweder T, Hjort NL. (2016)
For A Better Understanding of What These Are, See the Background Literature
Compare The Functions From Different Studies


Export Tables Easily For Word, Powerpoint, & TeX documents
(It is highly recommended that you look at the articles.)
install.packages("concurve")
Try the following script if you run into any installation issues:
install.packages("concurve", repos = "https://cloud.r-project.org/", dep = TRUE)
Install the developer version from GitHub using the following:
remotes::install_github("zadrafi/concurve@master", dependencies = TRUE)
See which versions of the package are currently supported here.
Check out the article on using Stata to obtain similar functions.
- Comparison to Bayesian Posterior Distributions
- The Bootstrap and Consonance Functions
- Background Literature
- Customizing Plots
- Examples in R
- Logistic Regression in R
- Profile Likelihoods
- Meta-Analysis Examples
- Using Stata
- Survival Modeling
- S-values
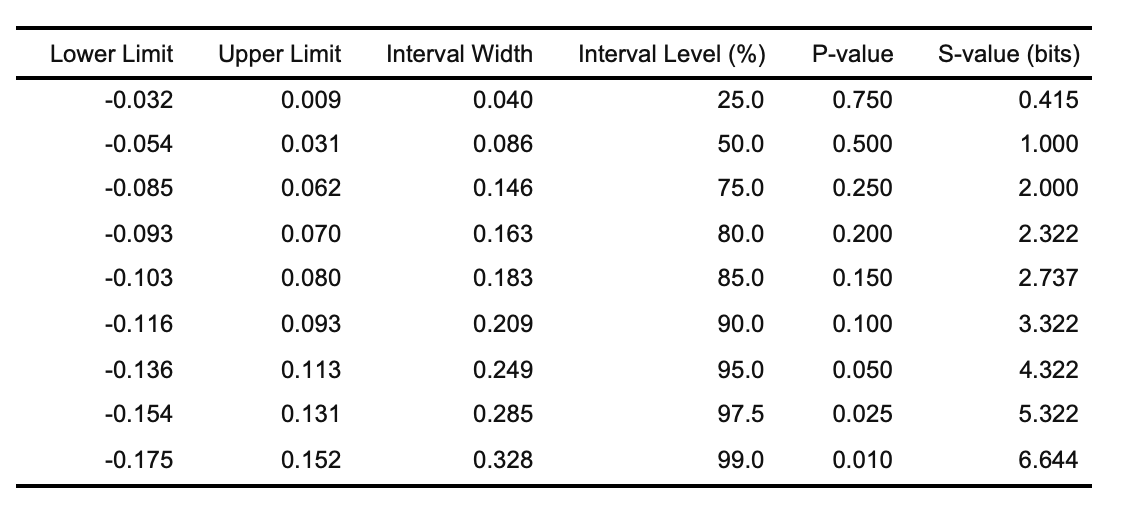
- Generating Tables
- Troubleshooting
- Consonance Functions for Linear Mixed-Effects Models
- Wish List
To properly cite the package, please see the following page or run the R script below.
citation("concurve")
Please note that the concurve project is released with a Contributor Code of Conduct. By contributing to this project, you agree to abide by its terms.
The package was currently run on:
## R version 4.0.2 (2020-06-22)
## Platform: x86_64-apple-darwin17.0 (64-bit)
## Running under: macOS Catalina 10.15.6
##
## Matrix products: default
## BLAS:   /Library/Frameworks/R.framework/Versions/4.0/Resources/lib/libRblas.dylib
## LAPACK: /Library/Frameworks/R.framework/Versions/4.0/Resources/lib/libRlapack.dylib
##
## locale:
## [1] en_US.UTF-8/en_US.UTF-8/en_US.UTF-8/C/en_US.UTF-8/en_US.UTF-8
##
## attached base packages:
## [1] stats     graphics  grDevices utils     datasets  methods   base
##
## loaded via a namespace (and not attached):
##  [1] compiler_4.0.2    magrittr_1.5      credentials_1.3.0 htmltools_0.5.0   tools_4.0.2       yaml_2.2.1        stringi_1.5.3
##  [8] rmarkdown_2.4     knitr_1.30        stringr_1.4.0     xfun_0.18         digest_0.6.25     rlang_0.4.7       openssl_1.4.3
## [15] sys_3.4           evaluate_0.14     askpass_1.1


