Knee-point detection in Python

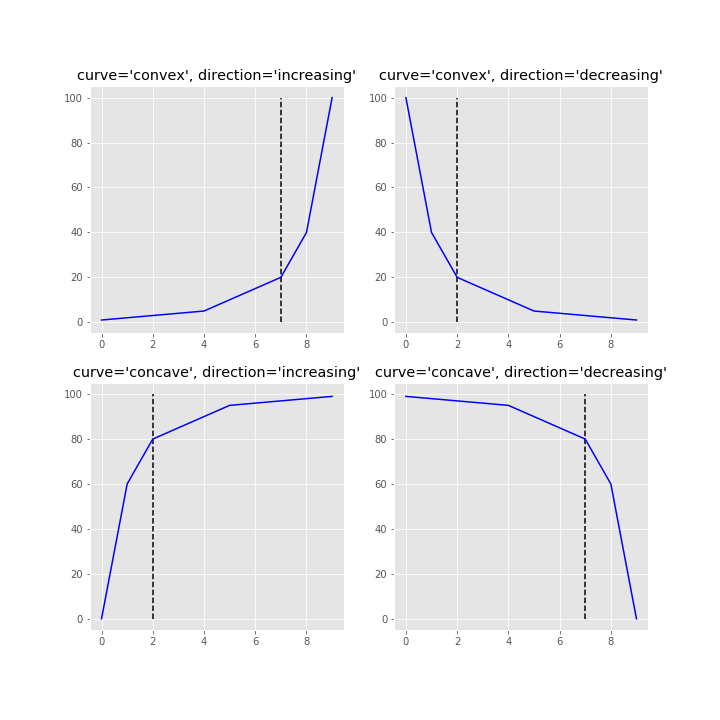
This repository is an attempt to implement the kneedle algorithm, published here. Given a set of x and y values, kneed will return the knee point of the function. The knee point is the point of maximum curvature.
Tested with Python 3.5, 3.6, and 3.7
anaconda
$ conda install -c conda-forge kneedpip
$ pip install kneedClone from GitHub
$ git clone https://github.com/arvkevi/kneed.git
$ python setup.py installThese steps introduce how to use kneed by reproducing Figure 2 from the manuscript.
The DataGenerator class is only included as a utility to generate sample datasets.
Note:
xandymust be equal length arrays.
from kneed import DataGenerator, KneeLocator

x, y = DataGenerator.figure2()

print([round(i, 3) for i in x])
print([round(i, 3) for i in y])

[0.0, 0.111, 0.222, 0.333, 0.444, 0.556, 0.667, 0.778, 0.889, 1.0]
[-5.0, 0.263, 1.897, 2.692, 3.163, 3.475, 3.696, 3.861, 3.989, 4.091]The knee (or elbow) point is calculated simply by instantiating the KneeLocator class with x, y and the appropriate curve and direction.
Here, kneedle.knee and/or kneedle.elbow store the point of maximum curvature.
kneedle = KneeLocator(x, y, S=1.0, curve='concave', direction='increasing')

print(round(kneedle.knee, 3))
0.222

print(round(kneedle.elbow, 3))
0.222
The knee point returned is a value along the x axis. The y value at the knee can be identified:
print(round(kneedle.knee_y, 3))
1.897The KneeLocator class also has two plotting functions for quick visualizations.
Note that all (x, y) are transformed for the normalized plots
# Normalized data, normalized knee, and normalized distance curve.
kneedle.plot_knee_normalized()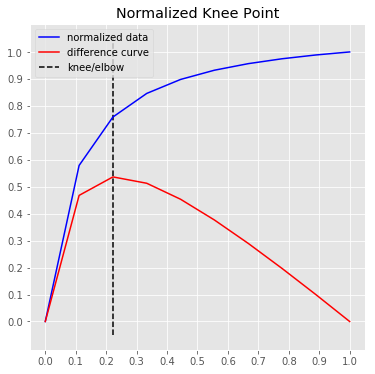
# Raw data and knee.
kneedle.plot_knee()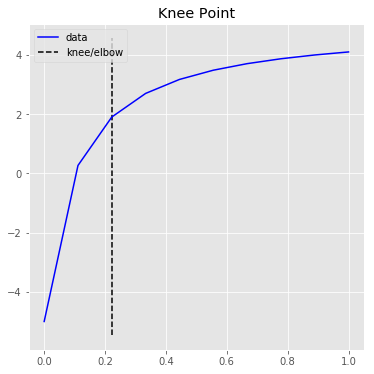
The knee point selected is tunable by setting the sensitivity parameter S. From the manuscript:
The sensitivity parameter allows us to adjust how aggressive we want Kneedle to be when detecting knees. Smaller values for S detect knees quicker, while larger values are more conservative. Put simply, S is a measure of how many “flat” points we expect to see in the unmodified data curve before declaring a knee.
import numpy as np
np.random.seed(23)

sensitivity = [1, 3, 5, 10, 100, 200, 400]
knees = []
norm_knees = []

n = 1000
x = range(1, n + 1)
y = sorted(np.random.gamma(0.5, 1.0, n), reverse=True)
for s in sensitivity:
    kl = KneeLocator(x, y, curve='convex', direction='decreasing', S=s)
    knees.append(kl.knee)
    norm_knees.append(kl.norm_knee)

print(knees)
[43, 137, 178, 258, 305, 482, 482]

print([nk.round(2) for nk in norm_knees])
[0.04, 0.14, 0.18, 0.26, 0.3, 0.48, 0.48]

import matplotlib.pyplot as plt
plt.style.use('ggplot');
plt.figure(figsize=(8, 6));
plt.plot(kl.x_normalized, kl.y_normalized);
plt.plot(kl.x_distance, kl.y_distance);
colors = ['r', 'g', 'k', 'm', 'c', 'orange']
for k, c, s in zip(norm_knees, colors, sensitivity):
    plt.vlines(k, 0, 1, linestyles='--', colors=c, label=f'S = {s}');
plt.legend();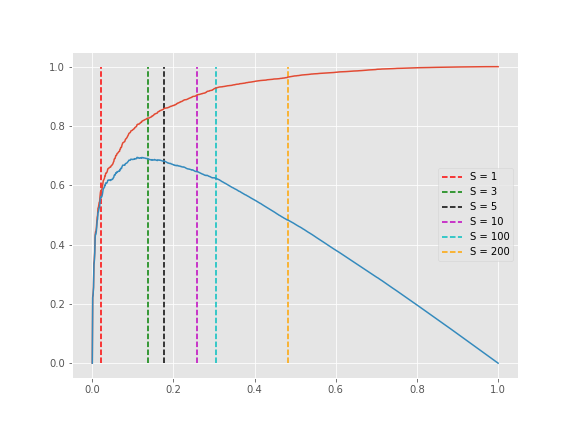
Notice that any S>200 will result in a knee at 482 (0.48, normalized) in the plot above.
The knee point can be corrected if the parameter online is True (default). This mode will step through each element in
x. In contrast, if online is False, kneed will run in offline mode and return the first knee point identified.
Using the x and y from the Sensitivity example above, this time, let's keep S=1 but modify online.
kl_online = KneeLocator(x, y, curve='convex', direction='decreasing', online=True)
kl_offline = KneeLocator(x, y, curve='convex', direction='decreasing', online=False)

import matplotlib.pyplot as plt
plt.style.use('ggplot');
plt.figure(figsize=(8, 6));
plt.plot(kl_online.x_normalized, kl_online.y_normalized);
plt.plot(kl_online.x_distance, kl_online.y_distance);
colors = ['r', 'g']
for k, c, o in zip([kl_online.norm_knee, kl_offline.norm_knee], ['r', 'g'], ['online', 'offline']):
    plt.vlines(k, 0, 1, linestyles='--', colors=c, label=o);
plt.legend();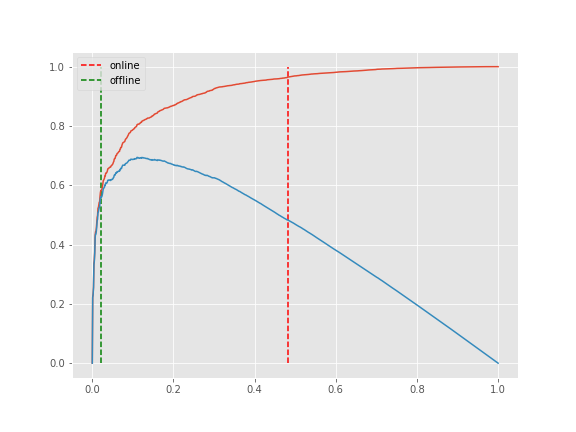
Here is an example of a "bumpy" or "noisy" line where the default scipy.interpolate.interp1d spline fitting method does not provide the best estimate for the point of maximum curvature.
This example demonstrates that setting the parameter interp_method='polynomial' will choose a more accurate point by smoothing the line.
The argument for
interp_methodparameter is a string of either "interp1d" or "polynomial".
x = list(range(90))
y = [
    7304, 6978, 6666, 6463, 6326, 6048, 6032, 5762, 5742,
    5398, 5256, 5226, 5001, 4941, 4854, 4734, 4558, 4491,
    4411, 4333, 4234, 4139, 4056, 4022, 3867, 3808, 3745,
    3692, 3645, 3618, 3574, 3504, 3452, 3401, 3382, 3340,
    3301, 3247, 3190, 3179, 3154, 3089, 3045, 2988, 2993,
    2941, 2875, 2866, 2834, 2785, 2759, 2763, 2720, 2660,
    2690, 2635, 2632, 2574, 2555, 2545, 2513, 2491, 2496,
    2466, 2442, 2420, 2381, 2388, 2340, 2335, 2318, 2319,
    2308, 2262, 2235, 2259, 2221, 2202, 2184, 2170, 2160,
    2127, 2134, 2101, 2101, 2066, 2074, 2063, 2048, 2031
]

# the default spline fit, `interp_method='interp1d'`
kneedle = KneeLocator(x, y, S=1.0, curve='convex', direction='decreasing', interp_method='interp1d')
kneedle.plot_knee_normalized()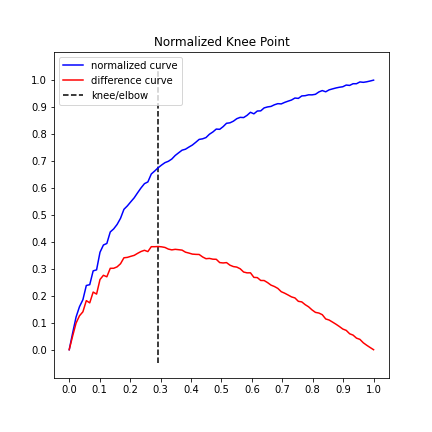
# The same data, only using a polynomial fit this time.
kneedle = KneeLocator(x, y, S=1.0, curve='convex', direction='decreasing', interp_method='polynomial')
kneedle.plot_knee_normalized()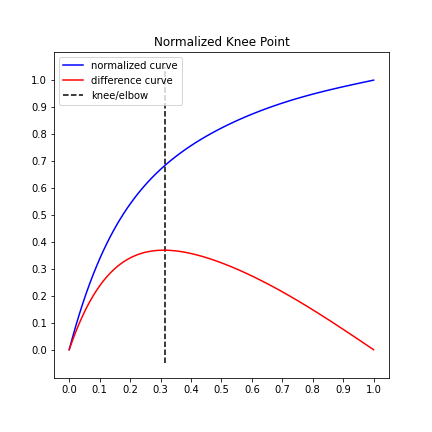
Figure 3 from the manuscript estimates the knee to be x=60 for a NoisyGaussian.
This simulate 5,000 NoisyGaussian instances and finds the average.
knees = []
for i in range(5):
    x, y = DataGenerator.noisy_gaussian(mu=50, sigma=10, N=1000)
    kneedle = KneeLocator(x, y, curve='concave', direction='increasing', interp_method='polynomial', online=True)
    knees.append(kneedle.knee)

# average knee point
round(sum(knees) / len(knees), 3)
63.583Find the optimal number of clusters (k) to use in k-means clustering. See the tutorial in the notebooks directory.
KneeLocator(x, y, curve='convex', direction='decreasing')
Contributions are welcome, please refer to CONTRIBUTING to learn more about how to contribute.
Finding a “Kneedle” in a Haystack: Detecting Knee Points in System Behavior Ville Satopa † , Jeannie Albrecht† , David Irwin‡ , and Barath Raghavan§ †Williams College, Williamstown, MA ‡University of Massachusetts Amherst, Amherst, MA § International Computer Science Institute, Berkeley, CA


