
This is the source code of the GraphSL library to support the research of the graph source localization problem.
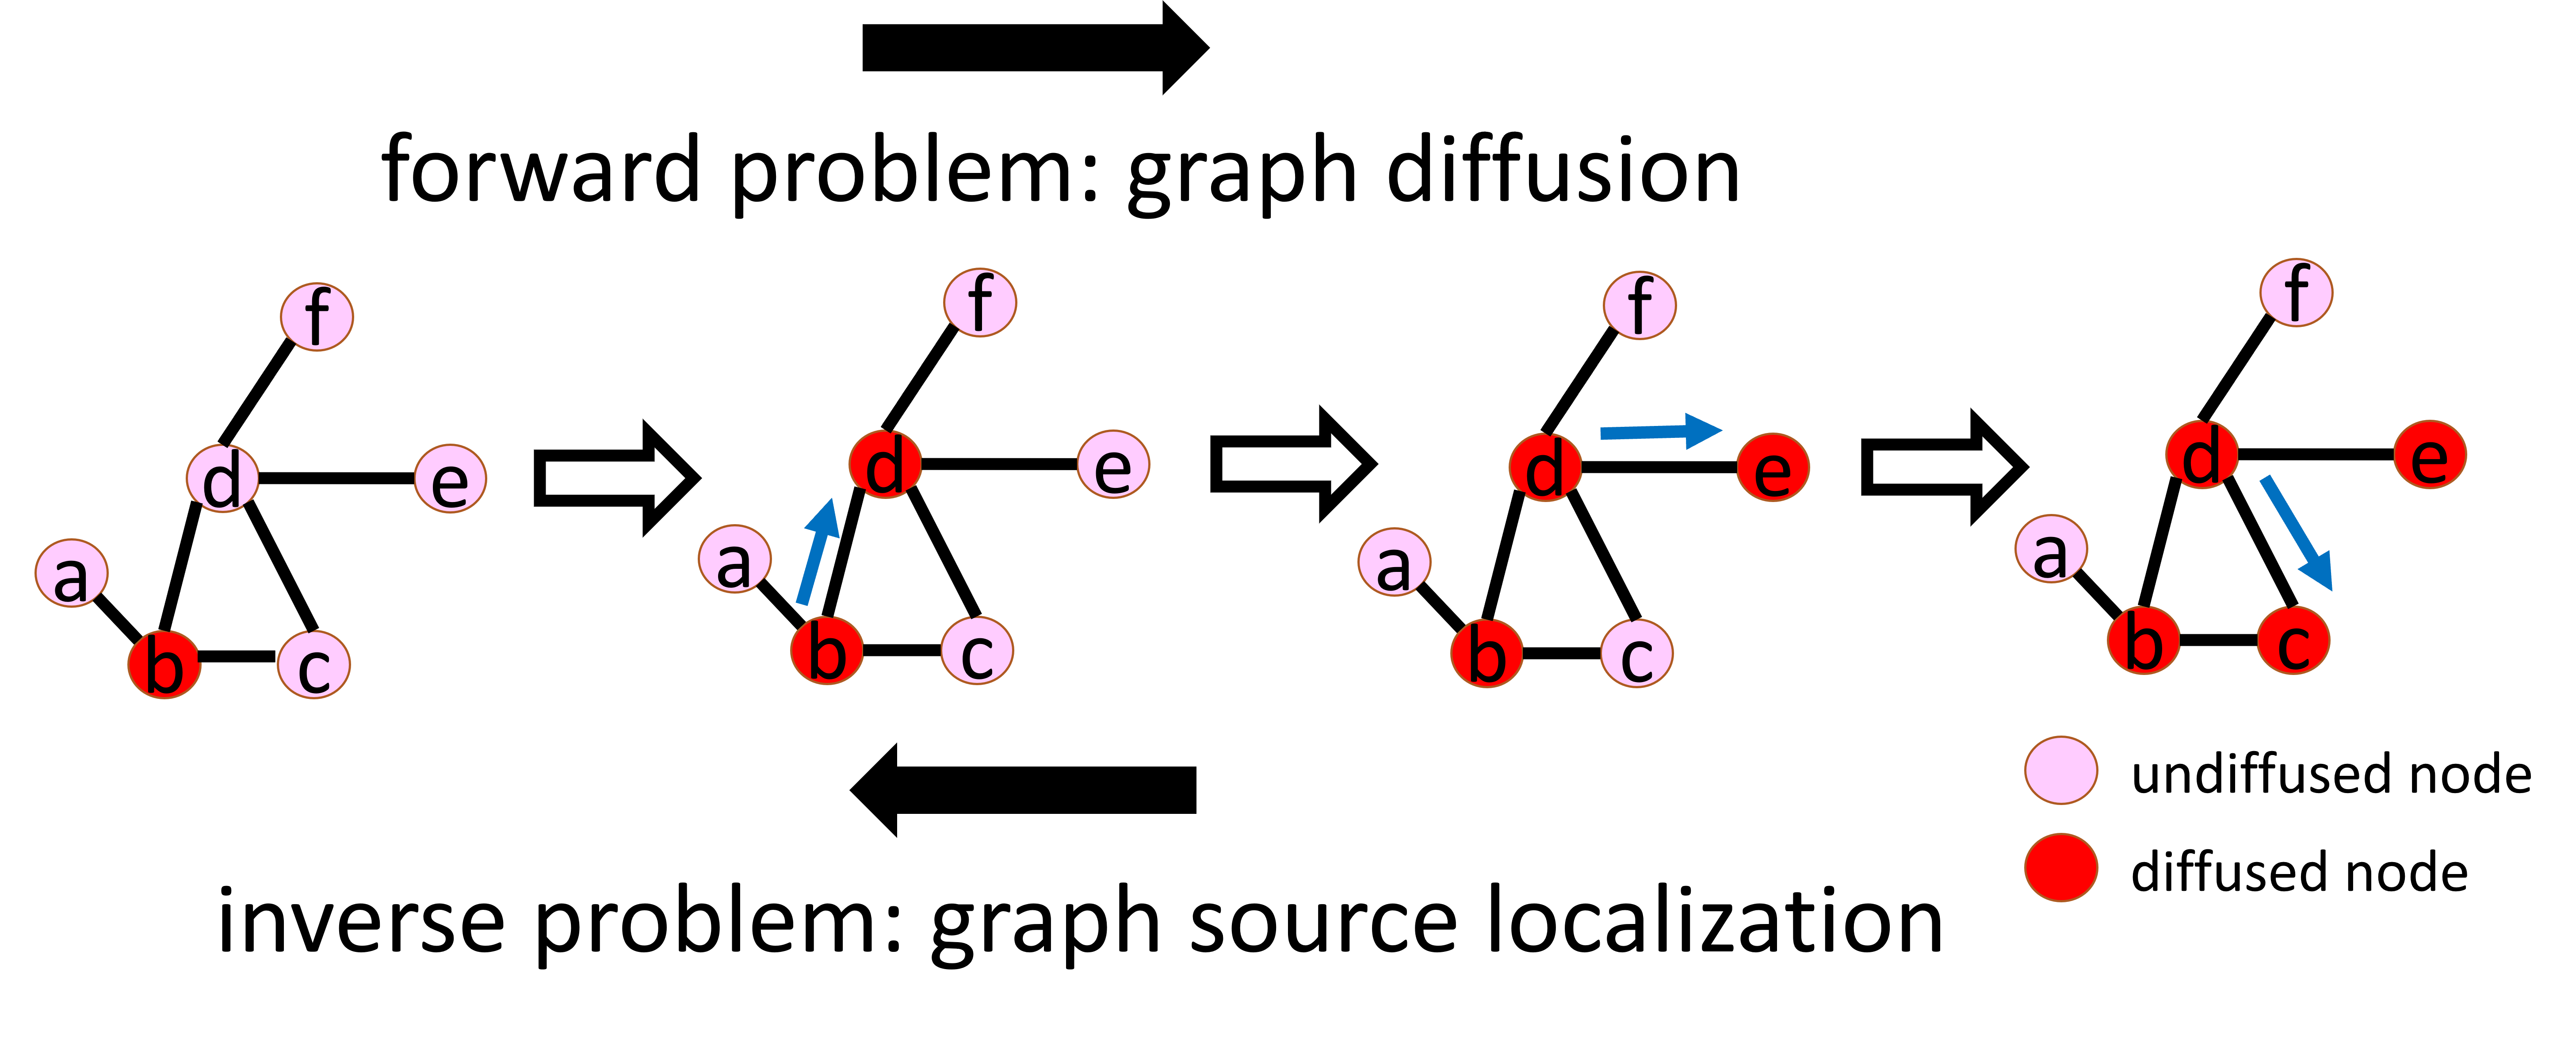
Graph diffusion is a fundamental task in graph learning, which aims to predict future information diffusions given information sources. Its inverse problem is graph source localization, which is an extremely important topic even though rarely explored: it focuses on the detection of information sources given their future information diffusions. As illustrated in the above figure, graph diffusion seeks to predict the information diffusion
Due to its importance, some open-source tools have been developed to support research on the graph source localization problem. Two recent examples are cosasi and RPaSDT. However, they do not support various simulations of information diffusion, and they also miss real-world benchmark datasets and state-of-the-art source localization approaches. To fill this gap, we propose a new library GraphSL: the first one to include real-world benchmark datasets and recent source localization methods to our knowledge, enabling researchers and practitioners to evaluate novel techniques against appropriate baselines easily. These methods do not require prior assumptions about the source (e.g. single source or multiple sources) and can handle graph source localization based on various diffusion simulation models such as Independent Cascade (IC) and Linear Threshold (LT). Our GraphSL library is standardized: for instance, tests of all source inference methods return a Metric object, which provides five performance metrics (accuracy, precision, recall, F-score, and area under ROC curve) for performance evaluation.
Our GraphSL library targets both developers and practical users: they are free to add algorithms and datasets for personal needs by following the guidelines in the "Contact" section of README.md.
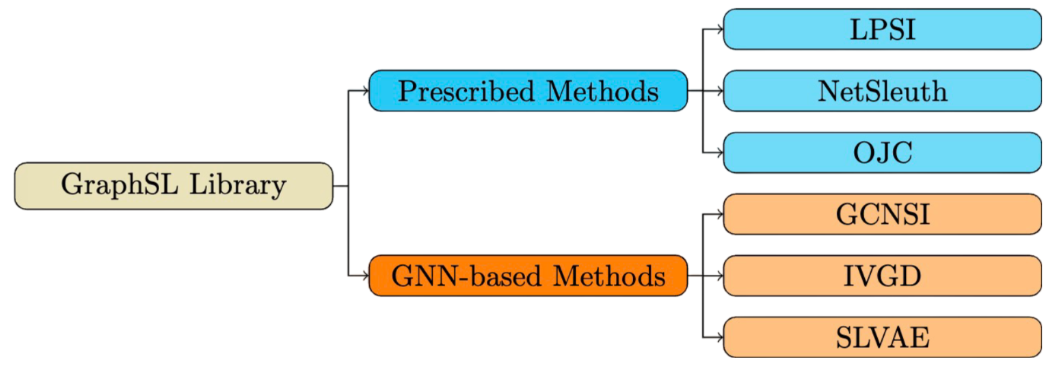
Existing methods can be categorized into two groups: Prescribed methods and Graph Neural Networks (GNN)-based methods.
Prescribed methods rely on hand-crafted rules and heuristics. For instance, LPSI assumes that nodes surrounded by larger proportions of infected nodes are more likely to be source nodes. NetSleuth employs the Minimum Description Length principle to identify the optimal set of source nodes and virus propagation ripple. OJC identifies a set of nodes (Jordan cover) that cover all observed infected nodes with the minimum radius.
GNN-based methods learn rules from graph data in an end-to-end manner by capturing graph topology and neighboring information. For example, GCNSI utilizes LPSI to enhance input and then applies Graph Convolutional Networks (GCN) for source identification; IVGD introduces a graph residual scenario to make existing graph diffusion models invertible, and it devises a new set of validity-aware layers to project inferred sources to feasible regions. SLVAE uses forward diffusion estimation and deep generative models to approximate source distribution, leveraging prior knowledge for generalization under arbitrary diffusion patterns.
| Dataset | #Node | #Edge |
|---|---|---|
| Karate | 34 | 78 |
| Dolphins | 62 | 159 |
| Jazz | 198 | 2,742 |
| Network Science | 1,589 | 2,742 |
| Cora-ML | 2,810 | 7,981 |
| Power Grid | 4,941 | 6,594 |
Aside from methods, we also provide six benchmark datasets to facilitate the research of the graph source localization problem. All datasets are introduced as follows:
-
Karate: Karate depicts the social ties among members of a university karate club.
-
Dolphins: Dolphins represents a social network of bottlenose dolphins, with edges indicating frequent associations between dolphins.
-
Jazz: Jazz illustrates a collaboration network among Jazz musicians, where edges signify instances of playing together in a band.
-
Network Science: Network Science portrays a coauthorship network of scientists engaged in network theory and experimentation, with each edge representing co-authorship of a paper.
-
Cora-ML: Cora-ML is a portal network of computer science research papers obtained through machine learning techniques.
-
Power Grid: Power Grid delineates the topology network of the Western States Power Grid in the United States.
Install GraphSL using pip:
pip install GraphSL
Or, clone the repo and install requirements:
pip install -r requirements.txt
Now, you can import and use GraphSL in your Python code.
from GraphSL.GNN.SLVAE.main import SLVAE
from GraphSL.GNN.IVGD.main import IVGD
from GraphSL.GNN.GCNSI.main import GCNSI
from GraphSL.Prescribed import LPSI, NetSleuth, OJC
from GraphSL.utils import load_dataset, diffusion_generation, split_dataset,download_dataset,visualize_source_prediction
import os
curr_dir = os.getcwd()
# download datasets
download_dataset(curr_dir)
# load datasets ('karate', 'dolphins', 'jazz', 'netscience', 'cora_ml', 'power_grid')
data_name = 'karate'
graph = load_dataset(data_name, data_dir=curr_dir)
# generate diffusion
dataset = diffusion_generation(graph=graph, infect_prob=0.3, diff_type='IC', sim_num=100, seed_ratio=0.2)
# split into training and test sets
adj, train_dataset, test_dataset = split_dataset(dataset)

# LPSI
print("LPSI:")
lpsi = LPSI()

# train LPSI
alpha, thres, auc, f1, pred = lpsi.train(adj, train_dataset)
print(f"train auc: {auc:.3f}, train f1: {f1:.3f}")

# test LPSI
metric = lpsi.test(adj, test_dataset, alpha, thres)
print(f"test acc: {metric.acc:.3f}, test pr: {metric.pr:.3f}, test re: {metric.re:.3f}, test f1: {metric.f1:.3f}, test auc: {metric.auc:.3f}")

# NetSleuth
print("NetSleuth:")
netSleuth = NetSleuth()

# train NetSleuth
k, auc, f1 = netSleuth.train(adj, train_dataset)
print(f"train auc: {auc:.3f}, train f1: {f1:.3f}")

# test NetSleuth
metric = netSleuth.test(adj, test_dataset, k)
print(f"test acc: {metric.acc:.3f}, test pr: {metric.pr:.3f}, test re: {metric.re:.3f}, test f1: {metric.f1:.3f}, test auc: {metric.auc:.3f}")

# OJC
print("OJC:")
ojc = OJC()

# train OJC
Y, auc, f1 = ojc.train(adj, train_dataset)
print(f"train auc: {auc:.3f}, train f1: {f1:.3f}")

# test OJC
metric = ojc.test(adj, test_dataset, Y)
print(f"test acc: {metric.acc:.3f}, test pr: {metric.pr:.3f}, test re: {metric.re:.3f}, test f1: {metric.f1:.3f}, test auc: {metric.auc:.3f}")

# GCNSI
print("GCNSI:")
gcnsi = GCNSI()

# train GCNSI
gcnsi_model, thres, auc, f1, pred = gcnsi.train(adj, train_dataset)
print(f"train auc: {auc:.3f}, train f1: {f1:.3f}")

# visualize training predictions
pred = (pred >= thres)
visualize_source_prediction(adj,pred[:,0],train_dataset[0][:,0].numpy(),save_dir=curr_dir,save_name="GCNSI_source_prediction")


# test GCNSI
metric = gcnsi.test(adj, test_dataset, gcnsi_model, thres)
print(f"test acc: {metric.acc:.3f}, test pr: {metric.pr:.3f}, test re: {metric.re:.3f}, test f1: {metric.f1:.3f}, test auc: {metric.auc:.3f}")

# IVGD
print("IVGD:")
ivgd = IVGD()

# train IVGD diffusion
diffusion_model = ivgd.train_diffusion(adj, train_dataset)

# train IVGD
ivgd_model, thres, auc, f1, pred = ivgd.train(
    adj, train_dataset, diffusion_model)
print(f"train auc: {auc:.3f}, train f1: {f1:.3f}")

# visualize training predictions
pred = (pred >= thres)
visualize_source_prediction(adj,pred[:,0],train_dataset[0][:,0].numpy(),save_dir=curr_dir,save_name="IVGD_source_prediction")

# test IVGD
metric = ivgd.test(adj, test_dataset, diffusion_model, ivgd_model, thres)
print(f"test acc: {metric.acc:.3f}, test pr: {metric.pr:.3f}, test re: {metric.re:.3f}, test f1: {metric.f1:.3f}, test auc: {metric.auc:.3f}")

# SLVAE
print("SLVAE:")
slave = SLVAE()

# train SLVAE
slvae_model, seed_vae_train, thres, auc, f1, pred = slave.train(
    adj, train_dataset)
print(f"train auc: {auc:.3f}, train f1: {f1:.3f}")

# visualize training predictions
pred = (pred >= thres)
visualize_source_prediction(adj,pred[:,0],train_dataset[0][:,0].numpy(),save_dir=curr_dir,save_name="SLVAE_source_prediction")

# test SLVAE
metric = slave.infer(test_dataset, slvae_model, seed_vae_train, thres)
print(f"test acc: {metric.acc:.3f}, test pr: {metric.pr:.3f}, test re: {metric.re:.3f}, test f1: {metric.f1:.3f}, test auc: {metric.auc:.3f}")
We also provide a tutorial to help you get started and check the expected results.
Official documentation, including a detailed API reference, is available on Read the Docs.
If you use this package in your research, please consider citing our work as follows:
@article{Wang2024,
doi = {10.21105/joss.06796},
url = {https://doi.org/10.21105/joss.06796},
year = {2024}, publisher = {The Open Journal},
volume = {9},
number = {99},
pages = {6796},
author = {Junxiang Wang and Liang Zhao},
title = {GraphSL: An Open-Source Library for Graph Source Localization Approaches and Benchmark Datasets},
journal = {Journal of Open Source Software} }We welcome your contributions! If you’d like to contribute your datasets or algorithms, please submit a pull request consisting of an atomic commit and a brief message describing your contribution.
For a new dataset, please upload it to the data folder. The file should be a dictionary object saved by pickle. It contains a key "adj_mat" with the value of a graph adjacency matrix (sprase numpy array with the CSR format).
For a new algorithm, please determine whether it belongs to prescribed methods or GNN-based methods: if it belongs to the prescribed methods, add your algorithm as a new class in the GraphSL/Prescribed.py. Otherwise, please upload it as a folder under the GraphSL/GNN folder. Typically, the algorithm should include a "train" function and a "test" function, and the "test" function should return a Metric object.
Feel free to Email me ([email protected]) if you have any questions. Bug reports and feedback can be directed to the Github issues page.
Version 0.11 removes the memetracker and the digg datasets, improves the IVGD method, and creates random seeds for reproducibility.
Version 0.12 adds the datasets downloader.
Version 0.13 adds the visualization of source predictions.
Version 0.14 uses the num_thres (i.e. number of thresholds to try) instead of specifying the thres_list (i.e. threshold list) for LPSI, GCNSI, IVGD and SLVAE. Moreover, GCNSI, IVGD and SLVAE are improved to run on CUDA if applicable.
Version 0.15 makes all methods run on CUDA if applicable, replaces the diffusion model of IVGD and the encoder of SLVAE, and revises the generation of diffusion.

![dependabot[bot] avatar](https://avatars.githubusercontent.com/in/29110?v=4 "dependabot[bot]")


