Coder Social home page Coder Social logo

xanaduai / flamingpy Goto Github PK

View Code? Open in Web Editor NEW
43.0 43.0 17.0 19.01 MB

FlamingPy is a cross-platform Python library with a variety of backends for efficient simulations of error correction in fault-tolerant quantum computers.

Home Page: https://flamingpy.readthedocs.io

License: Apache License 2.0

CMake 0.43% Python 98.92% C++ 0.65%
error-correction fault-tolerant python quantum-computing quantum-optics unitaryhack

flamingpy's Issues

Improving linting coverage and reporting

In the linting workflow, we have realized the current command here does not cover all flamingpy codes. In addition, there is no pylint report lodged.

I will fix this using the below one-liner in one of the upcoming PRs:
python3 -m pylint --reports=y --disable=R,W flamingpy tests/**/*.py

Matching with lemon is performing badly

@ilan-tz noticed that the lemon backend gives bad results (failure rate) compare to the networkx and retworkx backends. I did some tests on my side and I also notice a failure rate roughly twice is high with lemon compare to the other backends.

Documentation not up-to-date with latest PyPI version

Before posting a bug report

  • I have searched existing GitHub issues and documentation to make sure the issue and relevant resolutions do not already exist.

Expected behavior

There should be documentation for the latest PyPI version of FlamingPy 0.10.1b1

Actual buggy behavior

Only 0.10.1b1.dev0 and v0.8.2a5 are listed on the readthedocs

How to reproduce

Visit https://flamingpy.readthedocs.io/

System information

N/A

Tracebacks

No response

Additional context

No response

[Discussion] Add tests to improve FlamingPy's test suite coverage to >99%

To bring FlamingPy's test suite coverage >99% is imperative to add tests to the following modules and packages (current coverage in parenthesis):

  • flamingpy/codes/surface_code.py (97.31%)
  • flamingpy/codes/graphs/egraph.py (94.57%)
  • flamingpy/codes/graphs/stabilizer_graph.py (96.65%)
  • flamingpy/codes/cv (93.32%)

Most of the additions are related to untested edge cases.

This issue relates to #74

`getting_started.rst` is outdated ๐Ÿ‘ด๐Ÿผ

Before posting a bug report

  • I have searched existing GitHub issues and documentation to make sure the issue and relevant resolutions do not already exist.

Expected behavior

The getting_started.rst file is outdated on the current main.

Actual buggy behavior

The current one is still according to previous PyPi release but there were relevant changes in #57. The README was updated, but not this .rst file.

How to reproduce

See the readthedocs (latest)

System information

Not relevant

Tracebacks

No response

Additional context

No response

Class inheritance diagram displayed incorrectly in the docs

Before posting a bug report

  • I have searched existing GitHub issues and documentation to make sure the issue and relevant resolutions do not already exist.

Expected behavior

In the documentation, one expects seeing the class inhertance diagram for the codes module.

Actual buggy behavior

What I see is the following.
Screen Shot 2022-05-18 at 13 24 57

How to reproduce

Go to https://flamingpy.readthedocs.io/en/latest/source/fp.codes.html.

System information

N/A

Tracebacks

No response

Additional context

No response

Include `add_qubit` and `remove_qubit` method within `EGraph` ๐Ÿช„โš›๏ธ

This issue has been tagged for a bounty during unitaryHACK.

Task

Integrate a simple but important feature to the EGraph class: adding and removing qubits (nodes) of an EGraph object by preserving other arguments of the object consistent. This would correspond to adding or removing a separable or entangled state to the graph state (depending on whether the new node is connected by an edge to an old node). Another way to view this is as an "injection" or "deletion" operation on the graph.

You should:

  • Include an add_qubit method to the EGraph class that has at least two optional arguments: existing_neighbours and new_node_position. The first of these will specify which existing qubits to entangle with the new qubit. If not supplied, the qubit will be added as a separable state. The second of these allows the user to customize where to place the qubit. If not supplied, a default convenient position should be selected (that doesn't accidentally place it too close to or at the location of another qubit).
  • Include a remove_qubit function to the EGraph class that has one mandatory argument (which qubit to remove).

Explanation

Consider the following:

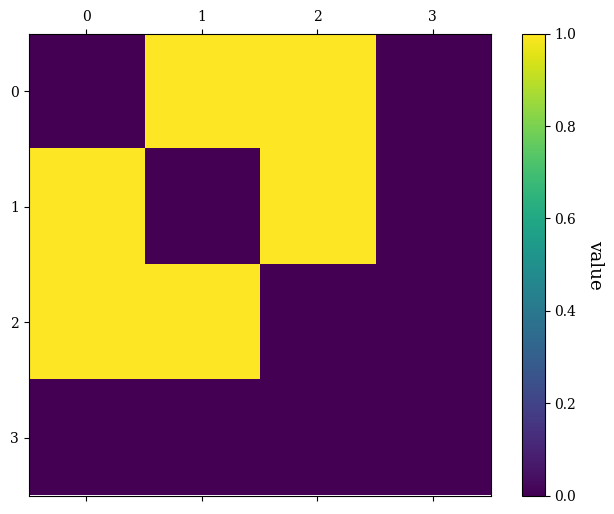
If we draw the adjacency matrix, then add a qubit, and then draw the adjacency matrix again, we do not get an updated adj matrix.

from flamingpy.utils import graph_states
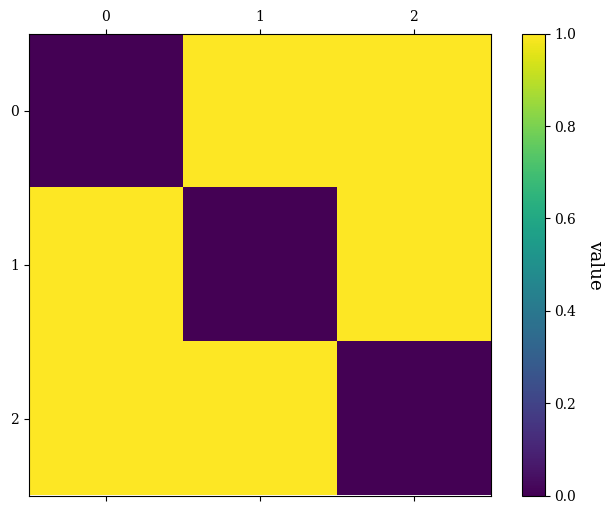
state = graph_states.ring_graph(3)
state.draw_adj()

image

state.add_node((2,2,2))
state.draw_adj()

image

If we add a qubit, draw the adjacency matrix, then remove that qubit, and draw the adjacency matrix again, it does not get updated:

state = graph_states.ring_graph(3)
state.add_node((2,2,2))
state.draw_adj()

image

state.remove_node( (2,2,2))
state.draw_adj()

image

Requirements

  • You should add corresponding unit tests to check your modifications are covered.
  • Qubits (EGraph nodes) are labelled with tuples (x, y, z).
  • Other issues may arise with EGraph.index_generator(), EGraph.adj_generator(), and other functions of the EGraph class. The goal of these add_qubit and remove_qubit functions is to add and remove qubits effortlessly.
  • It is not necessarily a good idea to regenerate indices every time a new qubit is added: it is probably enough just to add to or remove from the existing index dictionaries.

Add tests to improve code coverage of `viz` module ๐Ÿงช

This issue has been tagged for a bounty during unitaryHACK.

Tasks

  • Create a new set of unit tests (potentially in test_viz.py) that covers all possible configuration options of the functions on the viz module. To see the current coverage of the module check codecov.

Explanation

The viz utility module contains helper functions to draw various graphs and generate plots using Matplotlib. This module provides several ways to personalize and configure the resulting figures via the use of function parameters.

The complete set of possible configurations has not been added to the FlamingPy test suite.

Requirements

  • Instead of using image comparison to evaluate the output of the functions of the module I would instead recommend using mocking to mock matplotlib's methods and check that appropriate calls with appropriate arguments are passed to those (mocked) methods.
  • The implementation of this test should cover >99% of the viz module.

Make sure non-Xanadu links open in a new page

To make navigating the docs website nicer, it would be good to open non-Xanadu website links (in e.g. the tutorials) on a new tab/page rather than making the user leave Xanadu sites.

Add warning message when plotting large codes

Before posting a feature request

  • I have searched existing GitHub issues and documentation to make sure the feature request and relevant resolutions do not already exist.

Feature details

Add warning messages whenever a plot function is used for a code with a large number of physical qubits.

Implementation

raise a Warning whenever plot functions are called if the number of qubits of the corresponding code is above a certain threshold.

Additional context

See this closed PR for more details. It implements warning messages for some (but not all) plot functions from flamingpy.

How important would you say this feature is?

1: Not very important. Would be nice to have.

Add local complementation function to `EGraph` class ๐Ÿ“Œ๐Ÿ‘ฅ

This issue has been tagged for a bounty during unitaryHACK.

Task

Check if two graph states are equivalent under local Clifford gates (equivalently, if their underlying graphs are equivalent through a sequence of local complementations -- see here).

To do so, you should:

  • Add a is_lc_equivalent() method to the EGraph class that compares two EGraph objects. This method should be capable of checking if the two graphs represented by EGraph can be related by a sequence of local complementations, and should return True or False accordingly.

Explanation

It would be a good feature to compare two different graph states and determine if they are equivalent under local Clifford operations. This function would be capable of identifying as equivalent, e.g., a complete_graph state and a star_graph state with the same number of qubits.

Requirements

  • You should implement corresponding unit tests to the functions you will introduce.
  • See the link above as well as here for the polynomial-time algorithm to achieve this.

Make `EGraph` visualizations more interactive using Plotly ๐ŸŽจ

This issue has been tagged for a bounty during unitaryHACK.

Tasks

  • At the moment, we use matplotlib for our visualization module. However, sometimes different visualization back-ends work nicer. For example, the interactivity of the graph state plots in matplotlib is not great. The idea of this task is to improve this plot interactivity by adding plotly functionality. In particular, the task is to implement a method analogous to EGraph.draw that uses a plotly 3D scatter plot.

Submission

To work on this task, simply fork the repository. Please also comment in the chat to communicate that you are working on this issue. Once ready, you can open a PR that we will review and hopefully merge, making you an official FlamingPy contributor ๐Ÿ”ฅ ๐Ÿฅง

Good luck ๐Ÿ€

- Joost

Change scope of `docformatter` and `black` ๐Ÿ‘๏ธ

This issue has been tagged for a bounty during unitaryHACK.

Tasks

  1. Include all Python files in this repository to be checked by docformatter
  2. Include the doc directory in the scope of the black formatter.

Explanation

Currently, we only check some .py files, namely flamingpy/*/*.py, with docformatter whereas it makes sense to check all Python files, including test files and files like setup.py. This will improve the quality of the docstrings and the code in general, making it easier to use and develop.

For part 1 of the task, you effectively have to change python -m docformatter --in-place flamingpy/*/*.py to python -m docformatter --in-place **.py in the CI checks. For part 2, make sure this does not break doc workflows!

Submission

To work on this task, simply fork the repository. Please also comment in this thread to communicate that you are working on this issue. Once ready, you can open a PR that we will review and hopefully merge making you an official FlamingPy contributor ๐Ÿ”ฅ ๐Ÿฅง

Good luck ๐Ÿ€

- Joost

Macronize support non-integer nodes

Before posting a feature request

  • I have searched existing GitHub issues and documentation to make sure the feature request and relevant resolutions do not already exist.

Feature details

It would be useful to extend the capabilities of the EGraph Macronize function to non-$\mathbb{Z}^3$ nodes. Currently, there is an unexpected behaviour of this function for certain egraphs (see code below)

Implementation

Not at the moment

Additional context

To reproduce undesired behaviour, run the following:

EG = EGraph([((-0.2519, 0.436, 0.0), (-0.4875, 0.0045, 0.0)), ((-0.2519, 0.436, 0.0), (0.2433, 0.4243, 0.0)), ((-0.2519, 0.436, 0.0), (-0.2519, 0.436, 1.0)), ((0.5017, -0.0012, 0.0), (0.2433, 0.4243, 0.0)), ((0.5017, -0.0012, 0.0), (0.2449, -0.4258, 0.0)), ((0.5017, -0.0012, 0.0), (0.5017, -0.0012, 1.0)), ((-0.2516, -0.4327, 0.0), (-0.4875, 0.0045, 0.0)), ((-0.2516, -0.4327, 0.0), (0.2449, -0.4258, 0.0)), ((-0.2516, -0.4327, 0.0), (-0.2516, -0.4327, 1.0)), ((0.0032, -0.0051, 0.0), (-0.4875, 0.0045, 0.0)), ((0.0032, -0.0051, 0.0), (0.2433, 0.4243, 0.0)), ((0.0032, -0.0051, 0.0), (0.2449, -0.4258, 0.0)), ((0.0032, -0.0051, 0.0), (0.0032, -0.0051, 1.0)), ((-1.0, 0.0024, 0.0), (-0.4875, 0.0045, 0.0)), ((-1.0, 0.0024, 0.0), (-1.0, 0.0024, 1.0)), ((0.4967, 0.8702, 0.0), (0.2433, 0.4243, 0.0)), ((0.4967, 0.8702, 0.0), (0.4967, 0.8702, 1.0)), ((0.5012, -0.8726, 0.0), (0.2449, -0.4258, 0.0)), ((0.5012, -0.8726, 0.0), (0.5012, -0.8726, 1.0)), ((-0.2519, 0.436, 1.0), (-0.4632, 0.0009, 1.0)), ((-0.2519, 0.436, 1.0), (0.2333, 0.4009, 1.0)), ((-0.2519, 0.436, 1.0), (-0.2519, 0.436, 2.0)), ((0.5017, -0.0012, 1.0), (0.2333, 0.4009, 1.0)), ((0.5017, -0.0012, 1.0), (0.2332, -0.4057, 1.0)), ((0.5017, -0.0012, 1.0), (0.5017, -0.0012, 2.0)), ((-0.2516, -0.4327, 1.0), (-0.4632, 0.0009, 1.0)), ((-0.2516, -0.4327, 1.0), (0.2332, -0.4057, 1.0)), ((-0.2516, -0.4327, 1.0), (-0.2516, -0.4327, 2.0)), ((0.0032, -0.0051, 1.0), (-0.4632, 0.0009, 1.0)), ((0.0032, -0.0051, 1.0), (0.2333, 0.4009, 1.0)), ((0.0032, -0.0051, 1.0), (0.2332, -0.4057, 1.0)), ((0.0032, -0.0051, 1.0), (0.0032, -0.0051, 2.0)), ((-1.0, 0.0024, 1.0), (-0.4632, 0.0009, 1.0)), ((-1.0, 0.0024, 1.0), (-1.0, 0.0024, 2.0)), ((0.4967, 0.8702, 1.0), (0.2333, 0.4009, 1.0)), ((0.4967, 0.8702, 1.0), (0.4967, 0.8702, 2.0)), ((0.5012, -0.8726, 1.0), (0.2332, -0.4057, 1.0)), ((0.5012, -0.8726, 1.0), (0.5012, -0.8726, 2.0)), ((-0.2519, 0.436, 2.0), (-0.4875, 0.0045, 2.0)), ((-0.2519, 0.436, 2.0), (0.2433, 0.4243, 2.0)), ((0.5017, -0.0012, 2.0), (0.2433, 0.4243, 2.0)), ((0.5017, -0.0012, 2.0), (0.2449, -0.4258, 2.0)), ((-0.2516, -0.4327, 2.0), (-0.4875, 0.0045, 2.0)), ((-0.2516, -0.4327, 2.0), (0.2449, -0.4258, 2.0)), ((0.0032, -0.0051, 2.0), (-0.4875, 0.0045, 2.0)), ((0.0032, -0.0051, 2.0), (0.2433, 0.4243, 2.0)), ((0.0032, -0.0051, 2.0), (0.2449, -0.4258, 2.0)), ((-1.0, 0.0024, 2.0), (-0.4875, 0.0045, 2.0)), ((0.4967, 0.8702, 2.0), (0.2433, 0.4243, 2.0)), ((0.5012, -0.8726, 2.0), (0.2449, -0.4258, 2.0))])
print(EG.number_of_nodes()) # it's 30
MEG = EG.macronize(True)
print(MEG.number_of_nodes()) # gives 121 as opposed to 120.

How important would you say this feature is?

2: Somewhat important. Needed this quarter.

Add transparency option to plots

Before posting a feature request

  • I have searched existing GitHub issues and documentation to make sure the feature request and relevant resolutions do not already exist.

Feature details

to be able to export as PNGs and vector formats with transparent background

Additional context

Please assign this to me ๐Ÿ˜„

How important would you say this feature is?

2: Somewhat important. Needed this quarter.

Add more natural choice of periodic boundaries

Currently, the "periodic" setting in SurfaceCode means periodic in all three directions. This is useful but unnatural. The setting should be changed to "all_periodic" and a new setting ("periodic") added with boundaries that are periodic in x and y but not z. This will require changes to RHG_graph and various SurfaceCode methods, as well as the check_correction function in decoder.py.

Tutorial on classical error correction

Before posting a feature request

  • I have searched existing GitHub issues and documentation to make sure the feature request and relevant resolutions do not already exist.

Feature details

I figured it would be cool to have a tutorial on classical error correction, analogous to Ilan's QEC tutorial. Many concepts in QEC have counterparts in classical EC, or even find their origins there.

Implementation

See quantum_error_correction.rst or PR24 for an example.

Additional context

No response

How important would you say this feature is?

1: Not very important. Would be nice to have.

Recommend Projects

  • React photo React

    A declarative, efficient, and flexible JavaScript library for building user interfaces.

  • Vue.js photo Vue.js

    ๐Ÿ–– Vue.js is a progressive, incrementally-adoptable JavaScript framework for building UI on the web.

  • Typescript photo Typescript

    TypeScript is a superset of JavaScript that compiles to clean JavaScript output.

  • TensorFlow photo TensorFlow

    An Open Source Machine Learning Framework for Everyone

  • Django photo Django

    The Web framework for perfectionists with deadlines.

  • D3 photo D3

    Bring data to life with SVG, Canvas and HTML. ๐Ÿ“Š๐Ÿ“ˆ๐ŸŽ‰

Recommend Topics

  • javascript

    JavaScript (JS) is a lightweight interpreted programming language with first-class functions.

  • web

    Some thing interesting about web. New door for the world.

  • server

    A server is a program made to process requests and deliver data to clients.

  • Machine learning

    Machine learning is a way of modeling and interpreting data that allows a piece of software to respond intelligently.

  • Game

    Some thing interesting about game, make everyone happy.

Recommend Org

  • Facebook photo Facebook

    We are working to build community through open source technology. NB: members must have two-factor auth.

  • Microsoft photo Microsoft

    Open source projects and samples from Microsoft.

  • Google photo Google

    Google โค๏ธ Open Source for everyone.

  • D3 photo D3

    Data-Driven Documents codes.