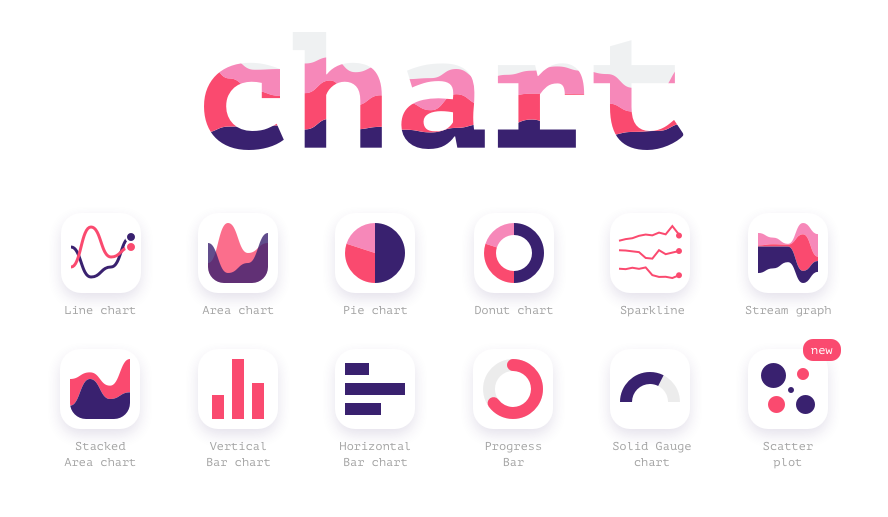
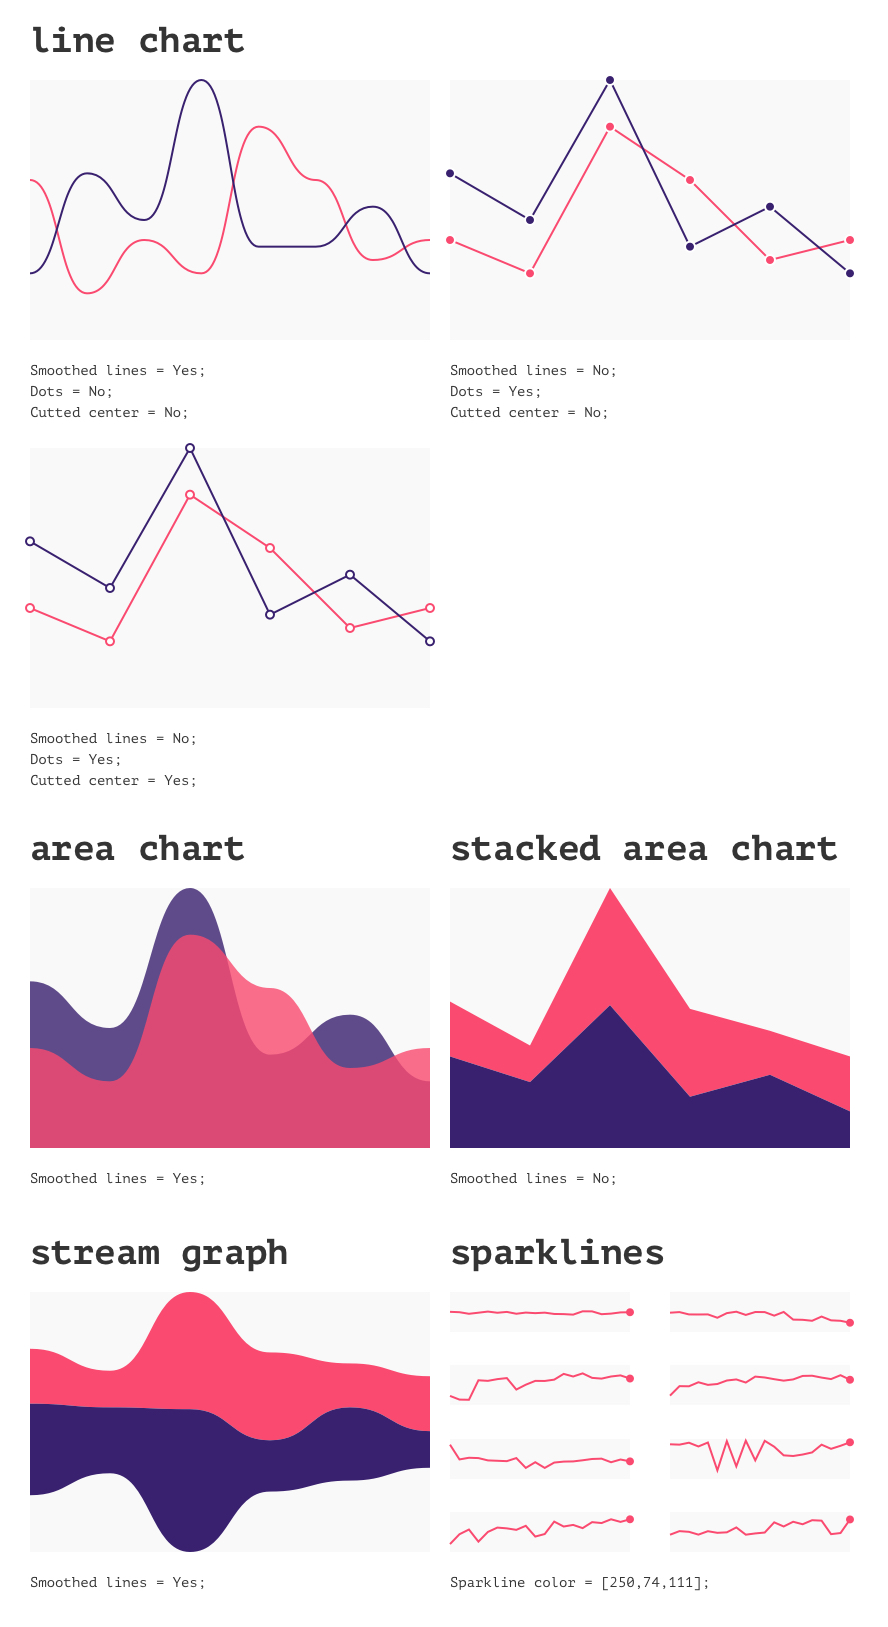
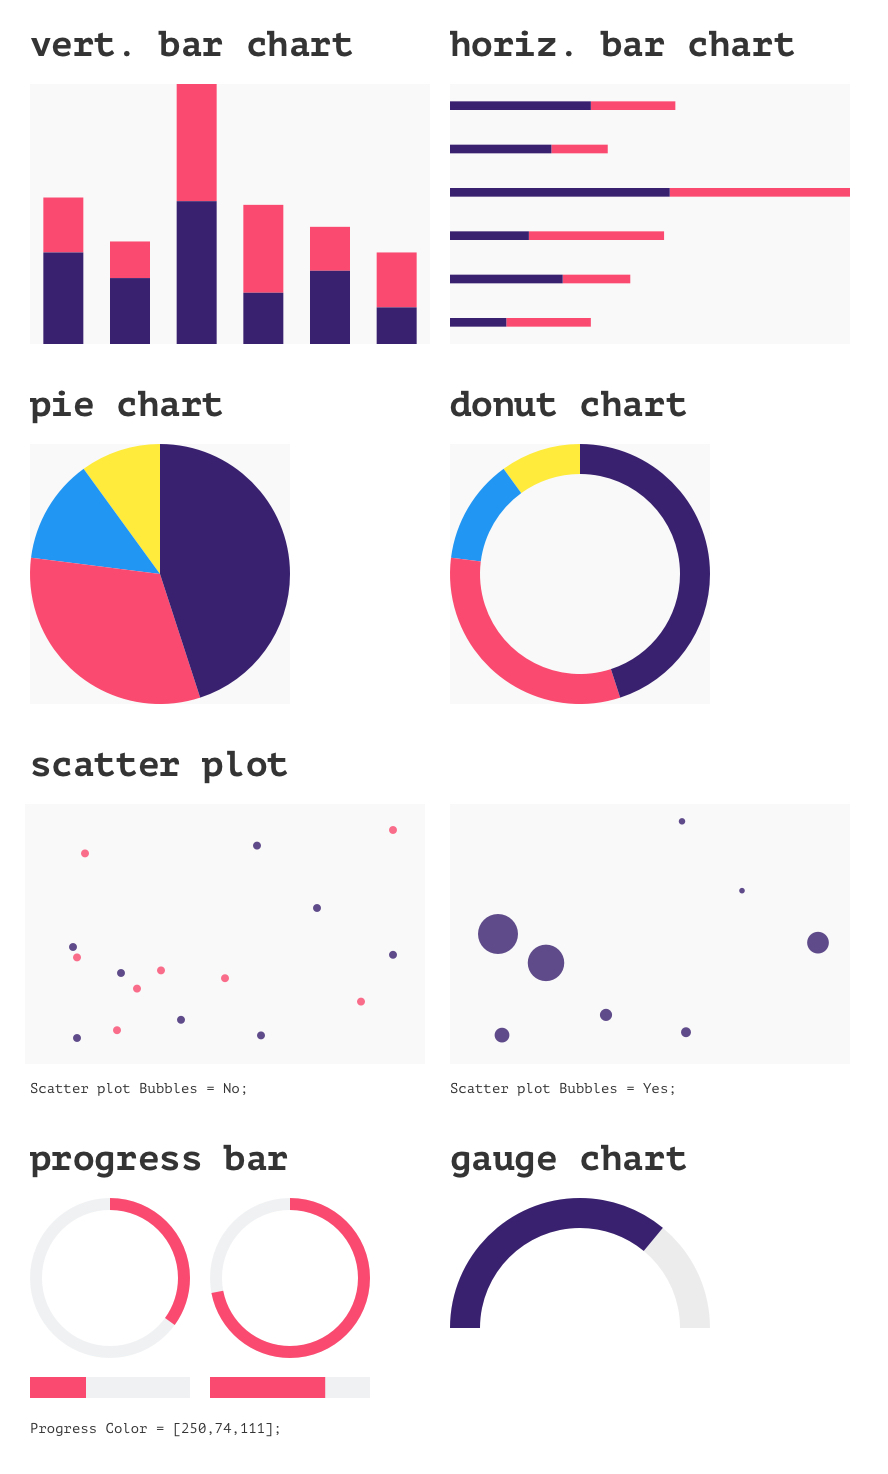
Chart is a Sketch plugin and uses real or random data to create the most popular charts. Chart supports copy-paste from text editors like: Notes, Word, Google Docs, etc, and copy-paste tabulated data from Google Sheets. Read more on Medium
Use only HTTPS links and one key.-
Draw Rectangle or Oval.
-
Copy numeric, use random data or fetch data from JSON. Supported formats:
- 10, 12, 14, 16;
- 27, -17, 94, -32;
- 5.3, 7.9, 15.3, 20.1;
- 25%, 30%, 10%, 35%;
- row in Google Sheets.
-
Select Rectangle.
-
Create Chart using Plugins menu or Sketch Runner :-)
To draw a few lines on one canvas copy a few lines of data, e.g.:
13, 18, 42, 27
39, 8, 21, 40
To draw a few progress bars select a few circles or rectangles and use following format of data (each progress bar on a separate line):
30%
45%
78%
To draw Scatter plot or Bubble chart select a few lines of data: the first line is X, the second line is Y, the third line is Volume (for bubble chart).
- Download and unzip: chart-master.zip.
- Double click
Chart.sketchplugin.
Open Parameter.js in Chart.sketchplugin/Contents/Sketch/ and change plugin's parameters as you want. Read more on Medium
// Type of line: straight — 0, curved — 1
var curveType = 1;

// Set of colors for lines
var colorPalette = new Array();
	var red = [244,67,54];
	var pink = [233,30,99];
	var purple = [156,39,176];
	var deepPurple = [103,58,183];
	var blue = [33,150,243];
	var cian = [0,188,212];
	var teal = [0,150,136];
	var green = [0,200,83];
	var yellow = [255,235,59];
	var amber = [255,193,7];
	var orange = [255,152,0];

	colorPalette = [red, green, blue, yellow, purple, pink, amber, cian, deepPurple, teal, orange];

// Parameters for Lines
var borderThickness = 2;
var endWidth = 8;
var dots = false;
var cuttedCenter = false; // false — color of dot the same as line color; true — you can choose color of dot and dot border below;
var dotFillR = 255;
var dotFillG = 255;
var dotFillB = 255;
var dotBorderR = 255;
var dotBorderG = 255;
var dotBorderB = 255;

// Parameters for Areas
var areaOpacity = 0.8;

// Parameters for Bars
var barWidthParam = 0.2; // The larger the parameter, the thinner the bar;

// Parameters for Donut
var donutBorder = 30;

// Parameters for Progress bar
var progressBarBorder = 12;
var progressBarColor = [244,67,54];

// Parameters for Gauge chart
var gaugeChartBorder = 30;
var gaugeChartColor = [156,39,176];
var gaugeChartBackcolor = [236,236,236];

// Parameters for Sparklines
var sparkColor = [52,52,52];
var borderThicknessSpark = 1;
var endWidthSpark = 4;
var sparkPointsCount = 20;

// Parameters for Scatter Plot
var scatterPlotD = 8;- Line Chart
- Bar Chart
- Area Chart
- Stacked Area Chart
- Sparkline
- New random data generation algorithm
- Pie Chart
- Donut Chart
- Progress Bar
- Solid Gauge Chart
- Stream Graph
- Scatter Plot and Bubble Chart
- Fetch data from JSON
- Candlestick Chart (Mar 2018)
If Chart saves your time and you want more new features, support me via PayPal.
If you have any questions or ideas about Chart, please, feel free to contact me: [email protected], www.pavelkuligin.ru or facebook


