Coder Social home page Coder Social logo

ggfittext's Introduction

R-CMD-check CRAN_Status_Badge Lifecycle: experimental

ggfittext

ggfittext is a ggplot2 extension for fitting text into boxes.

Installation

Install the release version of ggfittext from CRAN:

install.packages("ggfittext")

If you want the development version, install it from GitHub:

devtools::install_github("wilkox/ggfittext")

Fitting text inside a box

Sometimes you want to draw some text in a ggplot2 plot so that it fits inside a defined area. You can do this by manually fiddling with the font size, but this is tedious and un-reproducible. ggfittext provides a geom called geom_fit_text() that automatically resizes text to fit inside a box. It works like this:

ggplot(animals, aes(x = type, y = flies, label = animal)) +
  geom_tile(fill = "white", colour = "black") +
  geom_fit_text()

As with geom_text(), the position of the text is set by the x and y aesthetics. geom_fit_text() tries to infer the width and height of the box in which the text is allowed to fit, and shrinks down any text that is too big.

Reflowing text

Another way to make the text fit in the box is by reflowing it; that is, wrapping it over multiple lines. With the reflow = TRUE argument, geom_fit_text() will reflow the text before (if still necessary) shrinking it:

ggplot(animals, aes(x = type, y = flies, label = animal)) +
  geom_tile(fill = "white", colour = "black") +
  geom_fit_text(reflow = TRUE)

Growing text

If you want the text to be as large as possible, the argument grow = TRUE will increase the text size to the maximum that will fit in the box. This works well in conjunction with reflow:

ggplot(animals, aes(x = type, y = flies, label = animal)) +
  geom_tile(fill = "white", colour = "black") +
  geom_fit_text(reflow = TRUE, grow = TRUE)

Placing text

By default, text is placed in the centre of the box. However, you can place it in a corner or on a side of the box with the place argument, which takes values like “top”, “topright”, “bottomleft” and so on:

ggplot(animals, aes(x = type, y = flies, label = animal)) +
  geom_tile(fill = "white", colour = "black") +
  geom_fit_text(place = "topleft", reflow = TRUE)

Bar plots

ggfittext also provides a geom geom_bar_text() for labelling bars in bar plots:

ggplot(altitudes, aes(x = craft, y = altitude, label = altitude)) +
  geom_col() +
  geom_bar_text()

geom_bar_text() works with stacked bar plots:

ggplot(beverages, aes(x = beverage, y = proportion, label = ingredient,
                    fill = ingredient)) +
  geom_col(position = "stack") +
  geom_bar_text(position = "stack", reflow = TRUE)

And it works with dodged bar plots, and with flipped bar plots:

ggplot(beverages, aes(x = beverage, y = proportion, label = ingredient,
                    fill = ingredient)) +
  geom_col(position = "dodge") +
  geom_bar_text(position = "dodge", grow = TRUE, reflow = TRUE, 
                place = "left") +
  coord_flip()

Experimental feature: rich text

With the rich = TRUE argument, geom_fit_text() and geom_bar_text() both support a limited subset of Markdown and HTML markup for text (rendered with gridtext).

ggplot(animals_rich, aes(x = type, y = flies, label = animal)) +
  geom_tile(fill = "white", colour = "black") +
  geom_fit_text(reflow = TRUE, grow = TRUE, rich = TRUE)

Rich text cannot be drawn in polar coordinates. Please note that this feature is liable to change, and is subject to upstream changes to gridtext.

Specifying the box limits

If you want to manually set the limits of the box (instead of having them inferred from x and y), you can use xmin & xmax and/or ymin & ymax:

ggplot(presidential, aes(ymin = start, ymax = end, x = party, label = name)) +
  geom_fit_text(grow = TRUE) +
  geom_errorbar(alpha = 0.5)

Alternatively, you can set the width and/or height with the width and/or height arguments, which should be grid::unit() objects. The horizontal and/or vertical centre of the box will be defined by x and/or y.

Experimental feature: text in polar coordinates

Text can be drawn in polar coordinates with geom_fit_text() simply by adding coord_polar() to the plot. This feature is experimental and any bug reports are very welcome.

p <- ggplot(gold, aes(xmin = xmin, xmax = xmax, ymin = ymin, ymax = ymax, 
                 fill = linenumber, label = line)) +
  coord_polar() +
  geom_rect() +
  scale_fill_gradient(low = "#fee391", high = "#238443")

p + geom_fit_text(min.size = 0, grow = TRUE)

When text is drawn in polar coordinates, the flip = TRUE argument can be used to flip upside-down text the ‘right way up’ to ease readability:

p + geom_fit_text(min.size = 0, grow = TRUE, flip = TRUE)

Other useful arguments

All arguments to geom_fit_text() can also be used with geom_bar_text().

  • contrast can be used to automatically invert the colour of the text so it contrasts against a background fill:
ggplot(animals, aes(x = type, y = flies, fill = mass, label = animal)) +
  geom_tile() +
  geom_fit_text(reflow = TRUE, grow = TRUE, contrast = TRUE)

  • padding.x and padding.y can be used to set the padding between the text and the edge of the box. By default this is 1 mm. These values must be given as grid::unit() objects.
  • min.size sets the minimum font size in points, by default 4 pt. Text smaller than this will be hidden (see also outside).
  • outside is FALSE by default for geom_fit_text(). If TRUE, text that is placed at “top”, “bottom”, “left” or “right” and must be shrunk smaller than min.size to fit in the box will be flipped to the outside of the box (if it fits there). This is mostly useful for drawing text inside bars in a bar plot.
  • hjust and vjust set the horizontal and vertical justification of the text, scaled between 0 (left/bottom) and 1 (right/top). These are both 0.5 by default.
  • formatter allows you to provide a function that will be applied to the text before it is drawn. This is mostly useful in contexts where variables may be interpolated, such as when using gganimate.
  • fullheight is automatically set depending on place, but can be overridden with this option. This is used to determine the bounding box around the text. If FALSE, the bounding box includes the x-height of the text and ascenders, but not any descenders. If TRUE, it extends from the top of the ascenders to the bottom of the descenders. This is mostly useful in situations where you want to ensure the baseline of text is consistent between labels (fullheight = FALSE), or when you want to avoid descenders spilling out of the bounding box (fullheight = TRUE).

ggfittext's People

Contributors

bradyajohnston avatar gadenbuie avatar teunbrand avatar wilkox avatar

Stargazers

 avatar  avatar  avatar  avatar  avatar  avatar  avatar  avatar  avatar  avatar  avatar  avatar  avatar  avatar  avatar  avatar  avatar  avatar  avatar  avatar  avatar  avatar  avatar  avatar  avatar  avatar  avatar  avatar  avatar  avatar  avatar  avatar  avatar  avatar  avatar  avatar  avatar  avatar  avatar  avatar  avatar  avatar  avatar  avatar  avatar  avatar  avatar  avatar  avatar  avatar  avatar  avatar  avatar  avatar  avatar  avatar  avatar  avatar  avatar  avatar  avatar  avatar  avatar  avatar  avatar  avatar  avatar  avatar  avatar  avatar  avatar  avatar  avatar  avatar  avatar  avatar  avatar  avatar  avatar  avatar  avatar  avatar  avatar  avatar  avatar  avatar  avatar  avatar  avatar  avatar  avatar  avatar  avatar  avatar  avatar  avatar  avatar  avatar  avatar  avatar

Watchers

 avatar  avatar  avatar  avatar  avatar  avatar  avatar  avatar

ggfittext's Issues

Support for mapping the width and height values

Thank you for this extremely useful package!

I have a feature request – support for mapping the width and height values, not just setting them. This is needed when one uses geom_tile() instead of geom_rect() to draw the boxes that the geom_fit_text() text is supposed to be placed into. And geom_tile() is needed when one of the axis is discrete, i.e. a factor. Here’s a small reproducible example.

library(tidyverse)
library(ggfittext)
d = tibble(
  cat = factor(c("R1", "R2")),
  boxstart = c(3, 4),
  boxend = c(5, 10),
  boxwidth = boxend - boxstart,
  boxtext = c(strrep("R1 ", 150), strrep("R2 ", 150))
)

# Plotting boxes using geom_rect()
const_boxheight = .75
p_rect = ggplot(d, aes(
    x = (boxstart + boxend) / 2,
    y = cat,
    xmin = boxstart,
    xmax = boxend,
    ymin = as.numeric(cat) - const_boxheight / 2,
    ymax = as.numeric(cat) + const_boxheight / 2,
    label = boxtext)) +
  geom_rect() +
  geom_fit_text(reflow = TRUE, colour = "orange")
p_rect

This looks fine. But using as.numeric() on the cat factor inside aes() is an ugly hack, which causes problems later. A better solution is to use geom_tile():

# Plotting boxes using geom_tile()
d$boxheight = const_boxheight
p_tile = ggplot(d, aes(
    x = (boxstart + boxend) / 2,
    y = cat,
    width = boxwidth,
    height = boxheight,
    label = boxtext)) +
  geom_tile(height = const_boxheight) +
  geom_fit_text(reflow = TRUE, colour = "orange")
p_tile

The boxes are laid out the same, but the width and height aesthetics are not recognised by geom_fit_text(). Of course, I can set the width and height, but then it would be the same for both (all) boxes, so there would either be overflowing text or too much space inside the boxes.

Now for the reason I need to use geom_tile() instead of geom_rect(). The as.numeric() hack doesn’t work when one uses faceting with free scales and not all levels of the factor are present in all panels. Here’s a simple example:

p_rect + facet_wrap(~cat, scales = "free_y")

Note the wrong vertical placement of the box in panel R2 / the wrong y-axis labelling.

When one uses geom_tile() instead, there’s no problem, since the internals of ggplot2 handle the vertical placement and takes care of any missing levels:

# Correct placement and y axis
p_tile + facet_wrap(~cat, scales = "free_y")

But then geom_fit_text() doesn’t work properly, as it doesn’t recognise the width and height aesthestics.

Warning: Ignoring unknown aesthetics: label

geom_bar_text produces a warning when the label is given in the aesthetics.

data(iris)

library(ggplot2)
library(tidyverse)
library(ggfittext)

iris %>% 
  sample_frac(0.6) %>% 
  count(Species) %>% 
  ggplot() +
  geom_col(aes(x = Species, y = n)) +
  geom_bar_text(aes(x = Species, y = n))

is ok. But then

iris %>% 
  sample_frac(0.6) %>% 
  count(Species) %>% 
  ggplot() +
  geom_col(aes(x = Species, y = n)) +
  geom_bar_text(aes(x = Species, y = n, label = n))

produces the warning.

When the main ggplot code checks with parameters the geom understands, label does not appear in the list, hence the warning. (here https://github.com/tidyverse/ggplot2/blob/de5d63f7eba06e507187f34780bea071cb31fee4/R/layer.r#L117)
I imagine label needs to be added to the list here

default_aes = ggplot2::aes(
but I haven't tried it.

fill aesthetic produces warning even though it's needed for contrast = TRUE

Hi,

This isn't a huge issue but don't think it's needed, and is a little misleading. Including a fill aesthetic in geom_bar_text() is required when using contrast = TRUE, but produces the following warning:

library(tidyverse)
library(ggfittext)

mtcars %>% ggplot()+
  geom_col(aes(x=cyl, y=mpg, fill=gear))+
  geom_bar_text(aes(x = cyl, y = mpg, fill = gear), 
                size = 8, position = "stack", place = "centre", 
                min.size = 6, contrast = TRUE) 
Warning message:
Ignoring unknown aesthetics: fill 

There is no warning when using contrast = TRUE without a fill aesthetic, which would probably be more useful.

Error in: if(shades::lightness(text$fill) < 50) on line 297 in geom_fit_text.R

A few places you have correctly corrected the reverse-colours feature to account for no fill-colour. However, on line 297 in geom_fit_text.R there seems to be missing this "correction". At least I get an Error in if (shades::lightness(text$fill) < 50) { : missing value where TRUE/FALSE needed if I have missing among the fill values.

Otherwise a great package!

Numbers don't move outside a small bar when using coord_flip()

Hello,

I've found that when using coord_flip on a bar chart the numbers don't automatically move outside the bar like they do without it.

I've used the example from the vignette on here;

ggplot(altitudes, aes(x = craft, y = altitude, label = altitude)) +
  geom_col() +
  geom_bar_text() +
     coord_flip()

example

vjust doesn't appear to be doing anything.

Trying to get vjust to work. 0 should put it at the bottom of the bar (as per docs) but doesn't appoear to me to have any affect:

ggplot(coffees, aes(x = coffee, y = proportion, label = ingredient, fill = ingredient)) + geom_col(position = "dodge") + geom_bar_text(position = "dodge", grow = TRUE, reflow = TRUE, vjust = 0)

Would really like to be able to put it above each bar of the bar plot with a vjust, but I don't think that is supported. Tried -0.3 (as I would do to move the text above the bar without this package) and that doesn't work either.

Using R3.6 and v0.8.0 of ggfittext.

Add thousands separator to geom_bar_text output

Hello,

I was wondering if it's possible to add thousands separator to the label created by geom_bar_text. I tried to search around but couldn't find any answer to this. Thank you for any pointer!

library(ggplot2)
library(ggfittext)

ggplot(altitudes, aes(x = craft, y = altitude, label = altitude)) +
  geom_col() +
  geom_bar_text()

Created on 2022-04-08 by the reprex package (v2.0.1)

Size as aestetic

Thank you so much for an excellent package! I might be missing something here, but it it possible to specify a default size and only have this kick in if the label doesn't fit? It seems like a common use case. In my situation I'm trying to plot metabolic pathways, where I would like gene and metabolite names to fit in their shapes, but I don't want very short names to be huge. If this seems like too specific a use case, I wonder if it's possible to use this to calculate and extract positions and sizes to then plot them "manually". Thanks again!

Cheers,
Rasmus

Curve text around a path

It would be very cool to have the ability to not just use polar transforms on text, but to curve text around an arbitrary path. I'll admit I have no idea how to do it, but I'm asking because I'm hoping to create something like the electoral snake plot.

labels come out different sizes

David, I think I'm still missing something here. What do setting teh ymin and ymax asthetics do? As I understand it they are the y limits on the box that the text is placed into. ymin being a value on the plot I understand, but ymax =1 I don't?

Also, when I run this code:

`
pdat <- tribble(
~key, ~value, ~Name, ~value_label,
"key", 2.02942183, 1, 2.03,
"key", 1.27338181, 2, 1.27,
"key", 4.98740337, 3, 4.99,
"key", 1.43705013, 4, 1.44,
"key", 0.07890787, 5, 0.08,
"key", 2.34419584, 6, 2.34,
"key", 1.66281582, 7, 1.66,
"key", 2.28072594, 8, 2.28,
"key", 7.88383825, 9, 7.88,
"key", 1.40415457, 10, 1.40,
"key", 5.54193876, 11, 5.54,
"key", 0.16704932, 12, 0.17,
"key", 11.75658642, 13, 11.76,
"key", 1.13801370, 14, 1.14,
"key", 1.86561319, 15, 1.87,
"key", 0.77266434, 16, 0.77,
"key", 1.29502135, 17, 1.30,
"key", 1.56975971, 18, 1.57,
"key", 0.31144624, 19, 0.31,
"key", 2.38041735, 20, 2.38,
"key", 0.95595724, 21, 0.96
)

ggplot(pdat, aes(x = Name, y = value, fill = key, label = value_label)) +
geom_col() +
ggfittext::geom_fit_text(aes(ymin = value_label, ymax = 1),
place = "bottom",
grow = FALSE,
reflow = TRUE)
`

The labels are different sizes and some are missing (presumably so small they could not be displayed.

I don't understand why this is happening if all the text is so similar?

Empty strings labelling error

Hi @wilkox , thanks again for the awesome package!

I noticed (via an inspectdf issue) that ggfittext::geom_fit_text() returns an error when any of the labels are 0 length strings (example below). I can add a fix for this locally for inspectdf (maybe replacing empties with something generic to display - I'm not sure yet, though if you have an opinion on this I'd also be keen to hear). For ggfittext specifically, I wondered more generally if the error should be made more meaningful, or whether the geom_fit_text() can be adapted to handle empties.

Thanks!

Alastair

library(ggplot2)
presidential$name[1] <- ""
ggplot(presidential, 
       aes(ymin = start, ymax = end, label = name, x = party)) +
  geom_fit_text(grow = TRUE)

allow numeric assignments to 'width' and 'height' params

Hi! This package is just what i was hoping to find, having run into plenty of issues squeezing text into boxes in a ggplot2 extension of my own.

I admittedly don't understand the constraints governing #2 , but it does seem consistent with other geoms (e.g. ggplot2::geom_tile()) to leave width and height as parameters rather than aesthetics. However, in other geoms (in my experience) this is done by passing numeric values (taken to be on the axis scales) rather than units. It seems worthwhile to allow both numeric and unit assignments, depending on the user's needs. In the params branch on my fork, i added setup_params and setup_data to GeomFitText and rearranged some of the internals in order to achieve this. I don't know if it upsets any existing uses, but it doesn't seem to cause problems for the vignette or testthat examples. (I added some tests, too.)

I should stress that i'm not a ggplot2 expert and my fixes derive from my own largely trial-and-error experience. That said, if this seems reasonable to you, i can send a PR, and either way i'd be very glad to have this functionality in a future release. Thanks for the great tool!

Use ggfittext with coord_polar()

Is it possible?

library(tidyverse)
library(ggfittext)

df <- data.frame(trt = c("a", "b", "c"), outcome = c(2.3, 1.9, 3.2))

p <- ggplot(df, aes(trt, outcome, label = outcome)) +
  geom_col() +
  geom_bar_text() 

p

# Not working as I would have expected, labels are not showing
p + 
  coord_polar()

Created on 2020-02-18 by the reprex package (v0.3.0)

fittext of axis labels

Sometimes axis labels (for categorical axis) are too long and the text should flow, just like the reflow option of ggfittext. Could ggfittext be expanded to use on axis labels as well, or is this outside the scope?

Error in grid::unit(x$height, "mm"): 'x' and 'units' must have length > 0

Hello,

I recently had this strange error. Can you tell me what I did wrong?

Thanks!

library(ggplot2)
library(ggfittext)

df <- data.frame(
  stringsAsFactors = FALSE,
  x = c(10,10,25,25,50,50,100,100,200,
        200,500,500),
  variable = c("AAA","nAAA","AAA","nAAA","AAA",
               "nAAA","AAA","nAAA","AAA","nAAA","AAA",
               "nAAA"),
  value = c(-4.5,-0.1,-1.2,0,-34.1,-1.8,-38.2,
            -2.1,-3.8,-0.1,0,0)
)
df
#>      x variable value
#> 1   10      AAA  -4.5
#> 2   10     nAAA  -0.1
#> 3   25      AAA  -1.2
#> 4   25     nAAA   0.0
#> 5   50      AAA -34.1
#> 6   50     nAAA  -1.8
#> 7  100      AAA -38.2
#> 8  100     nAAA  -2.1
#> 9  200      AAA  -3.8
#> 10 200     nAAA  -0.1
#> 11 500      AAA   0.0
#> 12 500     nAAA   0.0

p0 <- ggplot(df, aes(x = factor(x),
                     y = value,
                     label = value)) +
  facet_wrap(variable ~ .) +
  geom_col() +
  theme_bw()
p0

Error

p0 +
  geom_bar_text()
#> Error in grid::unit(x$height, "mm"): 'x' and 'units' must have length > 0

Created on 2020-11-28 by the reprex package (v0.3.0)

rich=TRUE ignores "place" argument

Using the rich=TRUE option, the place argument is ignored. hjust and vjust options also stop working.

Reproducible example below

ggplot(mtcars, aes( x = mpg, y = rownames(mtcars), label = rownames(mtcars), fill = cyl )) + geom_col() + geom_bar_text( place = "left", rich = FALSE )

ggplot(mtcars, aes( x = mpg, y = rownames(mtcars), label = rownames(mtcars), fill = cyl )) + geom_col() + geom_bar_text( place = "left", rich = TRUE )

Plotted colours different to specified color in geom_bar_text()

I'm not certain but I think since updating ggplot to 3.3 the colour does not line up to that which is specified in the col argument.

Minimal example below.

library(ggplot2)
library(ggfittext)

mtcars %>% 
  count(gear) %>% 
  ggplot(aes(x = gear, y = n)) +
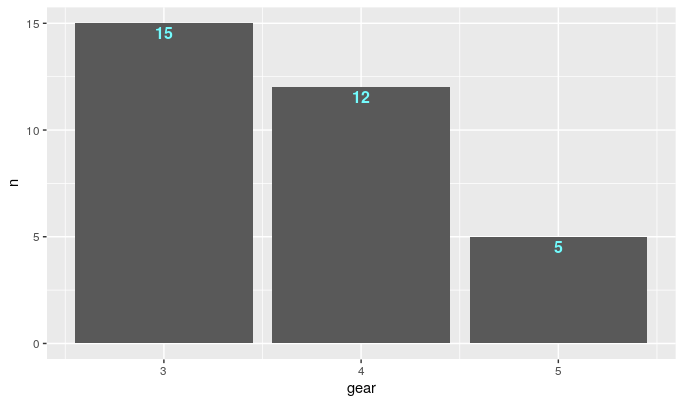
  geom_bar(stat = "identity") +
  geom_bar_text(col = "red", 
                fontface = "bold")

image

Package versions;
ggfittext_0.8.1.9002 ggplot2_3.3.0.9000 dplyr_0.8.3 R version 3.5.1

Using geom_bar_text() to plot two labels

Hello, I've been trying out ggfittext and find it to be fantastic!

I tried using geom_bar_text() to plot two labels inside the same bar plot. While it works it flags me with a strange warning. Is there a more appropriate manner to make such a plot?

library(ggplot2)
library(ggfittext)

df <- data.frame(
name = rownames(mtcars),
mtcars
)

ggplot(df[1:5, ], aes(x = name, y = mpg)) +
geom_col() +
geom_bar_text(aes(label = name), place = "left") +
geom_bar_text(aes(label = round(mpg)), place = "right") +
coord_flip() +
theme_void()

Warning messages:
1: In geom_bar_text(aes(label = name), place = "left") :
Ignoring unknown aesthetics: label
2: In geom_bar_text(aes(label = round(mpg)), place = "right") :
Ignoring unknown aesthetics: label

image

Fitting text with multiple font sizes

I have some tiles I'm trying to convert to auto-scaling using ggfittext, but I'm having problems with trying to make the first line larger than the body. I've tried font-size in pt, but it didn't seem to scale at all, in percentage, which it complained it couldn't convert to pt, , which it (not unreasonably) rejected at unimplemented, but the same with "#". Is there any way to get this to work?

image

`ylim()` causes errors in `geom_fit_text()`

Hi @wilkox

I've found that sometimes geom_fit_text() causes an error when ylim() is specified as part of the main plot call. There's a simple example below. It always fails if the ylim() is within the range of the y values for the geom_bar(). It also fails sometimes when the ylim() is near to (but not inside of the range of y. Is that a bug, or is there a good reason why this shouldn't work?

Thanks!

Alastair

z = data.frame(x = letters[1:5], y = 0:4, lb = 3)

# this works
z %>%
  ggplot(aes(x = x, y = y, label = lb)) + 
  geom_bar(stat = "identity", position = "dodge") + 
  ylim(-1, 6) + 
  geom_fit_text()

# this doesn't - ylim is inside the range of y
z %>%
  ggplot(aes(x = x, y = y, label = lb)) + 
  geom_bar(stat = "identity", position = "dodge") + 
  ylim(0.5, 3) + 
  geom_fit_text()

# this doesn't - ylim is outside the range of y
z %>%
  ggplot(aes(x = x, y = y, label = lb)) + 
  geom_bar(stat = "identity", position = "dodge") + 
  ylim(-0.1, 6) + 
  geom_fit_text()

fit text for pie plot

I wonder if I can apply this tool to the pie plot? For example:

# test data
data <- data.frame(group = letters[1:5], count = c(1, 2, 3, 1, 1), stringsAsFactors = FALSE)
data$label = paste(data$count," (",data$count*100/sum(data$count),"%)",sep = "")
        group count     label
    1     a     1 1 (12.5%)
    2     b     2   2 (25%)
    3     c     3 3 (37.5%)
    4     d     1 1 (12.5%)
    5     e     1 1 (12.5%)
# create plot
ggplot(data,aes(x = 1, y = count, fill = group, label = label)) + 
  geom_bar(width = 1, stat = "identity") + 
  coord_polar(theta = "y", start = 0) + 
  geom_fit_text()

pie_plot

Feature Request: Diverging bar plots

I'm having an issue trying to use geom_fit_text() on diverging bar graphs. It would be nice if geom_fit_text() worked better for the following:

library(ggplot2)
library(ggfittext)
theme_set(theme_bw())  

# Data Prep
data("mtcars")  # load data
mtcars$`car name` <- rownames(mtcars)  # create new column for car names
mtcars$mpg_z <- round((mtcars$mpg - mean(mtcars$mpg))/sd(mtcars$mpg), 2)  # compute normalized mpg
mtcars$mpg_type <- ifelse(mtcars$mpg_z < 0, "below", "above")  # above / below avg flag
mtcars <- mtcars[order(mtcars$mpg_z), ]  # sort
mtcars$`car name` <- factor(mtcars$`car name`, levels = mtcars$`car name`)  # convert to factor to retain sorted order in plot.

# Diverging Barcharts
ggplot(mtcars, aes(x=`car name`, y=mpg_z, label=mpg_z)) + 
  geom_bar(stat='identity', aes(fill=mpg_type), width=.5)  +
  geom_fit_text(aes(label = mpg_z)) +
  scale_fill_manual(name="Mileage", 
                    labels = c("Above Average", "Below Average"), 
                    values = c("above"="#00ba38", "below"="#f8766d")) + 
  labs(subtitle="Normalised mileage from 'mtcars'", 
       title= "Diverging Bars") + 
  coord_flip()

normal

If I try the grow = T option I get:

grow

And if I use theposition = "stack" option i get:

stack

It looks like the position ="stack" option is the closest to what I am desiring. Are "Dodge Challenger" and the others not mapped because they are simply too big of strings too fit inside the bars?

Various issues

Thanks for creating this package! I was playing around a bit and I think I might have found some issues? Or maybe I dont understand the package properly . Some examples below

library(ggplot2)
library(ggfittext)
library(data.table)
library(patchwork)

set.seed(1)

df <- data.table(group1 = sample(letters[1:10], 100, replace = TRUE),
group2 = sample(letters, 100, replace = TRUE),
var1 = rnorm(100))

df_agg <- df[, .(var1 = abs(sum(var1))), by = c('group1', 'group2')][, label := round(var1 * 100, 2) %>% paste('%', sep = '')]

Many labels are not shown

ggplot(df_agg, aes(x = group2, y = var1, fill = group1, label = label)) +
geom_bar(stat = 'identity', position = 'dodge') +
geom_bar_text(position = 'dodge', reflow = TRUE)

Labels are shown, so its not shown above due to long name. A warning maybe?

I would expect the labels to be on top of the bars

ggplot(df_agg, aes(x = group2, y = var1, fill = group1, label = str_sub(label, 1, 1))) +
geom_bar(stat = 'identity', position = 'dodge') +
geom_bar_text(position = 'dodge', reflow = TRUE, place = 'top')

No labels for group e, i,n

ggplot(df_agg, aes(x = group2, y = var1, fill = group1, label = str_sub(label, 1, 1))) +
geom_bar(stat = 'identity', position = 'dodge') +
geom_bar_text(position = 'dodge', reflow = TRUE, place = 'bottom')

Probably not related, but all text disappears in the patchplot. Any idea why?

p1 <- ggplot(df_agg[group2 %in% c('s', 'w', 'i')], aes(x = group1, y = var1, fill = group2, label = label)) +
geom_col(position = 'dodge') +
geom_bar_text(position = 'dodge', reflow = FALSE)

p1 + p1 + p1 + p1 + plot_layout(ncol = 4)

Using position_dodge2 does not work

ggplot(df_agg[group2 %in% c('s', 'w', 'i')], aes(x = group1, y = var1, fill = group2, label = label)) +
geom_col(position = position_dodge(preserve = 'single')) +
geom_bar_text(position = 'dodge', reflow = FALSE)

fit text around polar coordinates

I know this feature is still in development but I was hoping you could help me out with the following code. I'm trying to fit the outer text along the dotted lines instead of using geom_text(). ​I've attached the original file, the plot and the code below. I uncommented the geom_fit_text() for now. The code runs without throwing an error but no plot is being generated when using it.

Thanks so much for your help!

cv_plot.csv

![Rplot](https://user-images.githubusercontent.com/44852031/132983484-39709aff-1a0c-492f-b68a-9cdd2e1e5cf5.png)

# Libraries
library(tidyverse)
library(hrbrthemes)
library(kableExtra)
library(viridis)
library(svglite)
library(ggfittext)

# Load dataset
data <- read_csv("/Users/ruthschmidt/Desktop/cv_plot.csv") %>% 
        arrange(group)
data$id <- seq(1, nrow(data))

# Get the group and the y position of each label
label_data=data
number_of_bar=nrow(label_data)
angle= 90 - 360 * (label_data$id-0.5) /number_of_bar     # I substract 0.5 because the letter must have the angle of the center of the bars. Not extreme right(1) or extreme left (0)
label_data$hjust<-ifelse( angle < -90, 1, 0)
label_data$angle<-ifelse(angle < -90, angle+180, angle)

# prepare a data frame for base lines
base_data=data %>% 
        group_by(group) %>%
        summarize(start=min(id), end=max(id)) %>%
        rowwise() %>% 
        mutate(title=mean(c(start, end))) %>%
        rowid_to_column(var = "id")

# Make the plot
p = ggplot(data, aes(x=as.factor(id), y=value, fill=group)) +       # Note that id is a factor. If x is numeric, there is some space between the first bar
        
        geom_bar(aes(x=as.factor(id), y=value, fill=group), stat="identity", alpha=0.5) +
        geom_bar(aes(
                x=as.factor(id), 
                y=value, 
                fill=group), 
                stat="identity", 
                alpha=0.5) +
        ylim(-100,600) +
        theme_minimal() +
        theme(
                legend.position = "none",
                axis.text = element_blank(),
                axis.title = element_blank(),
                panel.grid = element_blank(),
                plot.margin = unit(rep(-1,4), "cm") 
        ) +
        coord_polar() + 
        geom_text(data=label_data, 
                  aes(
                  x=id, 
                  y=value+10, 
                  label=skill, 
                  hjust=hjust), 
                  color="dark grey", 
                  fontface="bold",
                  alpha=0.8, 
                  size=3.5, 
                  angle= label_data$angle, 
                  inherit.aes = FALSE ) +
        
        # Add base line information
        geom_segment(data=base_data, 
                aes(
                x = start, 
                y = 250, 
                xend = end, 
                yend = 250), 
                linetype = "dotted", 
                colour = "dark grey", 
                alpha=0.8, 
                size=0.6 , 
                inherit.aes = FALSE ) +
        # geom_text(data=base_data, aes(x = title, y = 240, label=group), hjust=base_data$hjust, colour = "dark grey", alpha=0.8, size=4, fontface="bold", inherit.aes = FALSE, angle= base_data$angle)
        geom_text(data=label_data,
                aes(
                x=id,
                y=300,
                label=group,
                hjust=hjust),
                color="dark grey",
                fontface="bold",
                alpha=0.8,
                size=4,
                angle= label_data$angle,
                inherit.aes = FALSE ) 
        # geom_fit_text(data=label_data,
        #               label=label_data$group,
        #               min.size = 0, 
        #               grow = TRUE)
        
p

# save plot
# ggsave(p, file="cv_circular.svg", width=10, height=10)


Constraining within a polygon, not just a geom_rect() or geom_tile()?

Asking more as a general inquiry, but is it possible to specify a custom boundary to constraining the text size? For example, if I had a trapezoid or a diamond or a triangle that I'd defined as a bounding coordinate, is there a way to use geom_fit_text() and have the text fully fill the bounding polygon? I can elaborate more as needed, but ideally, something like the following would work:

library(ggplot2)
library(ggfittext)

# Create a boundary for the text
text_boundary_df <- data.frame(
  x = c(0.75, 0.25, -0.75, -0.25, 0.75),
  y = c(0.25, 0.75, -0.25, -0.75, 0.25),
  text_to_fit = "A"
)

# Create a ggplot object with no data frame passed to it (per my use case)
g <- ggplot()

# Add some data to plot with geom_polygon()
g <- g +
  geom_polygon(
    data = df,
    aes(
      x = x,
      y = y,
      ....
    )
  )

# Add the constrained text
g <- g + 
  geom_polygon(
    data = text_boundary_df,
      aes(
        x = x,
        y = y
      ) 
  ) +
  geom_fit_text(
    data = text_boundary_df,
    aes(
      x = x,
      y = y,
      label = text_to_fit
    ) ,
    grow = TRUE
  )

Ideally this would place the "A" text inside of a rotated rectangle; is something like this possible?

geom_bar_text not work for my dataframe

Hello,

geom_bar_text can't work with stacked bar plots in my dataset. I tried with same code for the "beverages" dataset that you provided and it works. I couldn't find the reason. Could you give me some advice? How to label the cell type (group information) on the stacked bars?

Best regards and many thanks!
Sophia

percentData <- [email protected] %>% group_by(species,time.sum2) %>% dplyr::count(celltype2) %>%
  dplyr::mutate(ratio=(n/sum(n)))
percentData <- as.data.frame(percentData)
> head(percentData)
  species time.sum2 celltype2   n        ratio
1   Mouse       E10        MG  20 0.0141043724
2   Mouse       E10       ENC  45 0.0317348378
3   Mouse       E10      VLMC 103 0.0726375176
4   Mouse       E10        OD   1 0.0007052186
5   Mouse       E10       OPC   1 0.0007052186
6   Mouse       E10       Edy   1 0.0007052186
> str(percentData)
'data.frame':	308 obs. of  5 variables:
 $ species  : Factor w/ 3 levels "Mouse","Macaque",..: 1 1 1 1 1 1 1 1 1 1 ...
 $ time.sum2: Factor w/ 25 levels "E10","E11","E12",..: 1 1 1 1 1 1 1 1 1 1 ...
 $ celltype2: Factor w/ 13 levels "MG","ENC","VLMC",..: 1 2 3 4 5 6 7 8 9 10 ...
 $ n        : int  20 45 103 1 1 1 5 97 37 44 ...
 $ ratio    : num  0.014104 0.031735 0.072638 0.000705 0.000705 ...
> ggplot(percentData,aes(x=time.sum2,y=ratio,label=celltype2,fill=celltype2))+
+   geom_col(position = "stack")+
+   geom_bar_text(position = "stack", reflow = T)

image

> head(beverages)
    beverage    ingredient proportion
1      mocha      espresso       0.25
2      mocha     chocolate       0.15
3      mocha  steamed milk       0.25
4      mocha whipped cream       0.35
5 flat white      espresso       0.25
6 flat white  steamed milk       0.40
> str(beverages)
'data.frame':	6 obs. of  3 variables:
 $ beverage  : Factor w/ 2 levels "flat white","mocha": 2 2 2 2 1 1
 $ ingredient: Factor w/ 4 levels "chocolate","espresso",..: 2 1 3 4 2 3
 $ proportion: num  0.25 0.15 0.25 0.35 0.25 0.4
> ggplot(beverages, aes(x = beverage, y = proportion, label = ingredient,
+                       fill = ingredient)) +
+   geom_col(position = "stack") +
+   geom_bar_text(position = "stack", reflow = TRUE)

image

Warning message: Stacking not well defined when not anchored on the axis

Hi again @wilkox - thanks for your support this week. I think this question will probably be the last one from me for while 😊. I think I owe you a beer.

I have a case (also in inspectdf) where I build a stacked bar chart using geom_bar() then add labels with geom_fit_text()

library(ggfittext)
library(ggplot2)
library(magrittr)

x = data.frame(x = rep("a", 2), y = c(2, 2), lb = c(1, 2))
x %>%
  ggplot(aes(x = x, y = y, label = lb)) + 
  geom_bar(stat = "identity", colour = "black") + 
  geom_fit_text(position = "stack")

When printed, a warning is emitted: Warning message: Stacking not well defined when not anchored on the axis. This seems to be a ggplot2 message https://github.com/tidyverse/ggplot2/blob/master/R/position-stack.r that has something to do with the range of the data having to include 0.

I'd like to be able to hide the warning from users if possible - as far as I can tell, the warning isn't required as ggfittext is working perfectly in this case. Do you think there is a way around this?

Feature request: bar graphs

Hi, nifty package. Would it be possible to implement a feature for the labels (typically percentages) that could be printed on top of a stacked bar graph? Or at least hide those which won't fit?
I am currently using
geom_col(position = "fill") + geom_text(aes(label = sprintf(prop*100, fmt="%1.0f%%")), position = position_stack(vjust = 0.5), size=3)

desc_impcur_topic_var_18

Recommend Projects

  • React photo React

    A declarative, efficient, and flexible JavaScript library for building user interfaces.

  • Vue.js photo Vue.js

    🖖 Vue.js is a progressive, incrementally-adoptable JavaScript framework for building UI on the web.

  • Typescript photo Typescript

    TypeScript is a superset of JavaScript that compiles to clean JavaScript output.

  • TensorFlow photo TensorFlow

    An Open Source Machine Learning Framework for Everyone

  • Django photo Django

    The Web framework for perfectionists with deadlines.

  • D3 photo D3

    Bring data to life with SVG, Canvas and HTML. 📊📈🎉

Recommend Topics

  • javascript

    JavaScript (JS) is a lightweight interpreted programming language with first-class functions.

  • web

    Some thing interesting about web. New door for the world.

  • server

    A server is a program made to process requests and deliver data to clients.

  • Machine learning

    Machine learning is a way of modeling and interpreting data that allows a piece of software to respond intelligently.

  • Game

    Some thing interesting about game, make everyone happy.

Recommend Org

  • Facebook photo Facebook

    We are working to build community through open source technology. NB: members must have two-factor auth.

  • Microsoft photo Microsoft

    Open source projects and samples from Microsoft.

  • Google photo Google

    Google ❤️ Open Source for everyone.

  • D3 photo D3

    Data-Driven Documents codes.