Coder Social home page Coder Social logo

widgetti / ipyvolume Goto Github PK

View Code? Open in Web Editor NEW
1.9K 52.0 233.0 74.54 MB

3d plotting for Python in the Jupyter notebook based on IPython widgets using WebGL

License: MIT License

Python 32.02% Shell 0.06% CSS 0.18% GLSL 11.78% TypeScript 43.81% JavaScript 9.23% Jupyter Notebook 1.21% Vue 1.70%
ipython-widget jupyter jupyter-notebook python visualisation volume-rendering virtual-reality plotting dataviz scientific-visualization

ipyvolume's Introduction

ipyvolume

Join the chat at https://gitter.im/maartenbreddels/ipyvolume Documentation Version Anaconda-Server Badge Coverage Status Build Status

Try out in mybinder: Binder

3d plotting for Python in the Jupyter notebook based on IPython widgets using WebGL.

Ipyvolume currently can

  • Do (multi) volume rendering.
  • Create scatter plots (up to ~1 million glyphs).
  • Create quiver plots (like scatter, but with an arrow pointing in a particular direction).
  • Render isosurfaces.
  • Do lasso mouse selections.
  • Render in the Jupyter notebook, or create a standalone html page (or snippet to embed in your page).
  • Render in stereo, for virtual reality with Google Cardboard.
  • Animate in d3 style, for instance if the x coordinates or color of a scatter plots changes.
  • Animations / sequences, all scatter/quiver plot properties can be a list of arrays, which can represent time snapshots.
  • Stylable (although still basic)
  • Integrates with

Ipyvolume will probably, but not yet:

  • Render labels in latex.
  • Show a custom popup on hovering over a glyph.

Documentation

Documentation is generated at readthedocs: Documentation

Screencast demos

Animation

screencast

(see more at the documentation)

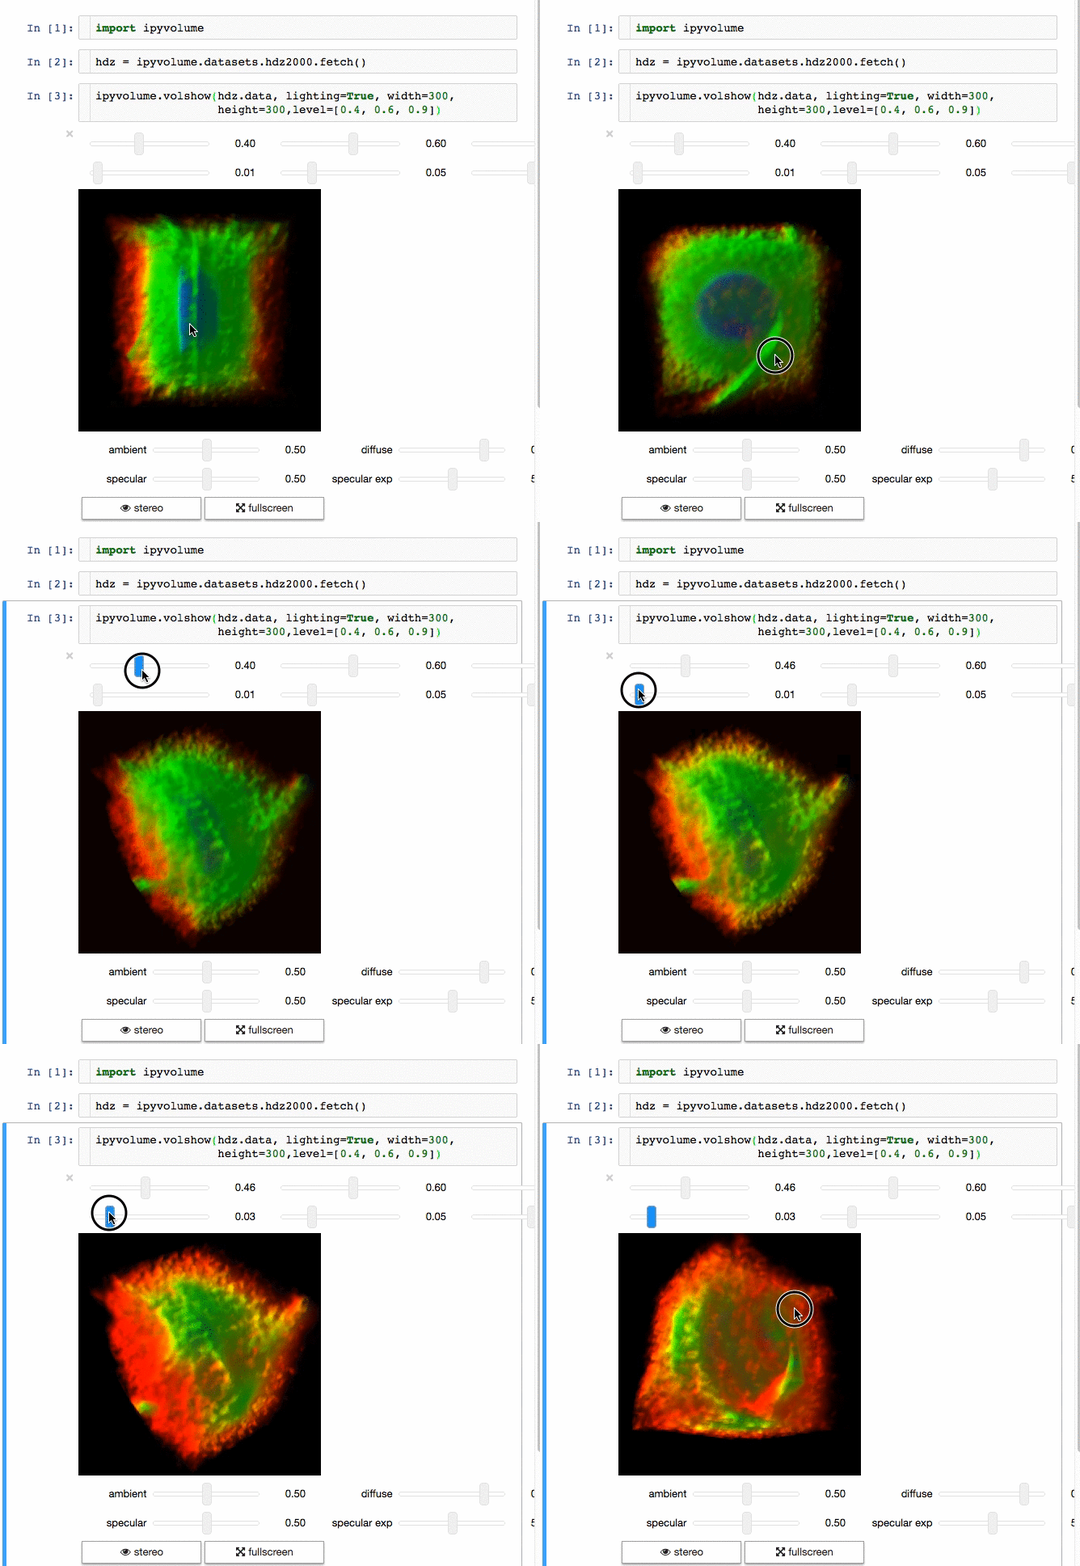
Volume rendering

screencast

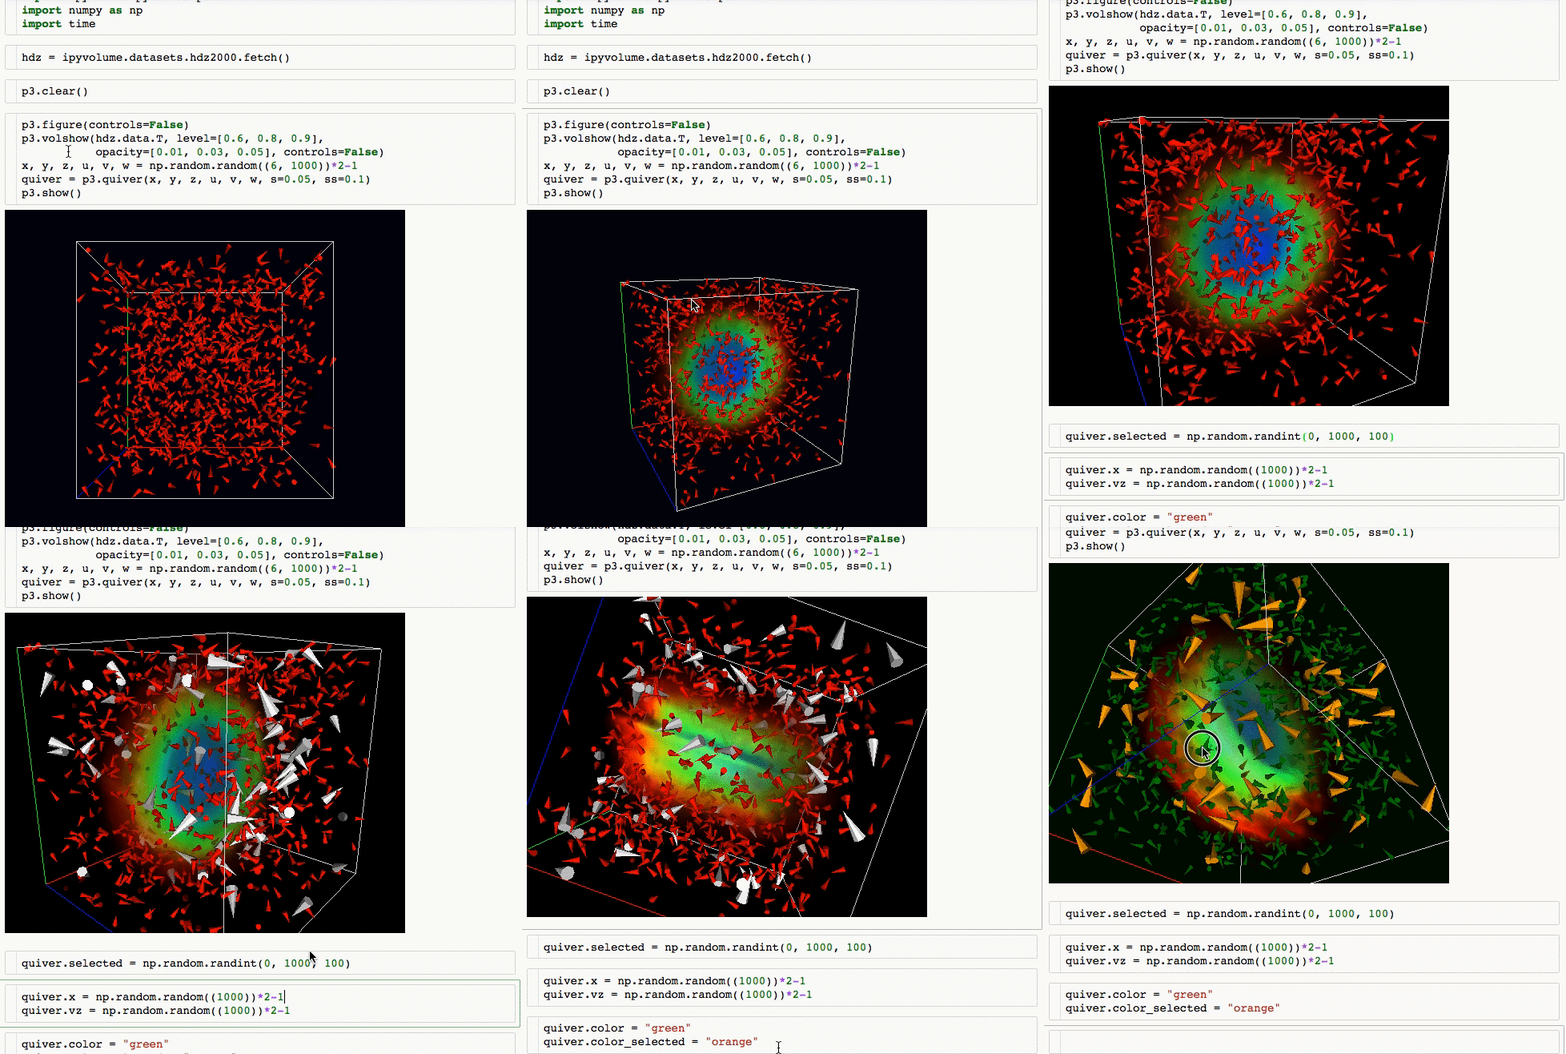
Glyphs (quiver plots)

screencast quiver

Installation

If you want to use Jupyter Lab, please use version 3.0.

Using pip

Advice: Make sure you use conda or virtualenv. If you are not a root user and want to use the --user argument for pip, you expose the installation to all python environments, which is a bad practice, make sure you know what you are doing.

$ pip install ipyvolume

Conda/Anaconda

$ conda install -c conda-forge ipyvolume

Pre-notebook 5.3

If you are still using an old notebook version, ipyvolume and its dependend extension (widgetsnbextension) need to be enabled manually. If unsure, check which extensions are enabled:

$ jupyter nbextension list

If not enabled, enable them:

$ jupyter nbextension enable --py --sys-prefix ipyvolume
$ jupyter nbextension enable --py --sys-prefix widgetsnbextension

Pip as user: (but really, do not do this)

You have been warned, do this only if you know what you are doing, this might hunt you in the future, and now is a good time to consider learning virtualenv or conda.

$ pip install ipyvolume --user
$ jupyter nbextension enable --py --user ipyvolume
$ jupyter nbextension enable --py --user widgetsnbextension

Developer installation

$ git clone https://github.com/maartenbreddels/ipyvolume.git
$ cd ipyvolume
$ pip install -e . notebook jupyterlab
$ (cd js; npm run build)
$ jupyter nbextension install --py --overwrite --symlink --sys-prefix ipyvolume
$ jupyter nbextension enable --py --sys-prefix ipyvolume
# for jupyterlab (>=3.0), symlink share/jupyter/labextensions/bqplot-image-gl
$ jupyter labextension develop . --overwrite

Developer workflow

Jupyter notebook (classical)

Note: There is never a need to restart the notebook server, nbextensions are picked up after a page reload.

Start this command:

$ (cd js; npm run watch)

It will

  • Watch for changes in the sourcecode and run the typescript compiler for transpilation of the src dir to the lib dir.
  • Watch the lib dir, and webpack will build (among other things), ROOT/ipyvolume/static/index.js.

Refresh the page.

ipyvolume's People

Contributors

0xflotus avatar agoose77 avatar alpeshyadav avatar bluetyson avatar buzmakov avatar choldgraf avatar chrisjsewell avatar cvisl avatar datapythonista avatar genevievebuckley avatar glyg avatar hamogu avatar jackieleng avatar jeammimi avatar jmeyers314 avatar jtpio avatar kingjr avatar kmader avatar larsoner avatar maartenbreddels avatar mathieu1 avatar maxstrobel avatar mgeier avatar olehkss avatar oliverevans96 avatar pllim avatar satra avatar sylvaincorlay avatar thewtex avatar tirkarthi avatar

Stargazers

 avatar  avatar  avatar  avatar  avatar  avatar  avatar  avatar  avatar  avatar  avatar  avatar  avatar  avatar  avatar  avatar  avatar  avatar  avatar  avatar  avatar  avatar  avatar  avatar  avatar  avatar  avatar  avatar  avatar  avatar  avatar  avatar  avatar  avatar  avatar  avatar  avatar  avatar  avatar  avatar  avatar  avatar  avatar  avatar  avatar  avatar  avatar  avatar  avatar  avatar  avatar  avatar  avatar  avatar  avatar  avatar  avatar  avatar  avatar  avatar  avatar  avatar  avatar  avatar  avatar  avatar  avatar  avatar  avatar  avatar  avatar  avatar  avatar  avatar  avatar  avatar  avatar  avatar  avatar  avatar  avatar  avatar  avatar  avatar  avatar  avatar  avatar  avatar  avatar  avatar  avatar  avatar  avatar  avatar  avatar  avatar  avatar  avatar  avatar  avatar

Watchers

 avatar  avatar  avatar  avatar  avatar  avatar  avatar  avatar  avatar  avatar  avatar  avatar  avatar  avatar  avatar  avatar  avatar  avatar  avatar  avatar  avatar  avatar  avatar  avatar  avatar  avatar  avatar  avatar  avatar  avatar  avatar  avatar  avatar  avatar  avatar  avatar  avatar  avatar  avatar  avatar  avatar  avatar  avatar  avatar  avatar  avatar  avatar  avatar  avatar  avatar  avatar  avatar

ipyvolume's Issues

Proper scaling for non-cubic data

All volshow volumes seem to render their data into a cube. This causes distortion when the data provided lies in a box. For example, I am using ipyvolume to render fluorescence images of cultured cells. The volumes are typically hundreds of microns wide, but only tens of microns deep. Rendering in ipyvolume stretches these significantly along the depth direction.

Note that this is related to #11, but not the same problem. Even if you resample your data to isotropic, if the overall volume is not a perfect cube, it gets distorted.

A quick and dirty fix is to pad the data with zeros so that it is cubic, but the overextended cube outline is retained. Instead, the axis outlines should show whatever box the data came in.

Perhaps a nice fix would be a way to control the render volume dimensions in addition to the canvas dimensions that can already be controlled through figure.

Exception while installing current git master

$ pip install --user -e .
Obtaining file:///home/user/repos/ipyvolume
Requirement already satisfied: ipywidgets>=6.0.0b5 in /usr/lib/python3.6/site-packages (from ipyvolume==0.4.0a2)
Requirement already satisfied: numpy in /usr/lib/python3.6/site-packages (from ipyvolume==0.4.0a2)
Requirement already satisfied: traittypes in /home/user/.local/lib/python3.6/site-packages (from ipyvolume==0.4.0a2)
Requirement already satisfied: traitlets in /usr/lib/python3.6/site-packages (from ipyvolume==0.4.0a2)
Requirement already satisfied: Pillow in /usr/lib/python3.6/site-packages (from ipyvolume==0.4.0a2)
Requirement already satisfied: pandas in /usr/lib/python3.6/site-packages (from traittypes->ipyvolume==0.4.0a2)
Requirement already satisfied: olefile in /usr/lib/python3.6/site-packages (from Pillow->ipyvolume==0.4.0a2)
Requirement already satisfied: python-dateutil>=2 in /usr/lib/python3.6/site-packages (from pandas->traittypes->ipyvolume==0.4.0a2)
Requirement already satisfied: pytz>=2011k in /usr/lib/python3.6/site-packages (from pandas->traittypes->ipyvolume==0.4.0a2)
Requirement already satisfied: six>=1.5 in /usr/lib/python3.6/site-packages (from python-dateutil>=2->pandas->traittypes->ipyvolume==0.4.0a2)
Installing collected packages: ipyvolume
  Running setup.py develop for ipyvolume
Successfully installed ipyvolume

$ jupyter nbextension install --py --symlink ipyvolume
Traceback (most recent call last):
  File "/usr/bin/jupyter-nbextension", line 6, in <module>
    main()
  File "/usr/lib/python3.6/site-packages/jupyter_core/application.py", line 267, in launch_instance
    return super(JupyterApp, cls).launch_instance(argv=argv, **kwargs)
  File "/usr/lib/python3.6/site-packages/traitlets/config/application.py", line 658, in launch_instance
    app.start()
  File "/usr/lib/python3.6/site-packages/notebook/nbextensions.py", line 900, in start
    super(NBExtensionApp, self).start()
  File "/usr/lib/python3.6/site-packages/jupyter_core/application.py", line 256, in start
    self.subapp.start()
  File "/usr/lib/python3.6/site-packages/notebook/nbextensions.py", line 678, in start
    self.install_extensions()
  File "/usr/lib/python3.6/site-packages/notebook/nbextensions.py", line 657, in install_extensions
    **kwargs
  File "/usr/lib/python3.6/site-packages/notebook/nbextensions.py", line 211, in install_nbextension_python
    m, nbexts = _get_nbextension_metadata(module)
  File "/usr/lib/python3.6/site-packages/notebook/nbextensions.py", line 1034, in _get_nbextension_metadata
    m = import_item(module)
  File "/usr/lib/python3.6/site-packages/traitlets/utils/importstring.py", line 42, in import_item
    return __import__(parts[0])
  File "/home/user/repos/ipyvolume/ipyvolume/__init__.py", line 5, in <module>
    from .volume import *
  File "/home/user/repos/ipyvolume/ipyvolume/volume.py", line 12, in <module>
    from .transferfunction import *
  File "/home/user/repos/ipyvolume/ipyvolume/transferfunction.py", line 40, in <module>
    class TransferFunctionJsBumps(TransferFunction):
TypeError: function() argument 1 must be code, not str

Rendering result is gong after switching between 'stereo' and 'fullscreen'

I basically only changed the dataset from the example code, and here is what happened after toggle between view modes:

image

Here is my Jupyter Notebook info:

The version of the notebook server is 4.4.1 and is running on:
Python 2.7.12 |Continuum Analytics, Inc.| (default, Jul  2 2016, 17:43:17) 
[GCC 4.2.1 (Based on Apple Inc. build 5658) (LLVM build 2336.11.00)]

Any ideas? Thanks!

Control of camera?

Hi,
Firstly this looks like a lovely, simple, and powerful package. I'm exploring using it instead of MayaVI for large data set 3D visualization and animation in Jupyter Notebook.

I've been looking around in the API for the ability to set the camera view angle or orientation in code. I.e. so that my view always shows up at a specific Elevation and Azimuth angle.

This is done, for example, in mayavi as mlab.view(aximuth, elevation) and in matplotlib (mplot3d) as ax.view_init(angle1, angle2).

Is there anything like this in ipyvolume?

Thank you so much,
~ A

Initial sync of axis & tick labels

When initially displaying a figure, I'm getting this happen, whereby the labels are the wrong color and the tick labels are not correctly spaced:

image

This is rectified as soon as you click on the figure and, also, doesn't seem to happen if there is a volume in the figure

Color and size per glyph

This is great!

Feature request for scatter plots: would be fantastic if you could set the color and size of each glyph individually, for visualization of multidimensional scientific data.

hacking in text annotations?

Hey, I'd like to hack in support for rendering text annotations at a subset of the points in a quiver plot. Do you have any suggestions for how to go about this? I haven't seen anything remotely promising given the lack of support for custom glyphs etc.

`scatter` and `plot` don't plot multiple sets of points

In the docs it suggests you could do something like:

data = np.random.randn(3, 1000, 100)
ipyv.plot(*data)

and that this would plot 1000 lines of length 100.

Currently when I run the above code, it only plots a single line (as if I had run ipyv.plot(*data[:, 0, :]). Any idea what's going on?

OrthographicCamera and/or Hook for Perspective Angle

Hey Maarten, great package!
I've been playing around with it to visualize electron densities from quantum computations;
https://chrisjsewell.github.io/ipyvolume_si_ech3

However, the large hard-wired perspective angle is a bit of a pain for viewing trends along certain directions. So it would be great, ideally, to have the option for the Orthographic Camera, or at least the PerspectiveCamera VIEW_ANGLE (in figure.js) linked to a Figure trait.

On a related note, up until the last few weeks, I have no experience with JS. Apparently it is an interpreted language, but, if I try changing VIEW_ANGLE in the source code (figure.js), like I would for Python code, this doesn't change anything. Is there extra steps I need to take? Do I need to compile something?

FYI, for my work, other nice to haves would be;

  • creating line objects (to show atomic bonds)
    • I know I can do this in pythreejs, but it would be nice to have it integrated
  • creating isosurfaces
    • or, more fancy, would be to create a moveable/rotatable plane in the figure, that is linked to a plot, that shows the density/isocurves for that slice.

Zoom continues upon rotate

  1. Zoom in or out
  2. Rotate

Zooming continues automatically in the same direction upon rotation, which can be confusing. Any idea why this might be occurring?

Oliver

py.examples do not work in conda installed ipyvolume and install from source does not work

I tried to get ipyvolume running on my system but I only get several parts to work when I install ipyvolume via anaconda install and the other methods don't work at all.
For the anaconda version it installed perfectly and the volume examples work but when I try the klein_bottle example it says that examples don't exist:

---------------------------------------------------------------------------
AttributeError                            Traceback (most recent call last)
<ipython-input-5-3c58397b310f> in <module>()
      1 import ipyvolume.pylab as p3
----> 2 x, y, z, u, v = p3.examples.klein_bottle(draw=False)
      3 p3.figure()
      4 m = p3.plot_mesh(x, y, z, wireframe=False)
      5 p3.squarelim()

AttributeError: module 'ipyvolume.pylab' has no attribute 'examples'

And when I try to install ipyvolume through pip or through installing it with the source code I get the following errors in the chrome developer tools:


menubar.js:303 actions jupyter-notebook:find-and-replace does not exist, still binding it in case it will be defined later...
MenuBar.bind_events @ menubar.js:303
utils.js:60 load_extensions Arguments(1)
(unknown) loading custom/custom
session.js:54 Session: kernel_created (5ca191a9-935c-47df-b316-099b571db1e2)
kernel.js:459 Starting WebSockets: ws://localhost:8888/api/kernels/ef365974-354e-46b8-8a19-77496eb1cf44
(unknown) loading nbextensions/ipyvolume/extension
utils.js:37 Loading extension: ipyvolume/extension
(unknown) loading codemirror/mode/javascript/javascript
:8888/nbextensions/widgets/notebook/js/extension.js?v=20170731141024 Failed to load resource: the server responded with a status of 404 (Not Found)
main.js:223 Widgets are not available.  Please install widgetsnbextension or ipywidgets 4.0
(anonymous) @ main.js:223
(unknown) loading nbextensions/ipyvolume/index
kernel.js:103 Kernel: kernel_connected (ef365974-354e-46b8-8a19-77496eb1cf44)
kernel.js:103 Kernel: kernel_ready (ef365974-354e-46b8-8a19-77496eb1cf44)
VM93:3 loading nbextensions/ipyvolume/index
utils.js:910 Could not open comm  --  Error: Class jupyter.widget not found in registry 
    at utils.js:874
    at new Promise (<anonymous>)
    at Object.load_class (utils.js:859)
    at CommManager.comm_open (comm.js:84)
    at i (jquery.min.js:4)
    at Kernel._handle_iopub_message (kernel.js:1223)
    at Kernel._finish_ws_message (kernel.js:1015)
    at kernel.js:1006
    at <anonymous>
(anonymous) @ utils.js:910
kernel.js:1007 Couldn't process kernel message WrappedError

trisurf / surface opacity?

Is it technically possible to change the opacity of a mesh? The API doesn't seem to allow it now but would it be easy to add?

screenshot from 2017-08-20 17-24-30

quickvolshow breaks silently if data is 'too big'

Firstly, awesome library! I'm having a blast working with it.

I'm working with CT scans and have some pretty large 3d volumes. It seems like if they get a bit too big, I get a blank cell, no widgets, no display. Right now it's choking on an int16 numpy array of dimension (332, 500, 500). Very much non-sparse.

If I shrink it to (272, 500, 500) I get the sliders and the display, but there is no data in it.

(252, 500, 500) works.
(262, 500, 500) nope.
(258, 500, 500) works.

If it's any clue, it feels like the cutoff is right around but slightly above 128 megabytes (64,500,000 int16's). Almost not quite 2**27.

I do occasionally get

/home/USER/ve/ml/lib/python3.5/site-packages/ipyvolume/serialize.py:18: RuntimeWarning: invalid value encountered in true_divide grid_normalized = (grid*1.0 - vmin) / (vmax - vmin)

but I think this is just due to the gradient vanishing at certain parts of the geometry. This occurs even when it successfully displays.

Improvement suggestions and a few bugs

Hey Maarten, I've just got round to making a more comprehensive worked example of how I'm building on ipyvolume (for visualisation of atomic data). Which is available as a Notebook, PDF, HTML or Reveal.JS slideshow document (take your pick! ). During this I compiled a todo list with some improvements and minor bugs that I noticed:

  • Orthographic camera. Not yet implemented in ipyvolume, see this issue for current status.
  • better control of spheres
    • exact control of radii length (radius rather than scaling size)
    • more segments (either direct control of segments, or a "sphere_hi_res" type)
    • transparency/alpha level
    • should color allow (r,g,b) tuple/array?
      because at the moment that doesn't work
  • creation of array of arbitrary lines (like scatter but with; x0,y0,z0,x1,y1,z1)
    • show lattice bounding boxes: parallelepiped wire frames
    • show bonds (i.e. connections) between different scatters
  • show nearest-neighbour coordination: polygons with vertices at nearest-neighbour positions
  • functional (browser side) controls, e.g. slider to translate/rotate point set. Not yet implemented in ipywidgets, see this issue for current status.
  • volumes:
    • RuntimeWarning: invalid value encountered in true_divide
      (serialize.py:43) presumably for (0,0,0) gradients
    • rarely get artifact rendering
    • isosurface rendering
    • multiple volumes in single plot
    • volumes with arbitrary centres
    • rotating volumes
  • fullscreen
    • fails to open if multiple views instantiated
    • if volume is present,
      then the rendering becomes very low resolution
      and, sometimes, the volume disappears completely on exit
  • 2d volume representation
    • define slice into cube and use matplotlib.contour

I'll try and address some myself and obviously some of these are niche for my use, but though it my be good to put it here, so its in your thinking.

Ta, Chris

Plot two volumes in one viewer?

Hi, is there an easy way to plot two (or more) volumes in one viewer simultaneously? I have some data of Orion cloud but from different component (dust, gas, etc.), I want to have them plotted all at once with volshow or quickvolshow. Thanks!

Multicolor/size issues

Setting colors per datapoint doesn't work:

import ipyvolume
x = np.array([1,2,3,4,5])
y = np.array([2,4,3,2,1])
z = np.array([9,8,3,4,1])
#c = np.array(['red','green','blue','yellow','cyan'])
#c = np.array([(1,1,0), (1,1,0), (1,1,0), (1,1,0), (1,1,0)])
#c = [[1,1,0], [1,1,0],[1,1,0],[1,1,0],[1,1,0]]
c = [1,1,0]
ipyvolume.quickscatter(x, y, z, color=c, size=0.1, marker="sphere")

The result is white spheres in every case.

Also, setting the size doesn't work:

import ipyvolume
x = np.array([1,2,3,4,5])
y = np.array([2,4,3,2,1])
z = np.array([9,8,3,4,1])
s = np.array([1, 2, 3, 4, 5])/10
ipyvolume.quickscatter(x, y, z, color='blue', size=s, marker="sphere")

The result is no spheres at all.

Probably I'm misunderstanding the API, but an example would help.

Finally, I think the case where the color is given as a 1D array of floats should be reserved for a colormap, NOT interpreted as an rgb value. By default, the matplotlib default colormap should be used, or a custom colormap given by the parameter cmap=.

Tagging @jeammimi

How to display a movie? / missing pylab.cla or clf

Hi!
Your library seems quite interesting and I would like to use it to render some molecular dynamic
movie.
But for this I would need to be able to add the time dimension. I am not very familiar with ipywidget, and I tried to do it with interact:

from IPython.html.widgets import interact, fixed,interact_manual,IntSlider,VBox
import numpy as np
import ipyvolume
import ipyvolume.pylab as p3
import numpy as np

p3.figure()

def toi(time): 
    x = np.array([ 2 * t + np.arange(10) for t in range(5)])
    y = x**2
    z = 3 * x
    #x,y,z are two dimentionnal array with the first dimension being time
    s = p3.scatter(x[time],y[time],z[time], s=0.005)
    

interact(toi,time=IntSlider(min=0,max=4,step=1,value=0))

VBox([p3.gcc()])

But it does not really do what I want, because it does not remove the old points when I move through time. Also I think it does some rescaling.
Do you have any sugestion?

Thanks!

"invalid value encountered in true_divide" i.e. divide by zero error

I am trying out ipyvolume for the first time. I'm using a conda python 3 environment. I tried the pip installation instructions first, had trouble then tried the conda installation instructions. When I run the code example:

import numpy as np
import ipyvolume
V = np.zeros((128,128,128)) # our 3d array
# outer box
V[30:-30,30:-30,30:-30] = 0.75
V[35:-35,35:-35,35:-35] = 0.0
# inner box
V[50:-50,50:-50,50:-50] = 0.25
V[55:-55,55:-55,55:-55] = 0.0
ipyvolume.quickvolshow(V, level=[0.25, 0.75], opacity=0.03, level_width=0.1, data_min=0, data_max=1)

I get:

/home/awagner/src/anaconda3/lib/python3.5/site-packages/ipyvolume/serialize.py:21: RuntimeWarning: invalid value encountered in true_divide
gradient = gradient / np.sqrt(gradient[0]**2 + gradient[1]**2 + gradient[2]**2)

In the "cube_to_png" function in serialize.py, the gradient vector may be zero, and therefore cannot be normalized to unit length. But I don't even understand why a serialization function should be getting called when you're just doing a live render...

Additional interactive camera controls

Hello!

Thanks for the awesome package! The work you've done is incredible. I have two camera-related feature requests. Perhaps they're already implemented and I haven't found them yet.

The first is panning. For example, shift-LMB & drag to pan? This is a pretty standard feature in 3d viewers which would be very handy.

Second is "turntable rotation" where the z axis is constrained to be pointing up. More info: https://blender.stackexchange.com/questions/657/what-is-the-difference-between-the-trackball-and-turntable-style-view-modes

Turntable is well implemented in plotly: https://help.plot.ly/getting-to-know-the-plotly-modebar/#3d-charts

I'd be happy to help work on this if you point me in the right direction.

Thanks,
Oliver

Speed improvement.

I am starting to use it with my work, and in this example case, I am working with array of size 1000x2000 and it starts taking some time to execute.
Apparently a lot of time is spend on the checking and transfer of the data from python to javascript.
Any ideas of to improve this part ?
I provide the output of prun:

       67394998 function calls (56976840 primitive calls) in 41.346 seconds

   Ordered by: internal time

   ncalls  tottime  percall  cumtime  percall filename:lineno(function)
10116086/80    9.798    0.000   35.256    0.441 jsonutil.py:97(json_clean)
 12531198    8.719    0.000   14.622    0.000 abc.py:178(__instancecheck__)
 25266778    8.120    0.000   22.742    0.000 {built-in method builtins.isinstance}
 17361221    5.904    0.000    5.904    0.000 _weakrefset.py:70(__contains__)
  7060/60    2.730    0.000   35.248    0.587 jsonutil.py:153(<listcomp>)
97928/196    1.199    0.000    2.413    0.012 pyparsing.py:943(_parseNoCache)
      160    1.143    0.007    1.144    0.007 encoder.py:203(iterencode)
        6    0.452    0.075    0.454    0.076 traitlets.py:169(repr_type)
    15410    0.383    0.000    0.383    0.000 {method 'tolist' of 'numpy.ndarray' objects}
      286    0.311    0.001    0.311    0.001 {built-in method numpy.core.multiarray.array}
107909/196    0.261    0.000    2.415    0.012 pyparsing.py:1023(_parseCache)
     7701    0.232    0.000    0.232    0.000 {pandas._window.roll_mean}
    40996    0.175    0.000    0.175    0.000 pyparsing.py:171(__init__)
      200    0.143    0.001    0.143    0.001 {method 'update' of '_hashlib.HASH' objects}
16727/1089    0.118    0.000    2.371    0.002 pyparsing.py:2345(parseImpl)

Plotting in Jupyter shows nothing, 404 error

Using ipyvolume 0.4.0, ipywidgets 7.0.1 from conda. All extensions installed and enabled.

$ jupyter nbextension list
Known nbextensions:
  config dir: /home/noah/.jupyter/nbconfig
    notebook section
    tree section
      ipyparallel/main  enabled
      - Validating: OK
  config dir: /home/noah/anaconda3/etc/jupyter/nbconfig
    notebook section
      jupyter-js-widgets/extension  enabled
      - Validating: OK
      ipyvolume/extension  enabled
      - Validating: OK
      jupyter-webrtc/extension  enabled
      - Validating: OK
  config dir: /usr/local/etc/jupyter/nbconfig
    notebook section

When creating a plot, the notebook server console outputs

[W 18:19:52.795 NotebookApp] 404 GET /static/components/preact/preact.min.js.map (171.65.101.77) 4.11ms referer=None
[W 18:19:52.801 NotebookApp] 404 GET /static/components/proptypes/index.js.map (171.65.101.77) 2.53ms referer=None
[W 18:19:52.804 NotebookApp] 404 GET /static/components/preact-compat/preact-compat.min.js.map (171.65.101.77) 2.57ms referer=None
[W 18:19:52.810 NotebookApp] 404 GET /nbextensions/ipyvolume/three.js.map (171.65.101.77) 4.62ms referer=None

And I get the following in my js console:

:8083/nbextensions/jupyter-js-widgets/extension.js?v=20170919181906:21509 Error: Could not create a view for model id eba62fc927eb48fd8650930d73a4f04b
    at promiseRejection (:8083/nbextensions/jupyter-js-widgets/extension.js?v=20170919181906:21509)
    at <anonymous>
promiseRejection @ :8083/nbextensions/jupyter-js-widgets/extension.js?v=20170919181906:21509

surface plots

I realize it's called ipyvolume, but what's the scope plan for ipyvolume.pylab? Are surface plots in scope? Or lines / contours / etc.? I guess another way of saying it is what subset of mplot3d would be appropriate to include here?

We're investigating 3D visualization tools in Jupyter, and the situation right now seems to be many tools, each of which solves a different small subset of 3D viz. I'm trying to get a handle on which ones are missing certain features because they are out of scope (and will stay that way), or because they haven't been implemented yet.

Style the resulting plot

Thank you for this great tool

I couldn't find any information in the docs on how to style the plot? I use seaborn, so I'd like this 3D plot to match the rest of my 2D plots generated by seaborn.

vaex dataset cannot be read in bqplot example

ERROR:MainThread:vaex.file:could not read 4 bytes from '/Users/scorlay/.vaex/data/helmi-dezeeuw-2000-10p.hdf5'
Downloading http://vaex.astro.rug.nl/data/helmi-dezeeuw-2000-10p.hdf5 to /Users/scorlay/.vaex/data/helmi-dezeeuw-2000-10p.hdf5
---------------------------------------------------------------------------
AttributeError                            Traceback (most recent call last)
<ipython-input-4-67d039f6bcd7> in <module>()
      1 ds = vaex.example()
      2 N = 2000 # for performance reasons we only do a subset
----> 3 x, y, z, vx, vy, vz, Lz, E = [ds.columns[k][:N] for k in "x y z vx vy vz Lz E".split()]

<ipython-input-4-67d039f6bcd7> in <listcomp>(.0)
      1 ds = vaex.example()
      2 N = 2000 # for performance reasons we only do a subset
----> 3 x, y, z, vx, vy, vz, Lz, E = [ds.columns[k][:N] for k in "x y z vx vy vz Lz E".split()]

AttributeError: 'NoneType' object has no attribute 'columns'

ipyvolume doesn't work with ipywidgets 7

This package is awesome, especially being able to embed in static pages!

I don't think this is news, but thought I'd report it. I'm working on a tutorial for scipy on Jupyter widgets and it would be great to include ipyvolume.

gradient division warning when rendering volume

I get the warning:

GitHub/ipyvolume/ipyvolume/serialize.py:43: RuntimeWarning: invalid value encountered in true_divide
gradient = gradient / np.sqrt(gradient[0]**2 + gradient[1]**2 + gradient[2]**2)

It may be to do with the fact that I have areas of my cube that are all np.nan, but I haven't tested yet

Output a screenshot outside of Jupyter notebook / Headless support

cc @choldgraf
ipyvolume is nice for exploring in the notebook, but when doing batch jobs people may want to output screenshots of simulations in a cluster/batch setting, not in a notebook (or at least not in the browser). It would be a shame if just for that you'd have to use another library.
At JupyterCon I've looked at this with @choldgraf and saw this was feasible. The current solution requires you to start chrome headless, and using the headless=True argument for savefig it will save the current viz to html, let chrome open that, make a screenshot, and save it to disk.

I'm opening this issue to focus the discussion here.
@choldgraf: would be nice if you could test this and give feedback if it really works in a headless environment.

The documentation is in the docstring of ipyvolume.headless
after the next release it will also be at readthedocs.

plot_isosurface error + warning from skimage

/opt/conda/envs/neuro/lib/python3.6/site-packages/skimage/measure/_marching_cubes_lewiner.py:167: skimage_deprecation:
 `marching_cubes` now uses a better and faster algorithm, and returns four instead 
of two outputs (see docstring for details). Backwards compatibility with 0.12 and prior 
is available with `marching_cubes_classic`. This function will be removed in 0.14, 
consider switching to `marching_cubes_lewiner`.
  warn(skimage_deprecation('`marching_cubes` now uses a better and '

---------------------------------------------------------------------------
ValueError                                Traceback (most recent call last)
<ipython-input-10-6038cff5224c> in <module>()
     13 fig.angley = 0
     14 fig.anglez = -np.pi/2
---> 15 vol = p3.plot_isosurface(V)
     16 p3.show()

/opt/conda/envs/neuro/lib/python3.6/site-packages/ipyvolume/pylab.py in plot_isosurface(data, level, color, wireframe, surface, controls)
    480     if level is None:
    481         level = np.median(data)
--> 482     verts, triangles = measure.marching_cubes(data, level)#, spacing=(0.1, 0.1, 0.1))
    483     x, y, z = verts.T
    484     mesh = plot_trisurf(x, y, z, triangles=triangles, color=color)

ValueError: too many values to unpack (expected 2)

Per-face colors in plot_trisurf

The docs for pylab.plot_trisurf state that triangles is of shape (N,3) and that color should also be of shape (N, 3), implying that the colors will apply to the triangle faces, not the vertices.

However, the observed behavior (on version 0.4.0a2 from PyPI) is to color the vertices.

colors = np.ones((4,3))*.3
colors[0, 2] = 1.0
colors[3, 2] = 1.0
plot_trisurf([0, 0, 3., 3.], [0, 4., 0, 4.], [1, 0., 0, 1.], 
                triangles=[[0, 2, 3], [0, 3, 1]], color=colors)

screen shot 2017-08-08 at 11 07 16 pm

If the above behavior is as intended? If so, is there another way to set the triangle face color directly?

Plot polyhedron only from its boundaries

My doubt is if it would be possible to plot with ipyvolume polyhedrons which I have only its boundaries coordinates (x, y and z) and a correspondent property value for its coordinates.
For example: I have this prism boundaries coordinates and a correspondent property value inside it x1:1 | x2:2 | y1:3 | y2:4 | z1:5 | z2:6 | density:2670 and another x1:4 | x2:5 | y1:3 | y2:4 | z1:5 | z2:6 | density:3690.
If I understood correctly, I should create a 3d numpy array with a grid that includes both prisms and maybe NaN where I don't want to plot any value. Something like figure a in this link: http://library.seg.org/action/showFullPopup?id=F1&doi=10.1190%2Ftle33040448.1

PS.: sorry for asking this in the other issue.

Freezing embedded html

Hey maarten,

As of today, I get an error when trying to view my embedded ipyvolume html files (only if it was created with the dev version):

ReferenceError: define is not defined
https://unpkg.com/@jupyter-widgets/html-manager@*/dist/index.js
Line 1

Presumably this is caused by the commit of the CombinedCamera define/import?

This was created with the pip ipyvolume (version 0.3) and conda ipywidgets (version 0.6), and still works fine:
https://chrisjsewell.github.io/ipyvolume_si_ech3.html

This was created with my dev ipyvolume (version 0.4 alpha) and pip ipywidgets (version 7.0), and no longer works:
https://chrisjsewell.github.io/3d_atomic/converted/3D%20Atomic%20Visualisation_files/ivol_example1.html

How can I rectify this and is there a way I can 'freeze' the embedded html, such that this won't happen again. I guess I need some .js files locally in the folder?

how to turn off axes?

I'm looking for the ipv equivalent of the matplotlib ax.set_axis_off method. Sometimes you don't want the box :-)

unevenly spaced coordinates for volume rendering

I just discovered ipyvolume and think it is fantastic! Thanks for this contribution to the python visualization world.

I work in ocean modeling, and I often want to visualize the output of my simulations using volume rendering. I have been using paraview (example), but it is pretty heavy duty and doesn't integrate well with the rest of my analysis pipeline. I would be thrilled to be able to stay in a notebook environment.

Ipyvolume could really fill a missing need for me if it supported unevenly spaced coordinates (as in a VTK rectilinear grid). I would like to be able to do something like this:

ipyvolume.volshow(data, x=x, y=y, z=z)

where x, y, and z, are one-dimensional coordinate variables. (Even better would be to be able to pass and xarray DataArray, which has the coordinates built in.)

Would this be a difficult feature to add?

Ensure all figure traits are synced when rendering

Sorry for flooding your issues section lol

So, for instance, setting fig.anglex = 45 will do nothing if it is before the figure has been displayed.

Adding this.update_current_control(); to the end of the render function fixes this issue for control traits, but is there a more general method to ensure all traits are synced?

Fullscreen resolution is poor when there is a volume in the scene

a few optimizations - delete a line, hide visibility during updates

i'm using a plot command to plot a set of lines together with interact.

  1. i see that each scatter object is being added to figure. how do i delete a particular object from the figure?
  2. how do i pause a visual update as i draw lines with interact? the opposite of p3.show()?

Rotation 'locks' at certain angles

I've noticed I can't freely rotate continuously in every axis. Trying to rotate around the pole that corresponds to numpy axis=2 only goes 180 degrees lock-to-lock. It feels like it is a limitation of the underlying 3D engine. Any idea if there is a way to work around this?

Recommend Projects

  • React photo React

    A declarative, efficient, and flexible JavaScript library for building user interfaces.

  • Vue.js photo Vue.js

    ๐Ÿ–– Vue.js is a progressive, incrementally-adoptable JavaScript framework for building UI on the web.

  • Typescript photo Typescript

    TypeScript is a superset of JavaScript that compiles to clean JavaScript output.

  • TensorFlow photo TensorFlow

    An Open Source Machine Learning Framework for Everyone

  • Django photo Django

    The Web framework for perfectionists with deadlines.

  • D3 photo D3

    Bring data to life with SVG, Canvas and HTML. ๐Ÿ“Š๐Ÿ“ˆ๐ŸŽ‰

Recommend Topics

  • javascript

    JavaScript (JS) is a lightweight interpreted programming language with first-class functions.

  • web

    Some thing interesting about web. New door for the world.

  • server

    A server is a program made to process requests and deliver data to clients.

  • Machine learning

    Machine learning is a way of modeling and interpreting data that allows a piece of software to respond intelligently.

  • Game

    Some thing interesting about game, make everyone happy.

Recommend Org

  • Facebook photo Facebook

    We are working to build community through open source technology. NB: members must have two-factor auth.

  • Microsoft photo Microsoft

    Open source projects and samples from Microsoft.

  • Google photo Google

    Google โค๏ธ Open Source for everyone.

  • D3 photo D3

    Data-Driven Documents codes.