
Gnocchi datasource for Grafana 3.x
$ sudo grafana-cli plugins install sileht-gnocchi-datasource
$ npm install
$ ./run-tests.sh  # This also build the plugin under dist/

$ ln -s dist /var/lib/grafana/plugins/grafana-gnocchi-datasource
$ # or
$ cp -a dist /var/lib/grafana/plugins/grafana-gnocchi-datasource
| Name | Description |
|---|---|
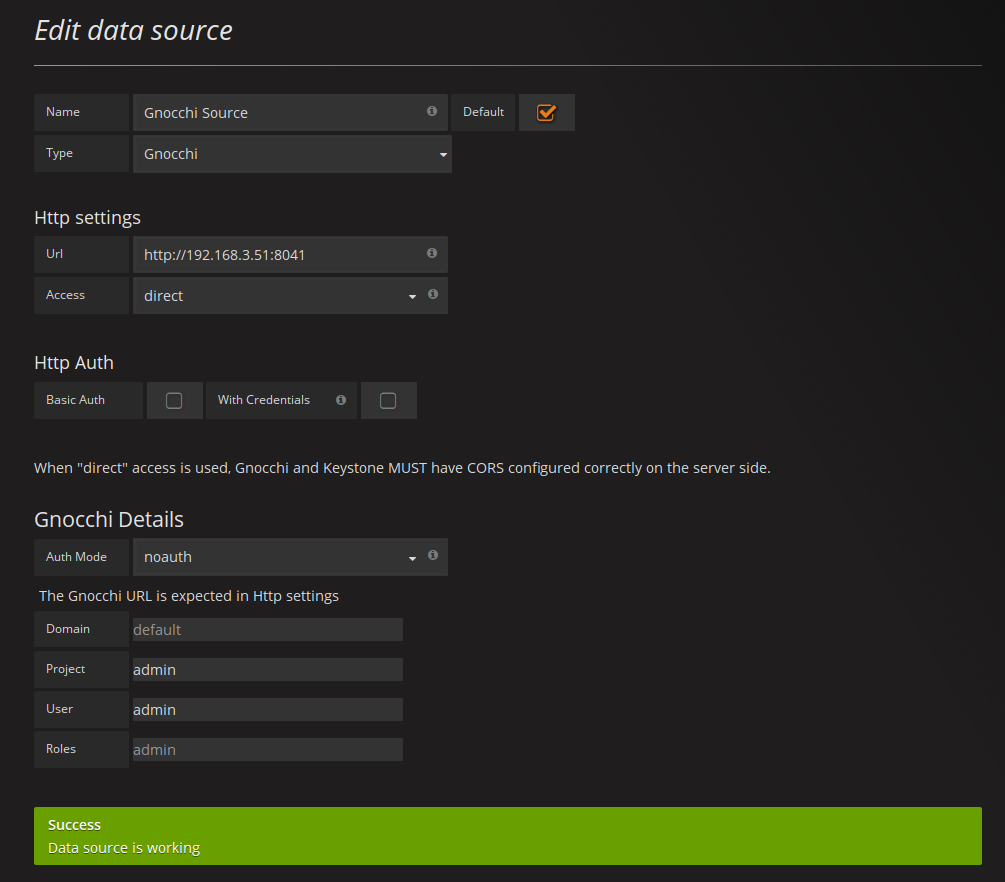
| Name | The data source name. |
| Default | Default data source means that it will be pre-selected for new panels. |
| Url | The http protocol, ip and port of your Keystone or Gnocchi server (default port is usually 8080) |
| Access | Proxy = access via Grafana backend, Direct = access directory from browser. |
| Token | A valid Keystone token |
| Project | The keystone user |
| User | The Keystone user |
| Password | The Keystone password |
Note: If the Keystone server is set as URL, the Gnocchi server will be autodiscovered. This works only if Access = Direct, and CORS is properly configured on Keystone and Gnocchi side.
Open a graph in edit mode by click the title.
The editor have 4 modes to retreives metrics, you can change the mode by clicking of the pencil on the right.
-
Measurements of a metric: Create one graph with datapoint of the defined metric
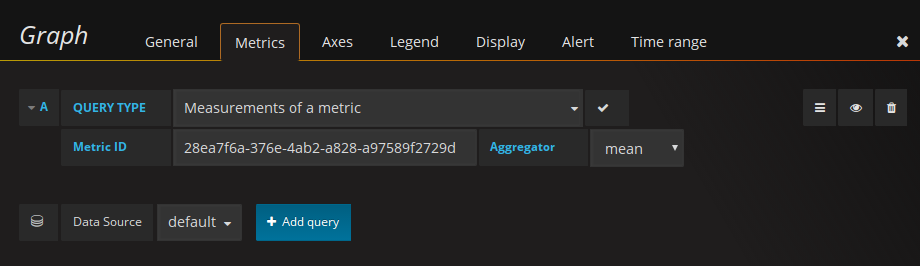
Metric ID: the id of the metric you are interrested in
-
Measurements of a metric of a resource: Create one graph with datapoint of the metric of the defined resource.

Resource ID: the id of the resource Resource type: the type of the resource (generic, instance, disk, ...) Metric name: the name of the metric
-
Measurements of a metric of multiple resources: Create one graph per metric find with the query.
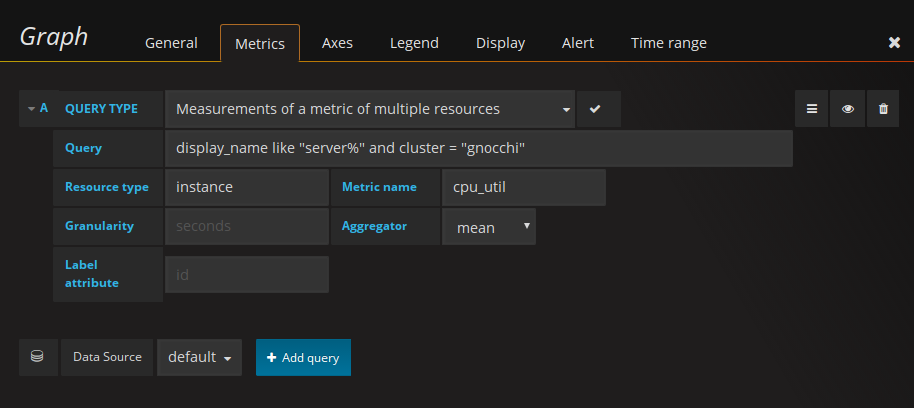
Query: the query to search resources Resource type: the type of the resource (generic, instance, disk, ...) Metric name: the name of the metric Label attribute: the label or the resource attribute to use as label.
-
Aggregated measurements of a metric across resources: Create one graph with an aggregation of all datapoints of metrics that match the query.
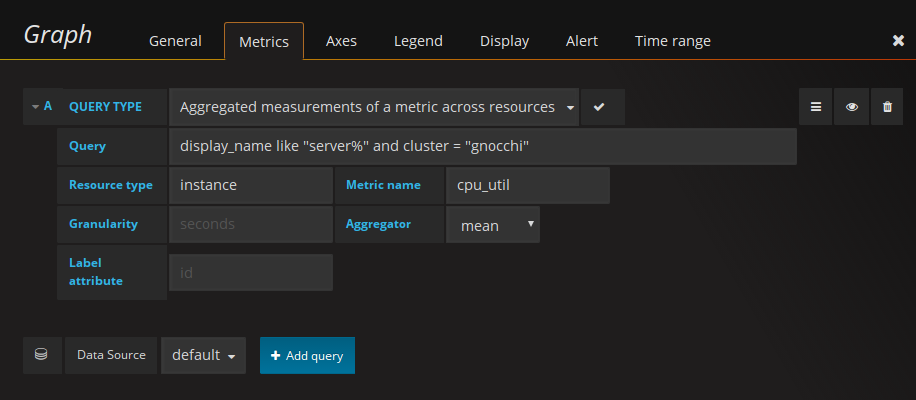
Query: the query to search resources Resource type: the type of the resource (generic, instance, disk, ...) Metric name: the name of the metric Label attribute: the label or the resource attribute to use as label.
Each mode also have the aggregator method to use to get datapoints of the metrics.
For details of Query format, please refer to the Gnocchi documentations.
Gnocchi Datasource Plugin provides following functions in Variables values query field in Templating Editor.
| Name | Description |
|---|---|
metrics(resource_id) |
Returns a list of metrics avialable for the resource identified by ‘resource_id’ |
resources(resource_type, attribute, query) |
Returns a list of resource attribute matching query. |
For details of query format, please refer to the Gnocchi documentations.
Grafana doesn’t allow to query two different servers when using the proxy mode, so we are not able to query Keystone for a token and then query gnocchi.
In proxymode, we need to set a token and the Gnocchi URL on the datasource.
In direct mode, we can use login/password and the Keystone URL. Note that CORS MUST be enabled on Keystone and Gnocchi servers.
APACHE LICENSE Version 2.0, January 2004


