
As a data scientist,I have been tasked by Microsoft to conduct an exploratory data analysis (EDA) to generate insights on the movie industry. The project involves analyzing datasets to provide insights and recommendations.
Microsoft sees all the big companies creating original video content and they want to get in on the fun. They have decided to create a new movie studio, but they don’t know anything about creating movies. In this project I will be exploring what types of films are currently doing the best at the box office. Additionally i'll translate the findings into actionable insights that the head of Microsoft's new movie studio can use to help decide what type of films to create.
In the folder Data are movie datasets from:
Because it was collected from various locations, the different files have different formats. Some are compressed CSV (comma-separated values) or TSV (tab-separated values) files that can be opened using spreadsheet software or pd.read_csv, while the data from IMDB is located in a SQLite database.
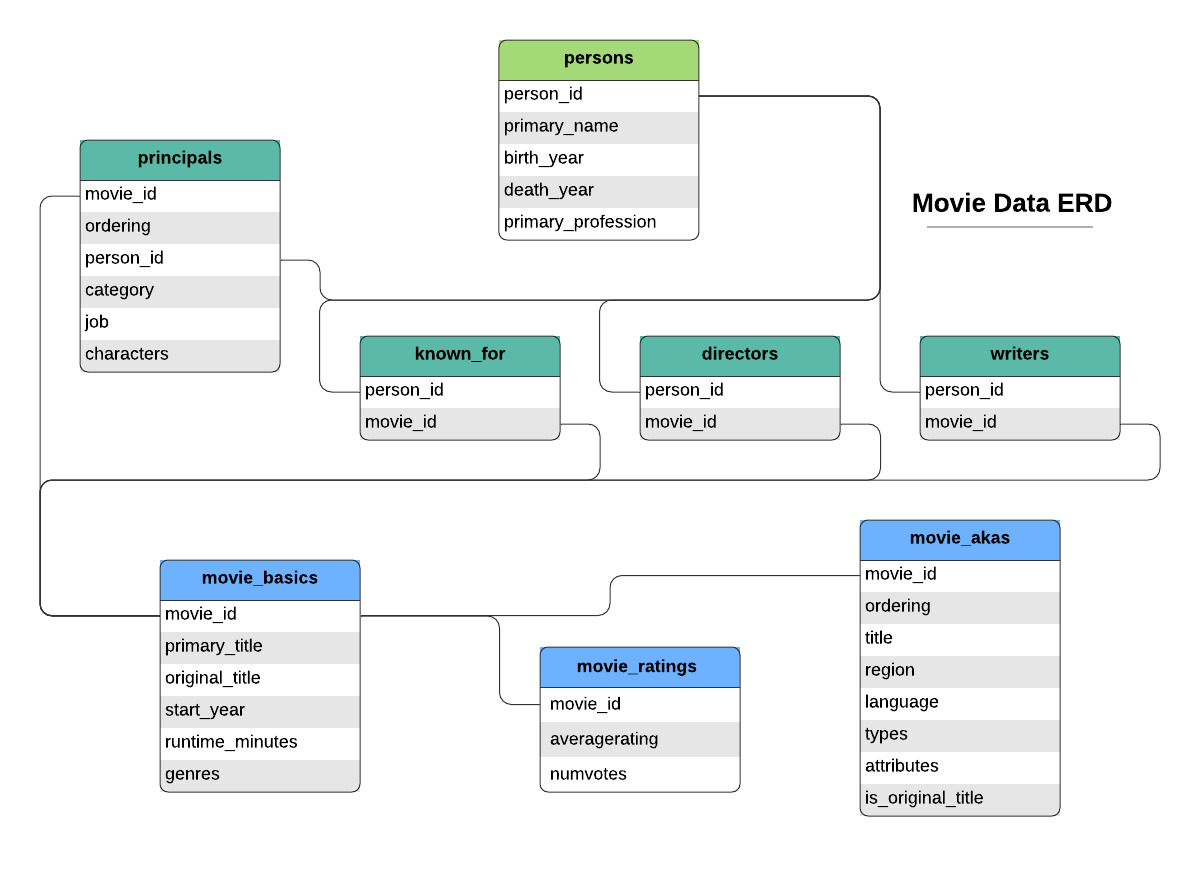
The above diagram shows ONLY the IMDB data.
I decide to use the folowing data files:
Data/im.db- SQLite database
- I selected
movie_basicsandmovie_ratingstables
Data/tn.movie_budget.csv- CSV file (loaded using
pd.read_csv)
- CSV file (loaded using
Below are links to this project's Jupyter Notebook and the presentation
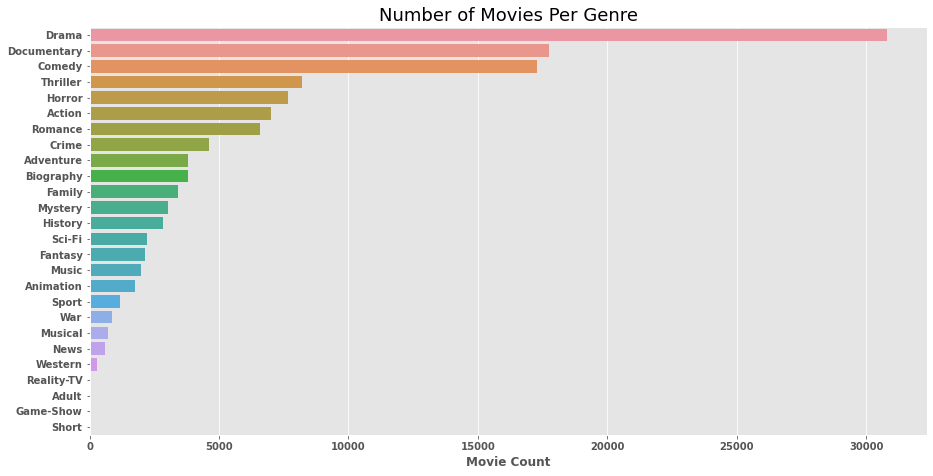
Here, I considered 2 factors to generate insightful analysis on the genres.
-
Number of movies produced per genre
-
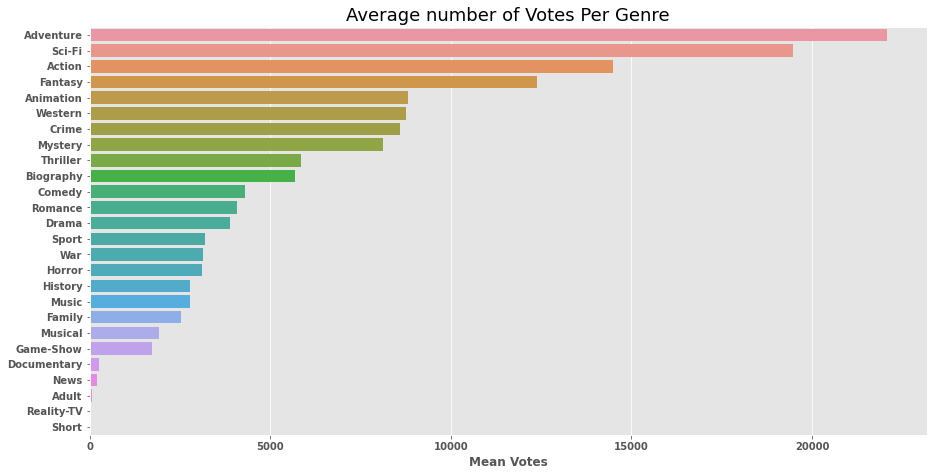
Average number of votes per Genre
Average rate per Genre for genres with more than 4000 movies and 3000 average votes
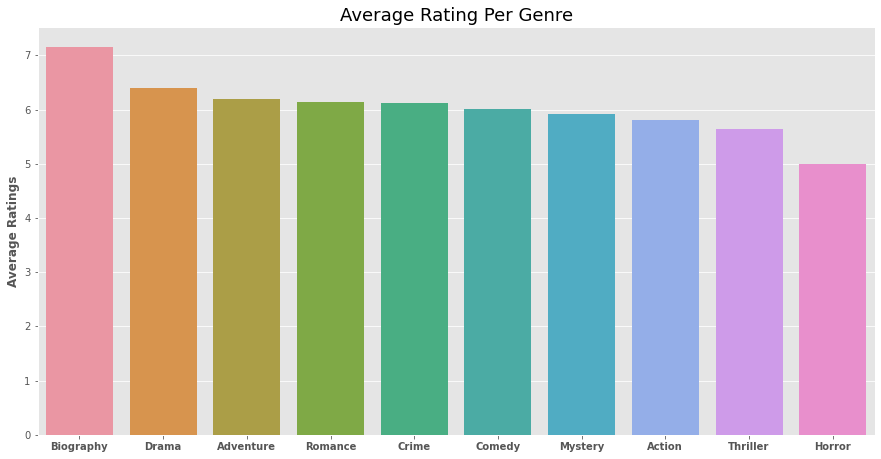
Top-rated movie genres (above a rating of 6) with movies above 3000 and number of votes about 3000 are Biography, Drama, Adventure, Romance, Crime and Comedy. This could suggest that these genres are popular among movie audience and have a higher likelihood of being positively received by market.
Examine if the movies with the highest budget generate the highest revenue.
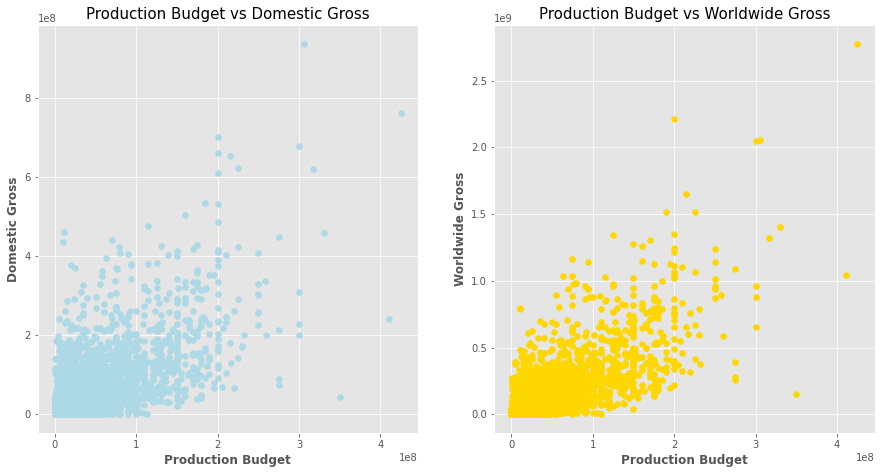
The above correlation coefficients and the scatter plot indicate a moderately strong positive correlation between the production budget and both measures of gross. This analysis argues that movies with a higher production budget tend to earn more gross income.
Time series graph of the yearly budget.
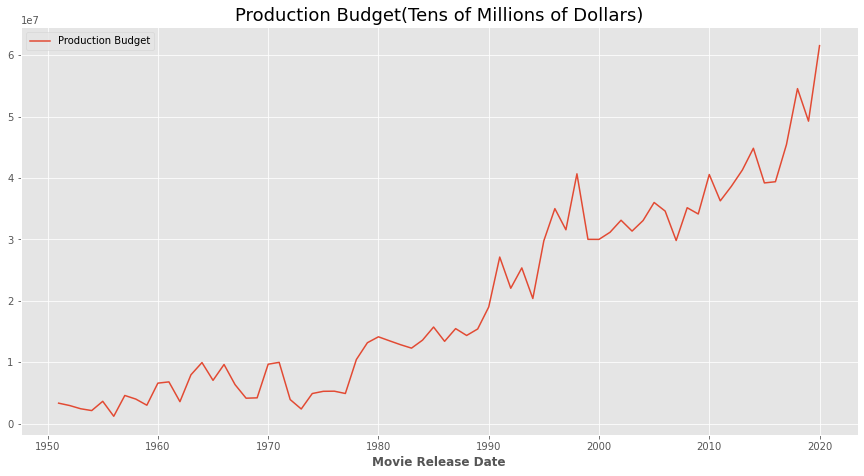
There is an increasing trend of production budgets in the film industry.
Time series graph of the monthly gross
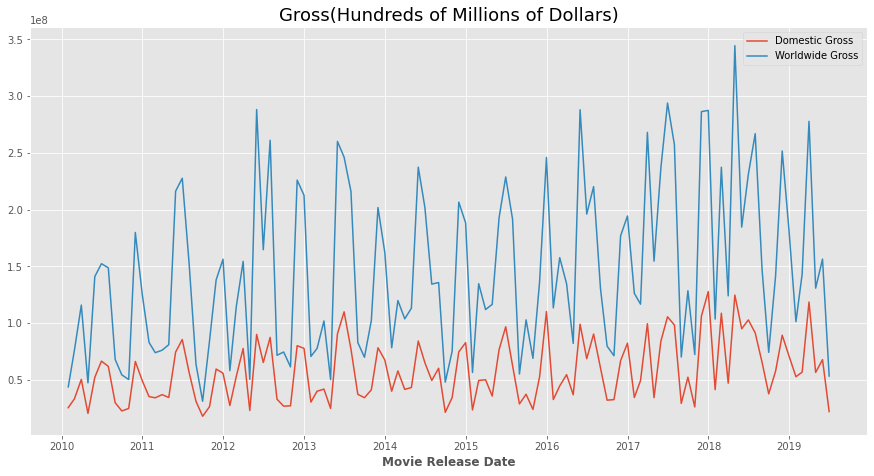
It appears that the gross income for movies tends to be higher during the mid months of the year, which could correspond to the summer period of the northern hemisphere.
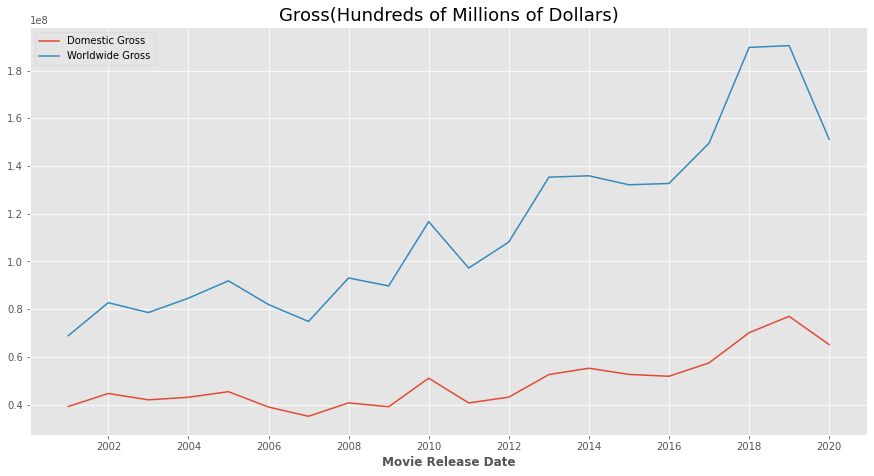
It is evident that movies performed well in a global market. This could indicate that the most movies had a broad appeal that could be successful in multiple regions.
In conclusion, we have have done the following:
- identified most popular genres
- investigated the role of production budget in the success of movies
- analyzed production budget trend
- explored how release dates can affect revenue and
- examined domestic versus global revenue
Based on the analysis this is what I would recommend:
- Explore the possibility of creating films within the genres of Biography, Drama, Adventure, Romance, Crime, and Comedy.
- Invest a substantial amount of funds in the production budget.
- Increase the production budget allocation for high-quality movie production compared to previous years.
- Consider releasing the movies during the mid months of the year, particularly in the summer months.
- Produce globally appealing movies and market them to international audiences.
