Coder Social home page Coder Social logo

victorgarciaesgi / vue-chart-3 Goto Github PK

View Code? Open in Web Editor NEW
306.0 6.0 91.0 1.85 MB

📊 A simple wrapper around Chart.js 3 for Vue 2 & 3

Home Page: https://vue-chart-3.netlify.app/

License: MIT License

TypeScript 74.72% JavaScript 1.17% HTML 2.51% Vue 21.59%
vue-chartjs chartjs3 vue3 vue3-chartjs vue chartjs vue-chartjs-3 vue-charts vue-chart-3 vue2

vue-chart-3's Introduction

I'm joining vue-chartjs as a core maintainer so this package will be kept just for those who already use it. I'm encouraging new users to use vue-chartjs instead

📊 Chart.js 3 for Vue 2 and Vue 3

sgts logo

npm version npm downloads npm downloads

This package is a rewrite of vue-chartjs for Chart.js 3, but written in Typescript with Vue 3 composition api in mind.

  • Vite.js and Nuxt 3 compatible 💯.

Full documentation

Installation

For Vue 3

npm i vue-chart-3 chart.js
#or
yarn add vue-chart-3 chart.js
#or
pnpm i vue-chart-3 chart.js

For Vue 2

npm i vue-chart-3@legacy chart.js
#or
yarn add vue-chart-3@legacy chart.js
#or
pnpm i vue-chart-3@legacy chart.js

Important notes

Using with Vue 3 or Vue 2

This package works with version 2.x and 3.x of Vue.

  • Vue 3 works out-of-the-box
  • Vue 2 requires @vue/composition-api package to also be installed and registered, to provide Vue 3's Composition API features like ref, defineComponent, computed, reactive.

Demos

vue-chart-3's People

Contributors

danmindru avatar droet avatar jonathanmsifleet avatar ms314006 avatar patrikbird avatar sbourouis avatar victorgarciaesgi avatar victortotem avatar

Stargazers

 avatar  avatar  avatar  avatar  avatar  avatar  avatar  avatar  avatar  avatar  avatar  avatar  avatar  avatar  avatar  avatar  avatar  avatar  avatar  avatar  avatar  avatar  avatar  avatar  avatar  avatar  avatar  avatar  avatar  avatar  avatar  avatar  avatar  avatar  avatar  avatar  avatar  avatar  avatar  avatar  avatar  avatar  avatar  avatar  avatar  avatar  avatar  avatar  avatar  avatar  avatar  avatar  avatar  avatar  avatar  avatar  avatar  avatar  avatar  avatar  avatar  avatar  avatar  avatar  avatar  avatar  avatar  avatar  avatar  avatar  avatar  avatar  avatar  avatar  avatar  avatar  avatar  avatar  avatar  avatar  avatar  avatar  avatar  avatar  avatar  avatar  avatar  avatar  avatar  avatar  avatar  avatar  avatar  avatar  avatar  avatar  avatar  avatar  avatar  avatar

Watchers

 avatar  avatar  avatar  avatar  avatar  avatar

vue-chart-3's Issues

v0.5.8 release

Hi,

there is a new version published on NPM, but I can't find any reference in the changelog/releases.

Any idea where this publish came from and which changes it includes?

data undefined

I’m getting the data back from graphql and it’s rendering to the template no problem, but when trying to pass the data to the chart (PolarChart) I get undefined. I don't believe this is a bug -- i'm sure I'm just overlooking something -- but I also thought it could be useful to post here incase someone in the future runs into a similar issue.

Even though i'm using Vue3 are registerables and ChartData still required like in the demo: https://codesandbox.io/s/demo-vue-chart-3-forked-e3yz2?file=/src/App.vuehttps://codesandbox.io/s/demo-vue-chart-3-forked-e3yz2?file=/src/App.vue -- i'm wondering, because in the documentation it says nothing like that is required for Vue 3.

You should be able to run the repo: https://github.com/edwardz8/vue3-hockey-graphql to see how the data is being logged in the console.

console-props

Error when installing v0.5.9

I'm currently at v0.5.8,
When I run npm update, I got this error.

npm ERR! code 1
npm ERR! path path-to-my-project\node_modules\vue-chart-3
npm ERR! command failed
npm ERR! command C:\WINDOWS\system32\cmd.exe /d /s /c echo \$contentClass = \'.content__default\' > node_modules/@vuepress/theme-default/styles/config.styl
npm ERR! The system cannot find the path specified.

NPM docs: composition-api reference

In the NPM docs (https://www.npmjs.com/package/vue-chart-3) there's the following line:

Vue 2 requires @vue/composition-api package to also be installed, to provide Vue 3's Composition API features like ref, defineComponent, computed, reactive. Vue composition-api plugin will install itself so no need to register it!

From the other documentation, I understood that the composition-api needs manual install, so the last sentence is incorrect? I guess the NPM docs need a minor update to reflect the change.

How to use options

Could you please provide an example where you explain to set the chart options? Like enabling tooltips and set scales?

Thank you in advance!

ref.chartInstance always null

Hello, thanks for this package. I started using it on my team lately, and it's great!

However, I'm wondering if I'm doing something wrong or if there's an issue with the properties.
I use a ref on my component instance and am trying to access the chartInstance so that I can retrigger an update when one of my props changes (none of the data, just a background color for a dynamically drawn gradient).

Something like

<template>
  <Bar :data="data" ref="chartRef" />
</template>

<script>
setup () {
  const chartRef = ref(null)

  watch(barColorPreference, () => {
    const chartInstance = chartRef.value.chartInstance // this is always null
  })

  const data = computed(() => ({ })) // all my data

  return { chartRef, data }
}
</script>

The README.md specifies that I should be able to access the chartInstance this way. Am I missing something?

I forked the CodeSandbox from the README.md
https://codesandbox.io/s/demo-vue-chart-3-forked-y6jvv?file=/src/App.vue

Usage without TypeScript

I get this error when I use this package without TypeScript: Uncaught (in promise) Error: "doughnut" is not a registered controller..

vue-chart-3 version 0.5.8
chart.js version 3.5.1
vue version 3.2.20

Code taken from docs:

<template>
  <DoughnutChart :chartData="testData" />
</template>

<script> // Note without lang="ts"
import { defineComponent } from 'vue';
import { DoughnutChart } from 'vue-chart-3';

export default defineComponent({
  name: 'Home',
  components: { DoughnutChart },
  setup() {
    const testData = {
      labels: ['Paris', 'Nîmes', 'Toulon', 'Perpignan', 'Autre'],
      datasets: [
        {
          data: [30, 40, 60, 70, 5],
          backgroundColor: ['#77CEFF', '#0079AF', '#123E6B', '#97B0C4', '#A5C8ED'],
        },
      ],
    };

    return { testData };
  },
});
</script>

bug(v0.4.x): adding certain chart options crashes the process

Using a simple chart inside Vue 2, the newer version crashes my process once I add options.scales to my chart. Other properties such as options.onClick() and options.plugins seem to work fine

<template>
    <BarChart :data="data" :options="options"/>
</template>


<script>
   export default {
      components: {
         BarChart,
      },
      data() {
         return {
            options: {
               scales: {}, // boom
            },
         }
      },
   }
</script>

This was working fine back on v0.1.7

Vue 2 composition API issue

vue-chart-3 automatically registers the composition API on

Vue.use(VueComp);
Since it is loaded within vue chart I don't need to load it myself. But on pages where there isn't a chart I must load it manually. Because vue doesn't allow me to load it twice I must check on which page I am before loading the composition API and only load it on pages where there isn't a chart loaded. It would be better if the composition API was loaded manually instead of automatically. Then I can just load it once on initialisation without having to check on which page I am.

Unclear how to use data from props "this is undefined"

Hi,

I'm passing data through props as the component should just render it and not contain it. I'm unable to find a way to access these props as 'this' is not defined. It's probably me not understanding this flavor of javascript syntax.

For example:

const my_labels = computed(() => { console.log('generating labels') console.log(this.chart_data) let labels = []; this.chart_data.forEach((item) => { for (let i = 0; i < item.data.length; i++) { labels.push(item.data[i].date); } }); console.log(labels); return labels; })

[0.4.8] Cannot find module '@vue/runtime-core' or its corresponding type declarations.

Hi again; ) It's simimlar issue to #10

ERROR in .../node_modules/vue-chart-3/types/utils.d.ts(1,82):
1:82 Cannot find module '@vue/runtime-core' or its corresponding type declarations.
  > 1 | import type { ComponentOptions, ShallowUnwrapRef, ComponentPublicInstance } from '@vue/runtime-core';
      |                                                                                  ^
    2 | import * as CSS from 'csstype';
    3 | import { ComputedOptions, MethodOptions } from 'vue-demi';
    4 | export declare type StyleValue = string | CSS.Properties | Array<StyleValue>;
ERROR in .../node_modules/vue-chart-3/types/vueproxy.types.d.ts(2,81):
2:81 Cannot find module '@vue/runtime-dom' or its corresponding type declarations.
    1 | import { ComponentRenderProxy, ExtractDefaultPropTypes, ExtractPropTypes } from '@vue/composition-api';
  > 2 | import { ComputedOptions, CSSProperties, MethodOptions, ShallowUnwrapRef } from '@vue/runtime-dom';
      |                                                                                 ^
    3 | import { ComponentOptions, VueConstructor } from 'vue';
    4 | import { DefaultComputed, DefaultData, DefaultMethods } from 'vue/types/options';
    5 | export declare type VueProxy<PropsOptions, RawBindings, Data = DefaultData<Vue>, Computed extends ComputedOptions = DefaultComputed, Methods extends MethodOptions = DefaultMethods<Vue>> = ComponentOptions<Vue, ShallowUnwrapRef<RawBindings> & Data, Methods, Computed, PropsOptions, ExtractPropTypes<PropsOptions>> & VueConstructorProxy<PropsOptions, RawBindings, Data, Computed, Methods>;
ERROR in .../node_modules/vue-chart-3/types/vueproxy.types.d.ts(7,117):
7:117 Type 'Computed' does not satisfy the constraint 'ComputedOptions'.
     5 | export declare type VueProxy<PropsOptions, RawBindings, Data = DefaultData<Vue>, Computed extends ComputedOptions = DefaultComputed, Methods extends MethodOptions = DefaultMethods<Vue>> = ComponentOptions<Vue, ShallowUnwrapRef<RawBindings> & Data, Methods, Computed, PropsOptions, ExtractPropTypes<PropsOptions>> & VueConstructorProxy<PropsOptions, RawBindings, Data, Computed, Methods>;
     6 | declare type VueConstructorProxy<PropsOptions, RawBindings, Data, Computed extends ComputedOptions, Methods extends MethodOptions> = VueConstructor & {
  >  7 |     new (...args: any[]): ComponentRenderProxy<ExtractPropTypes<PropsOptions>, ShallowUnwrapRef<RawBindings>, Data, Computed, Methods, ExtractPropTypes<PropsOptions>, ExtractDefaultPropTypes<PropsOptions>, true>;
       |                                                                                                                     ^
     8 | };
     9 | export declare type VueInputEvent = Event & {
    10 |     target: HTMLInputElement;
Version: typescript 4.3.5

Can't get this to work, missing template

I am getting this error message:

Failed to mount component: template or render function not defined.

found in

---> <BarChart>

This is my simple component:

<template>
    <BarChart
        :chartData="datacollection"
    />
</template>

<script>
import { Chart, registerables } from 'chart.js';
import BarChart from 'vue-chart-3'

Chart.register(...registerables);

export default {
    components: { BarChart },
    data() {
        return {
            datacollection: {
                labels: ['1.', '2.', '3.'],
                datasets: [
                    {
                        label: 'consumption',
                        data: [
                            10, 20, 10, 44
                        ]
                    }
                ]
            },
        }
    },
}
</script>

I added chartjs, vue-chart-3 and @vue/composition-api to the project. I am not using the composition api for my own components. Is this the issue? can't I mix composition and traditional components?

Radar Chart Background Color

I could not manage to make legends visible

image

const options = ref({ responsive: true, plugins: { legend: { display: true, }, }, });

[Vue warn]: Do not use built-in or reserved HTML elements as component id: Line

Hello! Noticed one small issue while using this lib. Can you please change the chart component names to be not similar with native HTML elements?

Example
vue-chart-3/dist/index.js, line 9

exports.LineChart = components_1.defineChartComponent('line-chart', 'line'); to be replaced by
exports.LineChart = components_1.defineChartComponent('line-chart', 'line-chart');

It should fix the issue. Thanks in advance!

Build errors with vite

Installing (and importing) this package on a clean vue-vite project with typescript causes build errors

Cannot find module 'vue/types/options' or its corresponding type declarations
Cannot find name 'Vue'.
Cannot find module '@vue/composition-api' or its corresponding type declarations.

Relevant dependencies:

{
  "scripts": {
    "build": "vue-tsc --noEmit && vite build",
  },
  "dependencies": {
    "chart.js": "^3.6.0",
    "vue": "^3.2.16",
    "vue-chart-3": "^0.5.10"
  },
  "devDependencies": {
    "@vitejs/plugin-vue": "^1.9.3",
    "typescript": "^4.4.3",
    "vite": "^2.6.4",
    "vue-tsc": "^0.3.0"
  }
}

Minimal reproduction repo - https://github.com/JasonMan34/vite-vue-chart-3-bug

[0.5.x] Breaks unit-testing with Jest

I had no issues testing my chart components with Jest while using 0.4.12. My Jest config includes all necessary transforms (js, ts, and vue).
However, updating to 0.5.0 or any newer version breaks Jest compatibility and results in Jest encountered an unexpected token with the following error:

 ({"Object.<anonymous>":function(module,exports,require,__dirname,__filename,jest){import { defineChartComponent } from './components';
                                                                                   ^^^^^^

SyntaxError: Cannot use import statement outside a module

in \node_modules\vue-chart-3\dist\index.js:1.

I guess since 0.5.x the distributed code isn't properly transformed and cannot be directly consumed by Jest, since it doesn't transform files in node_modules.

How to use plugins using the `defineChartComponent`

How to use plugins using the defineChartComponent

After following the guide here: https://vue-chart-3.netlify.app/guide/configuration/plugins.html

<script lang="ts">
import { defineChartComponent } from 'vue-chart-3';
import { MatrixController, MatrixElement } from 'chartjs-chart-matrix';

Chart.register(MatrixController, MatrixElement);

const Matrix = defineChartComponent('MatrixChart', 'matrix');
</script>

<MatrixChart /> is still not working in Vue template.
Please @victorgarciaesgi can you help out. Thanks

v-bind not working well in v-for loop

I ran into this problem with v-bind. I have line charts in a loop using the composition API but the charts kept disappearing when the data changes. I ended up having to force the line charts remount using a v-if hack. After the component is mounted I set the v-if to true to force the component to remount. Anyone seen this issue?
<LineChart v-if="row.isVisible" v-bind="row.bpTrendProps" class="tilesLineChart" :options="row.bpChartOptions" />

Chartjs-chart-matrix issue

Hi. Tried to use library Chartjs-chart-matrix, but didn't managed to make it work along with vue chart 3.

<Matrix :chartData="salesData" />
import {MatrixController, MatrixElement} from chartjs-chart-matrix;

Chart.register(MatrixController, MatrixElement, DoughnutController, ArcElement, Tooltip);

const Matrix = defineChartComponent("MatrixChart", "matrix");
  setup() {
    const salesData = {
      type: 'matrix',
      datasets: [
        {
          label: 'Basic matrix',
          data: [{x: 1, y: 1}, {x: 2, y: 1}, {x: 1, y: 2}, {x: 2, y: 2}],
          borderWidth: 1,
          borderColor: 'rgba(0,0,0,0.5)',
          backgroundColor: 'rgba(200,200,0,0.3)',
          width: ({chart}) => (chart.chartArea || {}).width / 2 - 1,
          height: ({chart}) => (chart.chartArea || {}).height / 2 - 1,
        },
      ],
      options: {
        scales: {
          x: {
            display: false,
            min: 0.5,
            max: 2.5,
            offset: false
          },
          y: {
            display: false,
            min: 0.5,
            max: 2.5
          }
        }
      }
    };
    return {salesData};

  }

How to extend existing charts?

Is there any example available for extending existing chart types in vue-chart-3? I have created a custom chart before using vue-chartjs, but that was with pure JS and vue 2. This time I want to create a component using TypeScript and Composition API.

I need to override draw() function as I need to do some custom drawing. Any tips or a bare-bone example of extending the built-in bubble chart type would give me enough to start.

How to trigger reactivity / re-render chart by hand?

How is it possible to re-render the chart by hand when data changes?

I made this little sandbox where I wand to change the axis by user input.
https://codesandbox.io/s/suspicious-monad-h5ecd?file=/src/components/Chart.vue

Changing the xMax / xMin changes indeed the passed options to your chart (I render the options above the chart) but the chart itself does not change.
Is it maybe because you commented out your watcher? https://github.com/victorgarciaesgi/vue-chart-3/blob/main/src/components.ts#L65-L73

Could you please explain how I can achieve that?
Btw: thank you very much for your time and effort. I like your library :)

Errors when trying to add mixed

Hello,
I am trying to make bunch of dynamic charts and am getting errors when making a mixed chart with a bar and line chart.
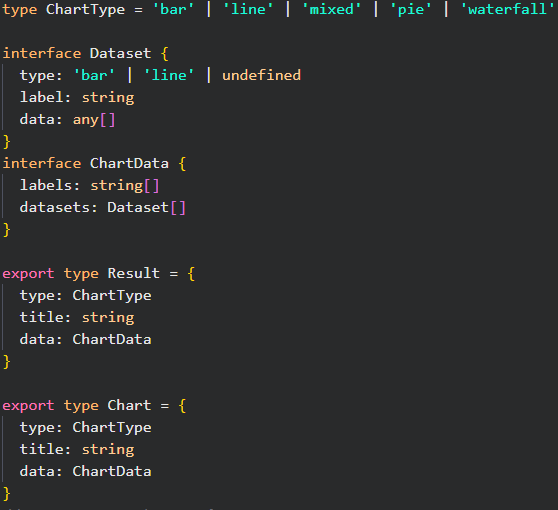
The error I get comes from using type: Object as PropType<ChartData<"bar"> | ChartData<"line">> when defining my PropType. I think this is due to the definition of the ChartData type and not having a ChartTypeRegistry for mixed charts.

Do you think you could add that to the registry of this library?
If there is already a work around that I am not seeing please let me know!

Here's a quick snapshot of what my chart-types.ts file looks like at the moment:
image

Adding a type to your dataset allows you to mix charts in ChartJS, so if that variable is added to the ChartData type I think it would be a quick and easy fix... I think XD

I am really loving working with this wrapper and hope to hear back soon. Cheers again for quick response time so far!

Type 'boolean' does not satisfy the constraint 'EmitsOptions'

I'm getting the following error when building my Vue app.

ERROR in /home/me/dev/my-project/frontend/node_modules/vue-chart-3/types/vueproxy.types.d.ts(13,207):
13:207 Type 'boolean' does not satisfy the constraint 'EmitsOptions'.
    11 | export declare type VueProxy<PropsOptions, RawBindings, Data = DefaultData<Vue>, Computed extends ComputedOptions = DefaultComputed, Methods extends MethodOptions = DefaultMethods<Vue>> = ComponentOptions<Vue, ShallowUnwrapRef<RawBindings> & Data, Methods, Computed, PropsOptions, ExtractPropTypes<PropsOptions>> & VueConstructorProxy<PropsOptions, RawBindings, Data, Computed, Methods>;
    12 | declare type VueConstructorProxy<PropsOptions, RawBindings, Data, Computed extends ComputedOptions, Methods extends MethodOptions> = VueConstructor & {
  > 13 |     new (...args: any[]): ComponentRenderProxy<ExtractPropTypes<PropsOptions>, ShallowUnwrapRef<RawBindings>, Data, Computed, Methods, ExtractPropTypes<PropsOptions>, ExtractDefaultPropTypes<PropsOptions>, true>;
       |                                                                                                                                                                                                               ^
    14 | };
    15 | export declare type VueInputEvent = Event & {
    16 |     target: HTMLInputElement;

Versions used:

"vue": "^2.6.14"
"vue-chart-3": "^0.5.11"
"chart.js": "^3.6.0"
"@vue/composition-api": "^1.4.0"

Any ideas how to solve this?

Usage with optional chart types

Hi, first of all thanks for this handy wrapper. Very neat that it also works with Vue 2.

Would it be possible to add support for wrapping optional chart types outside of chartjs core, for example the matrix type for heatmaps?

Yarn error (non-blocking)

Running yarn check provides the following result:

error "vue-chart-3#csstype" is wrong version: expected "3.0.9", got "2.6.18"

Vue2 options api

Is it possible to use vue2 as below (no setup, ref or anything composition api related used, but good old options api)? Because I get InternalError: too much recursion

<template>
	<PieChart :chart-data="data" :options="options" />
</template>
<script>
import { defineComponent } from "@vue/composition-api";

import { PieChart } from "vue-chart-3";

export default defineComponent({
	components: { PieChart },
})

Plugins not working

Hi all,

first of all I have to confess that I am rather new to javascript/Vue3, so this issue might be caused by some not very well understood fundamentals.

I have successfully created a LineChart Vue component using vue-chart-3 and Vue3. Data is plotted correctly and the chart can be adjusted by using an "options" dict:

<template>
     <LineChart :chartData="chartData" :options="options" />
</template>

As a next step I have tried to add a plugin (chartjs-plugin-zoom). To this end, I have added this section:

<script>
 ....
  import { Chart, registerables } from "chart.js";
  import { LineChart } from "vue-chart-3";
  import zoomPlugin from "chartjs-plugin-zoom";

  Chart.register(...registerables, zoomPlugin);
 ...
</script>

and from the options dict I have modified the key "plugins":

options: {
        responsive: true,
        plugins: {
          legend: {
            position: "bottom",
          },
          title: {
            display: true,
            text: "Test Chart",
          },
          zoom: {
            wheel: {
              enabled: true,
            },
            pinch: {
              enabled: true,
            },
            mode: "xy",
          },
        },
      },

However, there is no zoom functionality ...

Any idea what the issue might be?

Thanks a lot & Cheers

All charts lose height and width if dragged and option responsive = true

Firstly, thank you for the quick response last time!
I have been working with a drag and drop library, VueDraggableNext on my project and wanted to use your VueChart3 wrapper for my project. However if you have the option responsive selected and try to drag the chart the height and width are set to 0.
I made a CodeSandbox and gave the chart a toggle to make responsive or not to show the error. Any idea why the size is being set to 0? Is there a way to set a minimum size in the options?

Anyway, cheers for the cheers for the great wrapper, this working with composition API and Typescript is a huge help; I just hope I can figure out this responsiveness error. Cheers!

https://codesandbox.io/s/draggable-charts-8uck7?file=/src/components/Chart2.vue

Dimensions need to use parseInt

Invalid prop: type check failed for prop "width". Expected Number with value 100, got String with value "100". 
  at <LineChart width="100" height="100" chartData= ...

Sometimes the props are set directly in which case the chart needs to handle string as number on its own.

[0.3.2] Cannot find module '@vue/runtime-dom' or its corresponding type declarations.

Thanks for the package, works great so far except the following typescript error. I'm using Vue 2 with VCA plugin, so there's no @vue/runtime-dom package installed obviously. The error itself is gone after I've installed it but there are other JSX related errors, so probably not the way to go

ERROR in .../node_modules/vue-chart-3/types/components.d.ts(3,36):
3:36 Cannot find module '@vue/runtime-dom' or its corresponding type declarations.
    1 | import { Chart, ChartData, Plugin } from 'chart.js';
    2 | import { PropType } from 'vue-demi';
  > 3 | import type { CSSProperties } from '@vue/runtime-dom';
      |                                    ^

EDIT: "skipLibCheck": true seems to do the job as well, the question remains though - is this the correct solution?

Getting VueCompositionApi error

Version: 0.4.10 or 0.5.0-alpha.2

image

[Vue warn]: Error in data(): "Error: [vue-composition-api] must call Vue.use(VueCompositionAPI) before using any function."

found in

---> <BarChart>
       <VCard>

In my main.ts I definitely have a Vue.use(VueCompositionAPI); call and everything else is working.
But the charts are not rendered

Example code for a chart:

v-card(:min-height="200", height="100%")
  v-card-title URL Types
    v-card-text
      bar-chart(:chart-data="typesData", :options="typesOptions", :height="50")


typesData = { datasets: [...], labels: [...] }

typesOptions = {
  plugins: {
    legend: { display: false }
  },
  scales: {
    x: {
      beginAtZero: true
    }
  },
  indexAxis: 'y'
}

I'm trying to migrate from vue-chartjs to your plugin cause you support chartjs v3 (apertureless/vue-chartjs#695 (comment))

I also have created a src/plugins/chart.ts that is imported via import './plugins/chart.ts' in my main.ts

import { ArcElement, BarController, Chart, PieController, Tooltip } from 'chart.js';

Chart.register(BarController, PieController, ArcElement, Tooltip);

Build errors in unrelated tsx files

I'm unable to upgrade from [email protected] to latest v0.5.11 as I am getting build errors in my Vue TSX files that are not using charts:

TS2322: Type '{ src: string; width: string; height: string; border: string; }' is not assignable to type 'ElementAttrs<IframeHTMLAttributes>'.
 Property 'border' does not exist on type 'ElementAttrs<IframeHTMLAttributes>'.
   42 |                                 width="100%"
   43 |                                 height="800px"
 > 44 |                                 border="none"
      |                                 ^^^^^^
   45 |                             >
   46 |                             </iframe>
   47 |                         )}

I notice you have taken a dependency on @vue/runtime-core and @vue/runtime-dom v3.2.20 (https://github.com/victorgarciaesgi/vue-chart-3/blob/main/package.json#L54) - I wonder if this could be a factor?

Canvas tag has incorrect attributes

Hi!
Canvas has default height and width with incorrect attribute "attrs" in DOM
<canvas attrs="[object Object]" width="188" height="150"></canvas>

This fix helped me #12

LineChart. Chart options are not applying.

Hello. I can't figure out what I'm doing wrong.
I was using vue-chartjs and everything was great, now I'm migrating to your vue-chart-3.
I have component of specific linear-chart (I have 3 different linear charts in my project) and component of general linear-chart, I'm passing chartData and options and merging them together.

SpecificLinearChart.vue

<template>
    <GeneralLinearChart
      :chart-data="chartData"
    />
 </template>
<script>
...
computed: {
    chartData() {
      const { chartPoints, labels } = this.getTrainings.reduce(
        (allDays, dayOfPeriod) => {
          const { month, value } = dayOfPeriod;

          allDays.chartPoints.push(value);
          allDays.labels.push(`${month}:${value}`);

          return allDays;
        },
        {
          chartPoints: [],
          labels: []
        }
      );

      return {
        datasets: [
          {
            borderColor: '#E2E2E2',
            borderCapStyle: 'round',
            borderWidth: 1,
            data: chartPoints,
            label: '',
            pointHoverRadius: '0',
            pointRadius: '0'
          }
        ],
        labels
      };
    },
}
...
</script>

GeneralLinearChart.vue

<template>
    <LineChart
      style="height: 310px;"
      v-bind="lineChartProps"
    />
</template>

<script>
import { LineChart, useLineChart } from 'vue-chart-3';
import {
  ref,
  toRefs,
  computed,
  defineComponent
} from '@vue/composition-api';

export default defineComponent({
  components: { LineChart },
  props: {
    chartData: {
      type: Object,
      default: () => ({})
    },
    customChartOptions: {
      type: Object,
      default: () => ({})
    }
  },
  setup(props) {
    const { customChartOptions, chartData } = toRefs(props);
    const defaultChartOptions = ref({
       maintainAspectRatio: false,
      scales: {
        y: {
          axis: 'y',
          grid: {
            display: false
          },
          ticks: {
            callback(tick) {
              if (tick === 0) {
                return '';
              }

              return tick;
            },
            font: {
              family: 'Montserrat',
              size: 12,
              weight: 'bold'
            },
            color: '#1C1C1C',
            min: 0,
            max: 100,
            stepSize: 20
          }
        },
        x: {
          axis: 'x',
          grid: {
            display: false
          },
          ticks: {
            color: '#1C1C1C',
            font: {
              family: 'Montserrat',
              size: 12,
              weight: 'bold'
            },
            callback(label) {
              const monthNames = [
                'Янв',
                'Фев',
                'Мар',
                'Апр',
                'Май',
                'Июн',
                'Июл',
                'Авг',
                'Сен',
                'Окт',
                'Ноя',
                'Дек'
              ];
              const [date, value] = label.toString().split(':');
              const matchedMonth = date.match(/\d{1,2}(?=.\d{4})/);

              if (matchedMonth === null) {
                return '';
              }

              const monthNumber = parseInt(matchedMonth[0], 10) - 1;

              return `${monthNames[monthNumber]}: ${Math.floor(value) || 0}`;
            }
          }
        }
      }
    });
    const options = computed(() => {
      return {
        ...defaultChartOptions.value,
        ...customChartOptions.value
      };
    });

    const { lineChartProps, lineChartRef } = useLineChart({
      chartData,
      options
    });

    return {
      lineChartProps,
      lineChartRef
    };
  }
});

</script>

I can see through console.log that my datasets, which I'm passing to the 'useLineChart' are ok.
But there are no values in chart, it looks empty. In ticks callback I'm recieving only empty labels. It looks like my options are not applying.

chartData:
Screenshot from 2021-11-11 10-04-02

tick's callbacks:
Screenshot from 2021-11-11 10-06-58

chart:
Screenshot from 2021-11-11 10-14-31

Cannot find module cloneDeep while using nuxt3 and vue-chart-3

Describe the bug

i am not 100% sure if it's vue-chart-3 issue or nuxt,
but its clearly related to vue-chart-3 and its dependencies, because it only occurs while component (LineChart) is loaded.
This only affects the prod build not development

To Reproduce

git clone https://github.com/andreas83/nuxt3-vue-chart-3

yarn install
yarn build
node .output/server/index.mjs
Visit page via Browser

ERROR

.output/server/chunks/app/server.mjs
Cannot find module .output/server/node_modules/lodash/cloneDeep' imported from .output/server/chunks/app/server.mjs

Version of vue-chart-3

3.0.4

Version of Vue

  • Nuxt 3

Recursive calls crashing application

Hi @victorgarciaesgi , I followed a couple of your examples and wanted to do something like this.

https://codesandbox.io/s/intelligent-meninsky-eeqnd?file=/src/components/HelloWorld.vue

It gives me this error

Maximum recursive updates exceeded. This means you have a reactive effect that is mutating its own dependencies and thus recursively triggering itself. Possible sources include component template, render function, updated hook or watcher source function. 

I suspect It has something to do with the options being reactive when passed to the component. If the options are removed, everything works fine

In the codesandbox link, even though the console logs a warning and it works fine. I get an error of the same type and it breaks

image

Error building Vue3 app with Vite

I just imported this package, don't even use it end get such error

node_modules/@vue/runtime-core/dist/runtime-core.d.ts:1960:9 - error TS2451: Cannot redeclare block-scoped variable 'defineProps'.

1960   const defineProps: _defineProps
             ~~~~~~~~~~~

  node_modules/@vue/runtime-dom/node_modules/@vue/runtime-core/dist/runtime-core.d.ts:1959:9
    1959   const defineProps: _defineProps
                 ~~~~~~~~~~~
    'defineProps' was also declared here.

node_modules/@vue/runtime-core/dist/runtime-core.d.ts:1961:9 - error TS2451: Cannot redeclare block-scoped variable 'defineEmits'.

1961   const defineEmits: _defineEmits
             ~~~~~~~~~~~

  node_modules/@vue/runtime-dom/node_modules/@vue/runtime-core/dist/runtime-core.d.ts:1960:9
    1960   const defineEmits: _defineEmits
                 ~~~~~~~~~~~
    'defineEmits' was also declared here.

node_modules/@vue/runtime-core/dist/runtime-core.d.ts:1962:9 - error TS2451: Cannot redeclare block-scoped variable 'defineExpose'.

1962   const defineExpose: _defineExpose
             ~~~~~~~~~~~~

  node_modules/@vue/runtime-dom/node_modules/@vue/runtime-core/dist/runtime-core.d.ts:1961:9
    1961   const defineExpose: _defineExpose
                 ~~~~~~~~~~~~
    'defineExpose' was also declared here.

node_modules/@vue/runtime-core/dist/runtime-core.d.ts:1963:9 - error TS2451: Cannot redeclare block-scoped variable 'withDefaults'.

1963   const withDefaults: _withDefaults
             ~~~~~~~~~~~~

  node_modules/@vue/runtime-dom/node_modules/@vue/runtime-core/dist/runtime-core.d.ts:1962:9
    1962   const withDefaults: _withDefaults
                 ~~~~~~~~~~~~
    'withDefaults' was also declared here.

node_modules/@vue/runtime-dom/node_modules/@vue/runtime-core/dist/runtime-core.d.ts:1959:9 - error TS2451: Cannot redeclare block-scoped variable 'defineProps'.

1959   const defineProps: _defineProps
             ~~~~~~~~~~~

  node_modules/@vue/runtime-core/dist/runtime-core.d.ts:1960:9
    1960   const defineProps: _defineProps
                 ~~~~~~~~~~~
    'defineProps' was also declared here.

node_modules/@vue/runtime-dom/node_modules/@vue/runtime-core/dist/runtime-core.d.ts:1960:9 - error TS2451: Cannot redeclare block-scoped variable 'defineEmits'.

1960   const defineEmits: _defineEmits
             ~~~~~~~~~~~

  node_modules/@vue/runtime-core/dist/runtime-core.d.ts:1961:9
    1961   const defineEmits: _defineEmits
                 ~~~~~~~~~~~
    'defineEmits' was also declared here.

node_modules/@vue/runtime-dom/node_modules/@vue/runtime-core/dist/runtime-core.d.ts:1961:9 - error TS2451: Cannot redeclare block-scoped variable 'defineExpose'.

1961   const defineExpose: _defineExpose
             ~~~~~~~~~~~~

  node_modules/@vue/runtime-core/dist/runtime-core.d.ts:1962:9
    1962   const defineExpose: _defineExpose
                 ~~~~~~~~~~~~
    'defineExpose' was also declared here.

node_modules/@vue/runtime-dom/node_modules/@vue/runtime-core/dist/runtime-core.d.ts:1962:9 - error TS2451: Cannot redeclare block-scoped variable 'withDefaults'.

1962   const withDefaults: _withDefaults
             ~~~~~~~~~~~~

  node_modules/@vue/runtime-core/dist/runtime-core.d.ts:1963:9
    1963   const withDefaults: _withDefaults
                 ~~~~~~~~~~~~
    'withDefaults' was also declared here.


Found 8 errors.
"dependencies": {
    "autoprefixer": "^10.3.5",
    "chart.js": "2.9.4",
    "lodash": "^4.17.21",
    "postcss": "^8.3.7",
    "sass": "^1.42.1",
    "tailwind-config-viewer": "^1.6.2",
    "tailwindcss": "^2.2.15",
    "vue": "^3.2.13",
    "vue-chart-3": "^0.5.8",
    "vue-router": "4"
  },
  "devDependencies": {
    "@vitejs/plugin-vue": "^1.9.0",
    "eslint": "^7.32.0",
    "eslint-config-prettier": "^8.3.0",
    "eslint-plugin-vue": "^7.18.0",
    "prettier": "^2.4.1",
    "typescript": "^4.4.3",
    "vite": "^2.5.10",
    "vue-tsc": "^0.3.0"
  }

Line Chart Name built-in or reserved HTML element

Hey. First of all, thanks for your great plugin. I'm using vue-chart-3 with nuxt.js which works great so far.

However, when I want to use the line chart I get the error message [Vue warn]: Do not use built-in or reserved HTML elements as component id: Line.

Implementation:

<template>
    <Line :data="testData" />
</template>

<script>
import { Line } from 'vue-chart-3'

export default {
    components: {
        Line,
    },
    ...
}
</script>

I think this could easily be fixed by renaming the Line Component.

Nuxt3 - extend docs

Since Nuxt v3 is out, can you extend docs for this version, if there is any known settings to be done?

Btw there is also a typo - it's examples (with a), not exemples

Access and type $refs for Chart Components using vue2 with Typescript

Hi,

I'm coming from a vue2 and want to use this library to render nice Charts. I tried the minimal example to render a DoughnutChart and it works fine. Now, I want to create a ref to see what's possible to manipulate the chart this way. I'm following this example. But when I try to access doughtnutRef.value it shows an error and returns undefined.

I understand that ref() is using the Composition API from vue3, but in vue2 I get the ref by this.$refs.doughnutRef. How can I

  • access the chartInstance using vue2
  • type the ref correctly (following this documentation) to get autocompletion and all the nice TS stuff, since ref() or ref<> does not seem to work in vue2

Here is my component (TotalPie.vue):

<template>
  <div>
    <DoughnutChart ref="doughnutRef" :chartData="testData"></DoughnutChart>
  </div>
</template>

<script lang="ts">
import Component from 'vue-class-component';
import Vue from 'vue';
import { DoughnutChart } from 'vue-chart-3';
import { Prop } from 'vue-property-decorator';

@Component({ components: { DoughnutChart } })
export default class TotalPie extends Vue {

  // type doughnutRef correctly here
  /* $refs!: {
    doughnutRef: ExtractComponentData<typeof DoughnutChart>;
  }; */

  mounted() {
    console.log(this.$refs.doughnutRef.value); //undefined
  }

  testData = {
    labels: ['Paris', 'Nîmes', 'Toulon', 'Perpignan', 'Autre'],
    datasets: [
      {
        data: [30, 40, 60, 70, 5],
        backgroundColor: ['#77CEFF', '#0079AF', '#123E6B', '#97B0C4', '#A5C8ED'],
      },
    ],
  };
}
</script>

Maybe I'm getting something obvious wrong but I'm very confused by the different docs (vue, vue-class-components, vue-chart-3) and my homemade mixup of all of these.

npm install fails

I can't install the package with npm with the error message

npm ERR! code ERESOLVE
npm ERR! Cannot destructure property 'name' of 'node' as it is null.

npm ERR! A complete log of this run can be found in:
npm ERR!     /home/user/.npm/_logs/2021-08-25T12_57_41_193Z-debug.log

Now I just clone the repository and install it with an entry like this

"dependencies": {
    "vue-chart-3": "file:../../../vue-chart-3"
}

Maximum call stack size exceeded when adding new data

Hi i'm using vue-chart-3 with vue 3 and typescript.
I want to dynamically add a datapoint to the array of datapoints but when I do this I get an "Maximum call stack size exceeded".
Since shuffling the data works fine reactively I thought adding data would also work.

Example: https://codesandbox.io/s/demo-vue-chart-3-forked-thrmf?file=/src/App.vue
(codesandbox sometimes says "Cannot use import statement outside a module" this is an error of codesandbox, usually a refresh within the "browser" of codesandbox fixes this)

Recommend Projects

  • React photo React

    A declarative, efficient, and flexible JavaScript library for building user interfaces.

  • Vue.js photo Vue.js

    🖖 Vue.js is a progressive, incrementally-adoptable JavaScript framework for building UI on the web.

  • Typescript photo Typescript

    TypeScript is a superset of JavaScript that compiles to clean JavaScript output.

  • TensorFlow photo TensorFlow

    An Open Source Machine Learning Framework for Everyone

  • Django photo Django

    The Web framework for perfectionists with deadlines.

  • D3 photo D3

    Bring data to life with SVG, Canvas and HTML. 📊📈🎉

Recommend Topics

  • javascript

    JavaScript (JS) is a lightweight interpreted programming language with first-class functions.

  • web

    Some thing interesting about web. New door for the world.

  • server

    A server is a program made to process requests and deliver data to clients.

  • Machine learning

    Machine learning is a way of modeling and interpreting data that allows a piece of software to respond intelligently.

  • Game

    Some thing interesting about game, make everyone happy.

Recommend Org

  • Facebook photo Facebook

    We are working to build community through open source technology. NB: members must have two-factor auth.

  • Microsoft photo Microsoft

    Open source projects and samples from Microsoft.

  • Google photo Google

    Google ❤️ Open Source for everyone.

  • D3 photo D3

    Data-Driven Documents codes.