Coder Social home page Coder Social logo

vasturiano / treemap-chart Goto Github PK

View Code? Open in Web Editor NEW
55.0 3.0 13.0 956 KB

A treemap interactive chart web component for visualizing hierarchical data

Home Page: https://vasturiano.github.io/treemap-chart/example/flare/

License: MIT License

HTML 25.19% JavaScript 70.10% CSS 4.71%
treemap chart data-visualization d3js hierarchical-data

treemap-chart's Introduction

treemap-chart

NPM package Build Size NPM Downloads

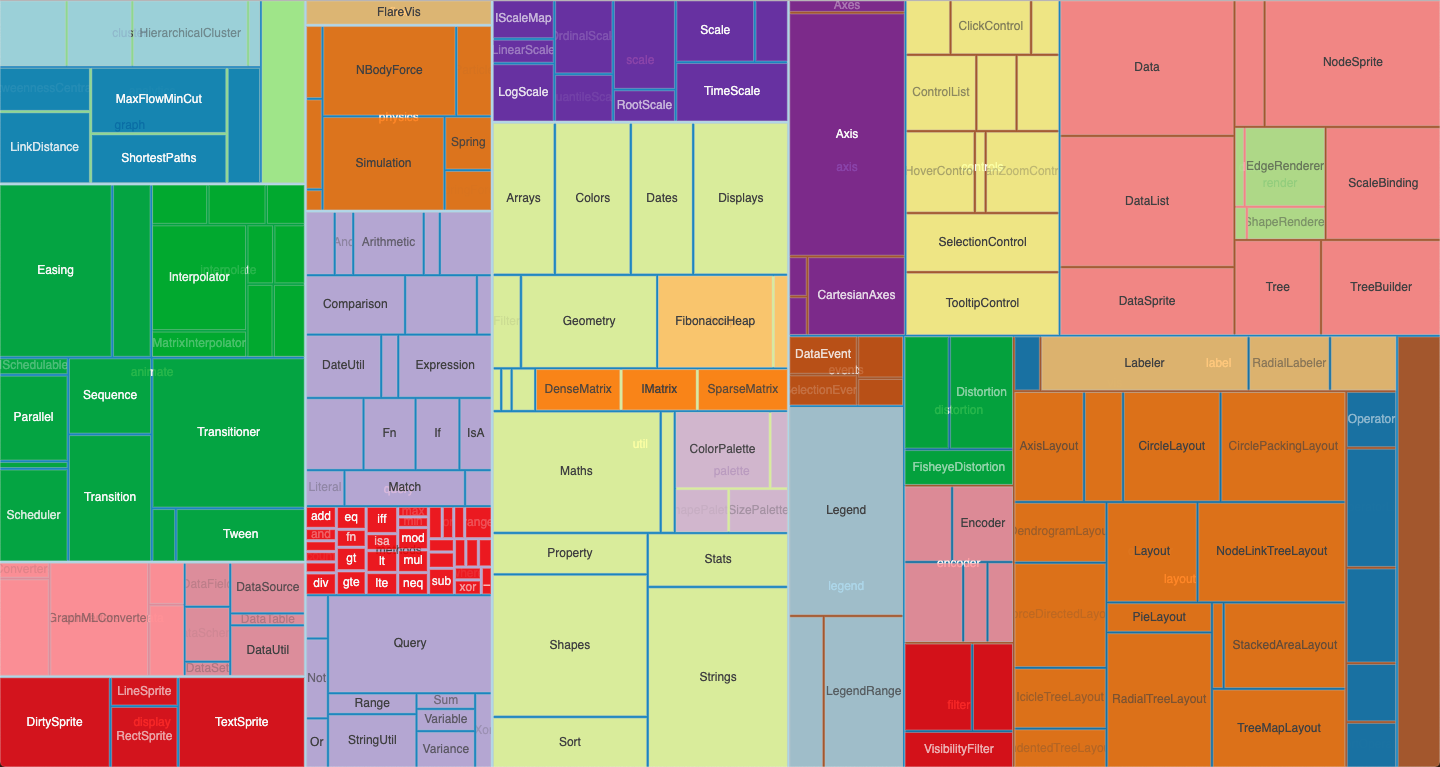
An interactive treemap chart for visualizing proportions in hierarchical data, where nodes of a tree are represented as nested fully-packed rectangular tiles.

Supports zooming interactions via mouse-wheel events or by clicking on a node, which focuses the viewport on the associated sub-tree. The chart also responds to data changes by animating the dimensions of each of the nodes into their new positions.

For improved performance, nodes with area (width*height) smaller than a given threshold (minBlockArea) are excluded from the DOM, allowing for representation of large data sets while maintaining a smooth interaction. See here for an example of a randomly generated large data structure.

See also the Circle Pack, Icicle and Sunburst charts.

Quick start

import Treemap from 'treemap-chart';

or using a script tag

<script src="//unpkg.com/treemap-chart"></script>

then

const myChart = Treemap();
myChart
  .data(<myData>)
  (<myDOMElement>);

API reference

Method Description Default
data([object]) Getter/setter for chart data (see below for syntax details).
width([number]) Getter/setter for the chart width in px. <window width>
height([number]) Getter/setter for the chart height in px. <window height>
children([string or fn]) Getter/setter for a data node's children accessor, used to establish the hierarchical relationship between nodes. Supports either a string indicating the object's property name, or a function(node) which should return an array of nodes. children
label([string or fn]) Getter/setter for a node object label accessor, used to display labels on the blocks and their tooltips. name
size([string or fn]) Getter/setter for a node object size accessor, used to compute the areas of the blocks. value
padding([number]) Getter/setter for the amount of padding between adjacent blocks, in px. 2.5
color([string or fn]) Getter/setter for a node object color accessor, used to color the blocks. grey
nodeClassName([string or fn]) Getter/setter for a node object classname accessor. Determines the CSS class(es) to apply to each block node.
minBlockArea([number]) Getter/setter for the minimum area of a block (in square px) required for it to be rendered in the DOM. 100
excludeRoot([boolean]) Getter/setter for whether to exclude the root node from the representation. false
sort([fn]) Getter/setter for the compare method used to sort sibling blocks. A value of null (default) maintains the existing order found in the input data structure. This method is equivalent to d3-hierarchy's sort, it receives two arguments representing two sibling nodes and expects a numeric return value (-1, 0 or 1) indicating the order. Each element is an instance of d3-hierarchy node and has several useful properties to specify order: data (the corresponding data object), value (summed value of node and all its descendants) and depth (layer degree). For example, to order blocks by size, use: (a, b) => b.value - a.value. <existing order>
showLabels([boolean]) Getter/setter for whether to show labels in the nodes. Regardless of this setting, labels too large to fit within a block's width are automatically hidden. true
showTooltip([fn]) Getter/setter to specify a node object tooltip's visibility. If this function returns false for a particular node, that node's tooltip will not display at all. If unspecified, all nodes' tooltips will display. () => true
tooltipTitle([fn]) Getter/setter for a node object tooltip title. The function should return a string to be displayed in bold in the first line of the tooltip. If unspecified, the full hierarchical name will be displayed.
tooltipContent([fn]) Getter/setter for a node object tooltip content. Use this to specify extra content in each of the block's tooltips in addition to the title set in tooltipTitle.
zoomToNode([node]) Programmatically zoom the chart to a particular node.
zoomBy([number]) Programmatically zoom the chart by a specific amount. 1 is unity, above one indicates a zoom-in and below a zoom-out.
zoomReset() Programmatically reset the zoom to the global view.
onHover([fn]) Callback function for mouse hover events. Includes the data node object (or null if hovering on background) as single argument.
onClick([fn]) Callback function for click events. Includes the data node object (or null if clicking on the background) as single argument. A falsy value (default) automatically zooms on clicked nodes, equivalent to myChart.onClick(myChart.zoomToNode).
transitionDuration([number]) Getter/setter for the animation duration of transitions between states (opening, zoom in/out) in milliseconds. Enter 0 to disable animations. 800

Data syntax

{
  name: "root",
  children: [
    {
      name: "leafA",
      value: 3
    },
    {
      name: "nodeB",
      children: [
        {
          name: "leafBA",
          value: 5
        },
        {
          name: "leafBB",
          value: 1
        }
      ]
    }
  ]
}

Giving Back

paypal If this project has helped you and you'd like to contribute back, you can always buy me a โ˜•!

treemap-chart's People

Contributors

donedeal0 avatar vasturiano avatar

Stargazers

 avatar  avatar  avatar  avatar  avatar  avatar  avatar  avatar  avatar  avatar  avatar  avatar  avatar  avatar  avatar  avatar  avatar  avatar  avatar  avatar  avatar  avatar  avatar  avatar  avatar  avatar  avatar  avatar  avatar  avatar  avatar  avatar  avatar  avatar  avatar  avatar  avatar  avatar  avatar  avatar  avatar  avatar  avatar  avatar  avatar  avatar  avatar  avatar  avatar  avatar  avatar  avatar  avatar  avatar  avatar

Watchers

 avatar  avatar  avatar

treemap-chart's Issues

Back button

Is your feature request related to a problem? Please describe.
Hi! Testing the demo quickly - a bit frustrated that there is no clear & easy way to zoom out to previous view.

Describe the solution you'd like
Implement back support to move to previous zoom.

Describe alternatives you've considered
Zoom out with mouse scroller, etc. works terrible - as treemap and web page competes for handling the scroll events and behavior is then as a result inconsistent and unreliable. Also, it is timeconsuming and not precise as I often quite specifically want to revert back to previous view, not actually do any free zooming out - there difference in intention and need.

Additional context
N/A

Maybe this is up to the consumer of the widget? Sorry if this has already been addressed.

Measuring execution time

Hi,

I am testing the time needed to visualize large sets of data using this code.
Is it correct measuring it as:

var t1 = performance.now();
    Treemap()
      .data(genNode())
      .color(d => color(d.name))
      .showLabels(false)
      .minBlockArea(8) 
      .excludeRoot(true)
      .tooltipContent((d, node) => `Size: <i>${node.value}</i>`)
      (document.getElementById('chart'));

 var t2 = performance.now();
 console.log(t2 - t1);

Does anything run asynchronously in this case, since I am not sure I receive rational times?

Thank you in advance.

Padding all 4 sides

Is your feature request related to a problem? Please describe.
I would like to have the option to add padding around the entire block because now the name of the parent block is behind the child block, so I would like to move the name top left (which is possible with CSS only) and then add padding to the child block, so the parent's name is visible.

Describe the solution you'd like
Right now the padding is added only to the bottom side, I would like to have the option to add padding to all 4 sides.
(I could also try to modify this and submit a PR if that works)

Thank you!

Customize node formatting based on data node

Is your feature request related to a problem? Please describe.

I'd like to have a way to apply formatting to individual rendered elements.

Describe the solution you'd like

I'd like to have a .className(node) function that lets me apply classes to the SVG that is being rendered for each node.

Describe alternatives you've considered

I'm doing this now like this:

  setTimeout(() => {
    const rectElements = document.querySelectorAll('#chart rect')
    // Do stuff with rectElements
  }, 0)

However, it's tricky, since I can't easily introspect the DOM elements to determine which ones correspond to which nodes in the tree.

As an alternative to emitting class names, there could be a visitor function that receives both the rendered DOM node and the data node it came from.

The setTimeout is also a bit icky.

Additional context

If this makes sense to you, I might be able to contribute it at some point in the future.

How to Run this project

I tried running the following commands:-

  1. npm install @rollup/plugin-babel --save-dev
  2. npm run build

Can you please tell us the step to run this project so that we can get a zip file that we can import into Thingworx.
It will great if you can add this in your README.md.

Callback when animation is finished

Is your feature request related to a problem? Please describe.

I'd like to display some navigation elements on top of the chart, but only when it finishes rendering.

Describe the solution you'd like

An .animationFinished() callback.

Describe alternatives you've considered

I'm using setTimeout(() => {}, 800) right now, though it would be better encapsulation if I weren't pasting this number from the component's source code.

Additional context
N/A

Recommend Projects

  • React photo React

    A declarative, efficient, and flexible JavaScript library for building user interfaces.

  • Vue.js photo Vue.js

    ๐Ÿ–– Vue.js is a progressive, incrementally-adoptable JavaScript framework for building UI on the web.

  • Typescript photo Typescript

    TypeScript is a superset of JavaScript that compiles to clean JavaScript output.

  • TensorFlow photo TensorFlow

    An Open Source Machine Learning Framework for Everyone

  • Django photo Django

    The Web framework for perfectionists with deadlines.

  • D3 photo D3

    Bring data to life with SVG, Canvas and HTML. ๐Ÿ“Š๐Ÿ“ˆ๐ŸŽ‰

Recommend Topics

  • javascript

    JavaScript (JS) is a lightweight interpreted programming language with first-class functions.

  • web

    Some thing interesting about web. New door for the world.

  • server

    A server is a program made to process requests and deliver data to clients.

  • Machine learning

    Machine learning is a way of modeling and interpreting data that allows a piece of software to respond intelligently.

  • Game

    Some thing interesting about game, make everyone happy.

Recommend Org

  • Facebook photo Facebook

    We are working to build community through open source technology. NB: members must have two-factor auth.

  • Microsoft photo Microsoft

    Open source projects and samples from Microsoft.

  • Google photo Google

    Google โค๏ธ Open Source for everyone.

  • D3 photo D3

    Data-Driven Documents codes.