Coder Social home page Coder Social logo

band-issues-cn's Introduction

如何提供反馈(Issue)

创建Issue

打开仓库链接:https://github.com/udacity/band-issues-cn/issues ,选择 Issues 面板新建 issuenew issue

add-comment

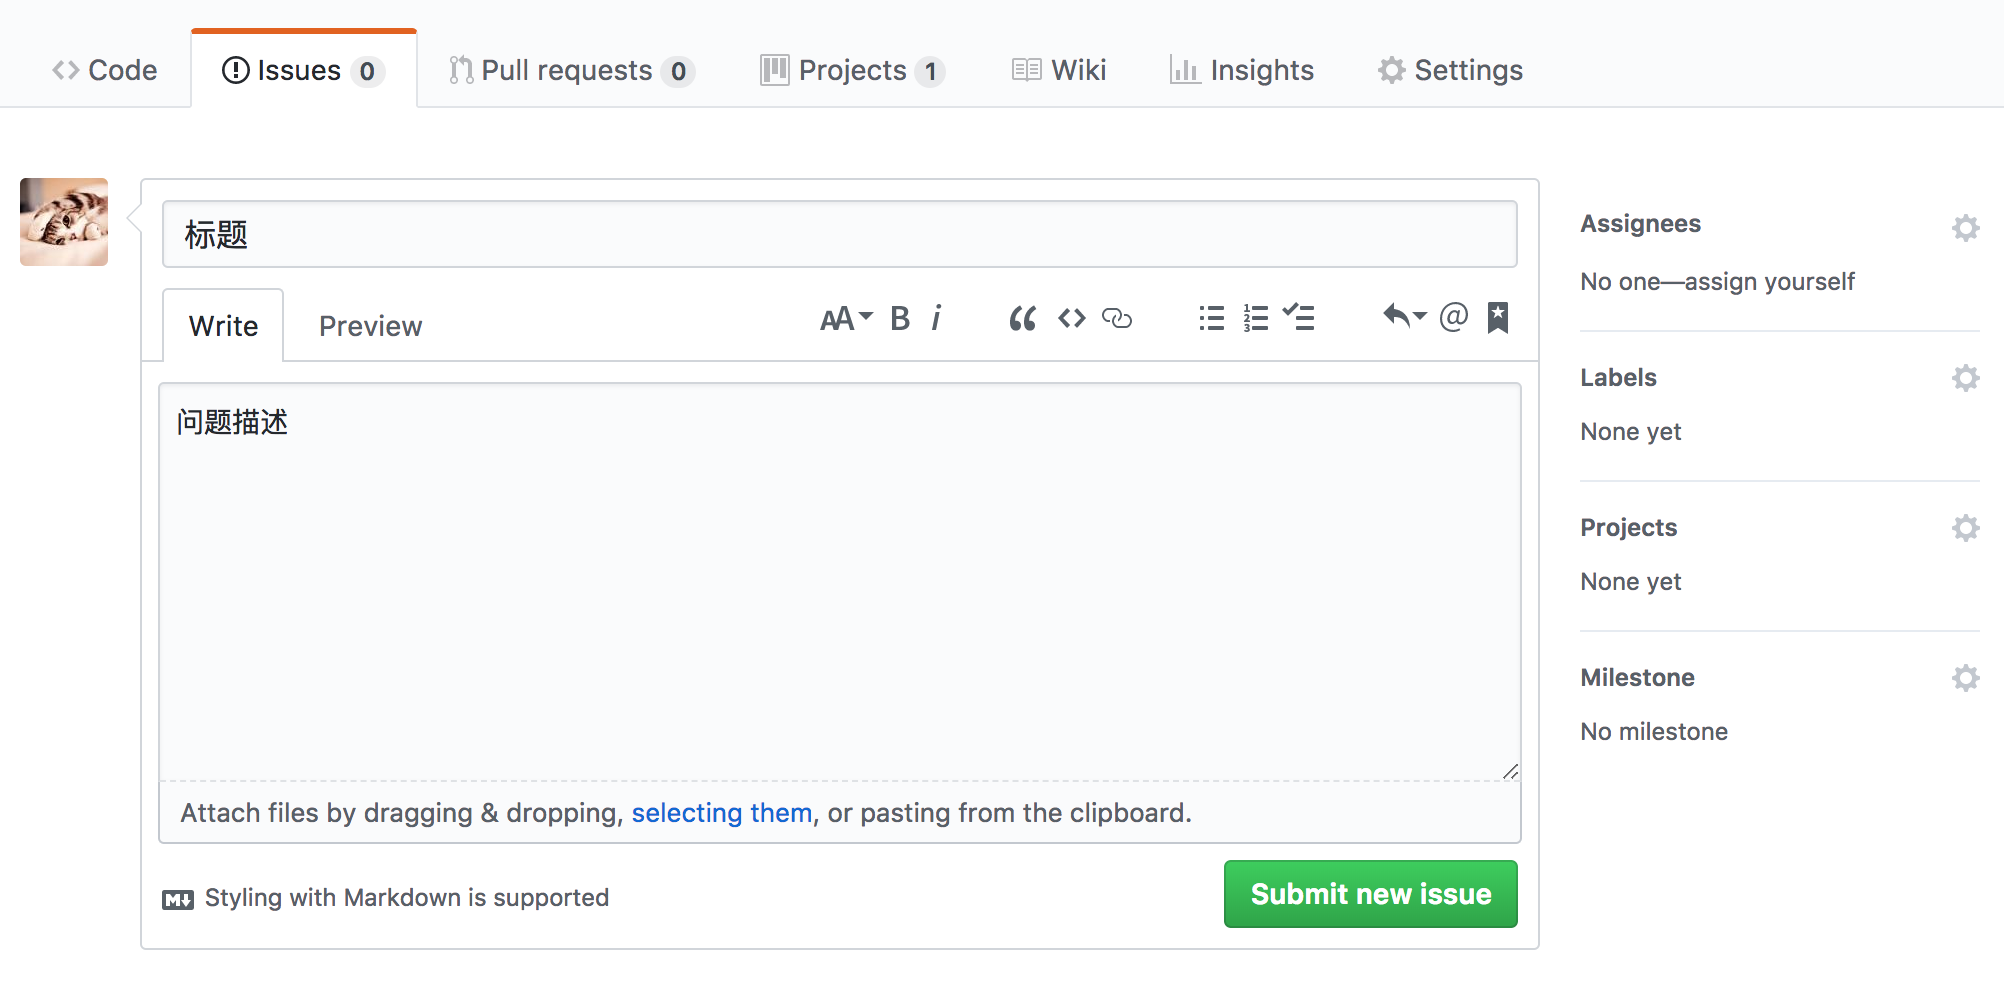
问题描述完毕后点击 Submit new issue ,提交。

注意事项

如反馈具体内容/文本错误,请提供截图并详细描述。
如提供关于学习曲线优化/内容难易程度等,则无需提供截图,但请详细描述。

Archival Note

This repository is deprecated; therefore, we are going to archive it. However, learners will be able to fork it to their personal Github account but cannot submit PRs to this repository. If you have any issues or suggestions to make, feel free to:

band-issues-cn's People

Contributors

evestorm avatar hty9103 avatar kyliewang avatar sudkul avatar

Stargazers

 avatar  avatar

Watchers

 avatar  avatar  avatar  avatar  avatar  avatar  avatar  avatar  avatar  avatar  avatar  avatar  avatar  avatar  avatar  avatar  avatar  avatar  avatar

band-issues-cn's Issues

描述统计学 I >10 概括统计简介

课程导航+地址

描述统计学 I >10 概括统计简介

截图

screen shot 2018-08-06 at 10 24 52 pm
screen shot 2018-08-06 at 10 25 02 pm

具体描述

字幕中 “可视化图表可以提供更完整的数据” 这句把 picture 翻译为 “数据”好像不太通顺。可能是 “可视化图表可以提供更完整的全貌” ?

描述统计学 II > 17 形状

课程导航+地址

描述统计学 II > 17 形状

截图

截图一
screen shot 2018-08-08 at 10 30 06 pm

截图二
screen shot 2018-08-08 at 10 34 45 pm

具体描述

  • 图一图二中,与之前类似的,字幕翻译与前面“箱形图”不统一。(看了后面视频后发现,后面几乎都用的”箱线图”。)

  • 图二英文字幕似乎应该是 “box plot”。

描述统计学 II > 最后要点

课程导航+地址

描述统计学 II > 最后要点

截图

image

具体描述

这里应该是标准差,因为标准差比方差使用度高,一般我们都是使用标准差的,这一点第四点也说明了。第四点这个不需要更改,只是这个也说明了我们平时更多都是使用标准差,所以这里第一点处应该是标准差。

描述统计学 II > 集中趋势和离散程度测量总结

课程导航+地址

描述统计学 II > 集中趋势和离散程度测量总结

截图

image

具体描述

这里第一句并不通顺,改为:

在分析分类变量时,我们通常只看一组数据属于一个分类的类别。例如,如果我们有两个狗的分类类别: 拉布拉多与非拉布拉多。我们可以说 32% 的狗为拉布拉多(百分比),也可以说 100 只狗中有 32 只是拉布拉多(计数)。

因为后面的课程有相同的段落,翻译的比这里好: 描述统计总结

解读数据可视化

解读数据可视化 > 项目描述

截图

image

具体描述

点击此处链接跳转到优达登录页面,反复输入账号密码都登录不上去。

Recommend Projects

  • React photo React

    A declarative, efficient, and flexible JavaScript library for building user interfaces.

  • Vue.js photo Vue.js

    🖖 Vue.js is a progressive, incrementally-adoptable JavaScript framework for building UI on the web.

  • Typescript photo Typescript

    TypeScript is a superset of JavaScript that compiles to clean JavaScript output.

  • TensorFlow photo TensorFlow

    An Open Source Machine Learning Framework for Everyone

  • Django photo Django

    The Web framework for perfectionists with deadlines.

  • D3 photo D3

    Bring data to life with SVG, Canvas and HTML. 📊📈🎉

Recommend Topics

  • javascript

    JavaScript (JS) is a lightweight interpreted programming language with first-class functions.

  • web

    Some thing interesting about web. New door for the world.

  • server

    A server is a program made to process requests and deliver data to clients.

  • Machine learning

    Machine learning is a way of modeling and interpreting data that allows a piece of software to respond intelligently.

  • Game

    Some thing interesting about game, make everyone happy.

Recommend Org

  • Facebook photo Facebook

    We are working to build community through open source technology. NB: members must have two-factor auth.

  • Microsoft photo Microsoft

    Open source projects and samples from Microsoft.

  • Google photo Google

    Google ❤️ Open Source for everyone.

  • D3 photo D3

    Data-Driven Documents codes.