We will use this repository to follow up and review all the exercises done in class for the MPHY0021: Research Software Engineering With Python course.
rse-classwork-2020's Introduction
rse-classwork-2020's People
Contributors

Stargazers


Watchers


Forkers
michaelmcmanus1 chris0327 rabbitofuh twemyss congjunxie premal-varsani i-gayo barnettzhang umitozmen kyrlazari wjl13910 markp121 fmaur92 ucapgum 2y-yue tomswift1 fsb404 zhao1313123 william-lpa aixixu ariannasaba sepnmoon esl-lewis timweaving yevonou vishalvenkatesh97 ana-villanueva-20 tonimlin ahmaducl wjmlong marinmlinarevic evansutcliffe jri-19 bob-jb davidscobie qazzgff ebony59 jonatanjk matlee99 shukun-niu zccaari harrisedward alexliu01k qxmsxc nikoschoinas r-yuzhe zcemadw luciferlys artix41 mada-lina alexyuanfun qjqtest1 brekaloenhaoyang gityunus euniceeewang christina-katsiva andriusvaitkus97 fedeninno immyharrison snigdha-sen kariosk reginavivian goldsmdn qijqij lwilliam-w rmapjs1 yuyang9898 andrewzhai stefpiatek lerocci jasperrpc danqing-huang nmontanabrown jingjiao1998 platapusdalaputos luweicai123 josiecarmichael jiaweitian liamchalcroft jaymeec yuanzhen-chen murielbaw fang997 blackwiggin limengze-louis hchughtai yy-x13 shai-15 pangding-jia rogerfw yx81 hongruishi cerysbm0 1215654642 layla-77 zeena-shawa emretataroglu cristinafni iulianabledea swishswish123rse-classwork-2020's Issues
Add a test to `times.py`
In this exercise, you will be given a few lines of code that perform a certain task (that you will have to understand) and then write an automated test that checks whether that task is performed correctly.
Setup
- Create a branch on your fork of rse-classwork-2020 repository called
testing. - On that branch, create a directory named
week05-testing. - Copy the code snippet below into a
times.pyfile, add it, commit it (includingAnswers UCL-RITS/rse-classwork-2020#61) and push it to your repository.
import datetime


def time_range(start_time, end_time, number_of_intervals=1, gap_between_intervals_s=0):
    start_time_s = datetime.datetime.strptime(start_time, "%Y-%m-%d %H:%M:%S")
    end_time_s = datetime.datetime.strptime(end_time, "%Y-%m-%d %H:%M:%S")
    d = (end_time_s - start_time_s).total_seconds() / number_of_intervals + gap_between_intervals_s * (1 / number_of_intervals - 1)
    sec_range = [(start_time_s + datetime.timedelta(seconds=i * d + i * gap_between_intervals_s),
                  start_time_s + datetime.timedelta(seconds=(i + 1) * d + i * gap_between_intervals_s))
                 for i in range(number_of_intervals)]
    return [(ta.strftime("%Y-%m-%d %H:%M:%S"), tb.strftime("%Y-%m-%d %H:%M:%S")) for ta, tb in sec_range]


def compute_overlap_time(range1, range2):
    overlap_time = []
    for start1, end1 in range1:
        for start2, end2 in range2:
            low = max(start1, start2)
            high = min(end1, end2)
            overlap_time.append((low, high))
    return overlap_time

if __name__ == "__main__":
    large = time_range("2010-01-12 10:00:00", "2010-01-12 12:00:00")
    short = time_range("2010-01-12 10:30:00", "2010-01-12 10:45:00", 2, 60)
    print(compute_overlap_time(large, short))
Understanding
- Spend some time reading the code, try to run it and see whether you understand what's going on.
- Have you seen
datetimebefore? - Play using your favourite tool (notebook, terminal, scripts) with the functions and objects used in
times.py
Converting the given example into a test
- Create a new file called
test_times.pyin the same directory wheretimes.pyis. - Make the
overlap_timefunction accessible to that file. (Hint: You need toimportthe file). - Move the content from the
if __name__ ...block fromtimes.pyto a function calledtest_given_inputintotest_times.py
and fill the gaps forresultandexpected. (For now, you can copy the output of the program as the expected value)
def test_given_input():
    ...
    result = ...
    expected = ...
assert result == expected- run
pyteston that directory and see whether the test is picked up bypytestand whether it passes. - Add the new and modified files to the repository, commit them (with a meaningful comment that also includes
Answers UCL-RITS/rsd-classwork-2020#61) and push it to your fork.
A sample solution can be found here.
Generating documentation with Sphinx
This exercise will introduce you to the basics of Sphinx using the same code you looked at in the previous exercise (#100).
Setup
- Navigate to the
week06/average-squares-examplefolder that you used in the previous issue. - (Note: You will be able to complete this exercise even if you haven't finished the previous one - the only difference is that some of your generated documentation will be different)
Understanding
- This folder contains a simple project that could do with some documentation.
- The code is within the
average_squaresfolder and your task is to generate some documentation to go alongside it.
- The code is within the
Exercises
Getting started with Sphinx
- Ensure that you have Sphinx installed for your system
- Create a
docsfolder alongside theaverage_squaresfolder - this is where your documentation for the project will be stored - From within the
docsfolder runsphinx-quickstartto generate the scaffolding files that Sphinx needs- Ensure that you select
noforSeparate source and build directories- this should be the default but if chosen incorrectly will mean your folder structure won't match up to the instructions below - You can accept the defaults and enter sensible information for the other fields.
- Ensure that you select
- Run
sphinx-build . _build/htmlormake htmlto generate html docs - Open
_build/html/index.htmlto see the built documentation in a browser
Modifying index.rst
- Open the
index.rstfile - this is the master document that serves as the entrypoint and welcome page to the documentation. - Add a line or two about the purpose of the project
- Save and rebuild the documentation - verify that it builds correctly
Adding content and structure
- In the
docsfolder create a subfolder calledcontent. - Within
docs/contentcreate a file calledaverage-squares-docs.rstwith the following contents:
Average Squares Documentation
=============================
- Update the
toctreedirective inindex.rstso that this new file is included. - Rebuild the documentation and verify that this file is now linked to.
Using Docstrings to create documentation
As you saw in the previous exercise (#100) the code in this project contains some docstrings - let's show this in our Sphinx generated documentation
- Follow the instruction on the Sphinx getting started page to enable the
autodocfunction - Can you modify the
content/average-squares-docs.rstfile to include docstrings from the code automatically? - Hint: You may find it useful to modify the path setup in
docs/conf.pyin the following way so it is easier for Sphinx to find the location of the code
# -- Path setup --------------------------------------------------------------

import os
import sys
sys.path.insert(0, os.path.abspath('..'))
Updating your PR
Commit the changes to your branch, updating the PR you created in the previous exercise. Add a comment with Answers UCL-RITS/rse-classwork-2020#101
Explore further features of Sphinx
There are many additional features of Sphinx - explore them if you have time. For example:
- Are you able to modify the theme?
- What other Sphinx extensions are available?
- A more extensive introduction to Sphinx is linked to on the Moodle resources.
Argument Parsing 1/3
When writing code, it is important to think about how you or others can run it. A popular way is to use a command-line interface, so that your code can be executed as a script from a terminal. In this exercise we will look at the tools that Python offers for creating such interfaces.
We will use the squares.py file we used last week for the documentation exercise. We will make the code more generic by creating a command-line interface that will make it easier to call.
Constant weight
Let's first make our first interface without weights (assuming them constant and equal to 1).
- Choose who in your team is sharing
- Make sure your local copy of this repository is up to date and create a new branch from
week06branch. - Open the file
squares.py. Make sure you can run it from a terminal! - Look at the part of the file that is inside the
if __name__ == "__main__":guard. This is the code that you will work on. Currently, the input values are hardcoded into the file. - Use the
argparselibrary to rewrite this part so that it reads only thenumbersfrom the command-line (keep for now the weights hardcoded). The file should be runnable aspython squares.py <numbers>...(where<numbers>should be replaced by the sequence of numbers of your choice)- Look at the example in the notes to get you started, if you haven't already.
- Decide which values should be read from the command line.
- Add them as
argparserarguments. - Check the auto-generated help:
python squares.py --help. - Check that you can run the file with the new form.
- Share your solution as a pull request mentioning this issue (by including the text
Addresses #140in the pull request description), remember to mention your team members too! (with@github_username)
Creating a 🐍📦 with an entry point
Help Charlene to have a command she can run from anywhere adding an entry point.
-
Choose who in your team is sharing now! (make sure you've pulled from your colleague's fork!)
-
Move the
if __name__ == "__main__":block to its own file (e.g.,command.py) and add it as entry point tosetup.py -
Add the dependencies of this library as requirements to
setup.py. -
Try to install it by running
pip install -e .where thesetup.pyis. -
Go to a different directory, run
python -c "import sagital_average"and see whether the installation worked. -
Share your solution as a pull request to Charlene's repository mentioning this issue (by including the text
Addresses UCL-RITS/rse-classwork-2020#144in the pull request description), remember to mention your team members too! (with@github_username)
Avoid code repetition in the tests
Avoid code repetition using pytest.mark.parametrize
Now that you have written four different tests for times.py, take a step back and look at your code: There is a lot of repetition, almost every test (apart from the negative test) essentially does the same (albeit with different data), which makes our test code harder to change in the future. (You can start from the sample solution if you prefer.)
We can use pytest.mark.parametrize to get our tests DRY (Don't Repeat Yourself).
- You have seen
pytest.mark.parametrizein the notes. Using the documentation ofpytest.mark.parametrizeif needed, see how you can compress most of the tests on a single one.
You will need the test function to accept parameters, for example time_range_1,time_range_2 and expected,
let the parametrize decorator know about it as its first argument and pass a list of tuples of length 3
with the values for each test.
What are the advantages and disadvantages of using parametrize in this case?
If you are finished with this issue, feel free to continue working the related issue #92 , looking at test fixtures.
A sample solution for this exercise can be found here.
Creating a 🐍📦
Help Charlene to create her repository into a package (remember to commit after each step).
-
Choose who in your team is sharing now! (make sure you've got a fork and a local copy from Charlene's repository)
-
Add a
.gitignorefile to the repository to not add artefacts created by python or your text editor. You can use gitignore.io to generate a file for your needs. -
Create a
testsdirectory and add a test similar to what we used last week when we discovered the bug. -
Fix
sagital_brain.pyand make sure the test passes and commit these changes. -
Modify the repository directory structure to make sagital_average as an installable package (don't forget to add empty
__init__.pyfiles). -
Add a
setup.pyfile with the information needed -
Try to install it by running
pip install -e .where thesetup.pyis and run the tests withpytest. -
Share your solution as a pull request to Charlene's repository mentioning this issue (by including the text
Addresses UCL-RITS/rse-classwork-2020#143in the pull request description), remember to mention your team members too! (with@github_username)
test coverage
Visualising the test coverage
Make sure you've installed pytest-cov on your environment.
- Run the coverage and produce an html report.
- Visualise it by opening the html report in your browser
- Commit, push and link to this issue.
Ensure Travis-CI also reports your coverage!
Learning branches with git
In small groups, using github's visualisation tool as shown in class, do the steps needed to replicate the repository structure shown below.
❗ hash numbers for the commit are going to be different and the final shape of the graph may look slightly different.
✔️ When done, take a screenshot of your result and create an issue in your fork that includes the screenshot of the result, a code block with your steps and a link to this issue.

To add a code block with your steps use the following syntax:
```bash
git commit -m "First commit"
git ...
```
that will render as:
git commit -m "First commit"
git ...
To refer back to this issue you need to add the following text to your issue message:
Answers UCL-RITS/rse-classwork-2020#2
That creates a link that will appear under this issue.
Software project management - Student
Stage 1
Your PI’s collaborator would like your help with analysing some data. The data is stored in CSV files, and the processing consists of computing the average value for each column.
For example, for an input file with the contents
2, 10, 200, 2
0, 20, -200, 5
the output of the analysis should be
1, 15, 0, 3.5
You must write a library that lets someone read a file and save the results (average values) in a different file.
The different parties should work together to understand what exactly is needed, decide on a plan of action, then write some code to solve the problem. Work in steps:
- Agree on what the program will do (what the inputs and outputs are)
- Decide a general structure for your file (the main functions you need)
- Decide a detailed structure (the inputs and return values for each function)
- Write the code
Questions may come up which are not covered by this description. Make your own decisions according to your judgement!
For students/developers: Be as detailed as you can when asking for requirements. Once you have reached agreement for a step, don’t go back and change it in future steps.
Stage 2
Your PI’s collaborator has come back with more requests. This time, things are not as clear, and requirements will change as you work. Create the code over several iterations, gradually adding functionality or making changes. At each iteration, make sure you have something that works, even if it’s not the complete product. Your workflow may look something like this:
- Decide on a new feature to add or a change to make.
- Make the required changes to the code.
- Present the result to the collaborator and your PI.
As before, make your own decisions when something is unclear. Do not worry about completing all of the requirements that may come up.
For developers: You can choose to incorporate multiple changes in an iteration, as long as you have something that partially works at the end of that cycle!
Argument Parsing - 3/3
Carrying on from the previous exercise, now we will change the options so instead of reading the numbers from the command line, they are read from text files (one number per line), and keeping the optional parameter to accept weights also as a file.
reading data from files
- Choose who in your team is sharing now! (pull the code from the previous exercise into your local repository)
Hint: You need to add a new remote from your team member and pull their branch - Create a new branch from the branch used in the previous exercise.
- Open the file
squares.py. Make sure you can run it from a terminal with some input values! - Look at the part of the file that is using
argparse - Modify the arguments so the data is read from a text file. Where the
weightsare still optional. The file should be runnable aspython squares.py <file_numbers> --weights <file_weights>(where<...>should be replaced by the file of your choice).- Look at the working with data section to refresh how we read files in Python.
- Modify the
argparserarguments to receive file names instead of numbers. - Check the auto-generated help:
python squares.py --help. - Check that you can run the file with the new form, whether you pass a weights file or not.
- Share your solution as a pull request mentioning this issue (by including the text
Addresses #142in the pull request description), remember to mention your team members too! (with@github_username)
Improving performance using MPI
Approximating π using parallelisation
Introduction
This exercise builds on #185. It is part of a series that looks at execution time of different ways to calculate π using the same Monte Carlo approach. In this approach, π is approximated by sampling n random points inside a square with side 1, computing the proportion of those points that fall inside the unit circle, and multiplying that by 4/n.

This exercise uses the Message Passing Interface (MPI) to accomplish this approximation of π. The code is already written, and you can find it in calc_pi_mpi.py on the week10 branch of this repository. Your job is to install MPI, and measure how much time it takes to complete in comparison to #185.
MPI
MPI allows parallelisation of computation. An MPI program consists of multiple processes, existing within a group called a communicator. The default communicator contains all available processes and is called MPI_COMM_WORLD.
Each process has its own rank and can execute different code. A typical way of using MPI is to divide the computation into smaller chunks, have each process deal with a chunk, and
have one "main" process to coordinate this and gather all the results. The processes can communicate with each other in pre-determined ways as specified by the MPI protocol -- for example, sending and receiving data to a particular process, or broadcasting a message to all processes.
Preparation
We are going to run the original (non-numpy) version in parallel, and compare it to the non-parallel version.
We will be using mpi4py, a Python library that gives us access to MPI functionality.
Install mpi4py using conda:
conda install mpi4py -c conda-forgeor pip:
pip install mpi4pyOn windows you will also need to install MS MPI
The MPI version of the code is available at calc_pi_mpi.py. Look at the file and try to identify what it is doing -- it's fine if you don't understand all the details! Can you see how the concepts in the brief description of MPI above are reflected in the code?
Execution
- Run the MPI version as:
The
mpiexec -n 4 python calc_pi_mpi.py
-nargument controls how many processes you start. - Increase the number of points and proceses, and compare the time it takes against the normal version. Note that to pass arguments to the python file (like
-npbelow), we have to give those after the file name.Tip: To avoid waiting for a long time, reduce the number of repetitions and iterations ofmpiexec -n 4 python calc_pi_mpi.py -np 10_000_000 python calc_pi.py -np 10_000_000 -n 1 -r 1
timeit(1 and 1 in this example) - Think of these questions:
- Is the MPI-based implementation faster than the basic one?
- Is it faster than the
numpy-based implementation? - When (for what programs or what settings) might it be faster/slower?
- How different is this version to the original? How easy is it to adapt to using MPI?
Friend group data model
- Fork the friend group repository to one of your accounts.
- Add everyone else in your group as a collaborator to the forked repository.
- Clone your fork locally.
- Create a new branch named with a combination of your team
e.g.,dpshelio-ageorgou-stefpiatek. - Write your code in the file
group.pyto do what the exercise asks - see the instructions in the README file of the exercise repository. - Commit your changes to your branch! (with a meaningful message)
- Push your changes from your computer to your fork.
- Create a pull request (PR) from your branch to my repository.
Add a meaningful title to that PR and don't forget to mention your partners in the description (as@username) and a link to this issue:Answers UCL-RITS/rse-classwork-2020#8
Data structures and comprehension expressions
Exercise done alone:
-
Using the fork of data structure for the group of people that you created earlier for #️⃣8️⃣, clone your fork locally if you havent already (or create new fork and add the code from the example solution if your group hadn't managed to create a solution)
-
Create a new branch from your team-named branch with your name only
-
Add some code that makes use of comprehension expressions to your
group.pyfile so that it prints out the following when the script is run:- the maximum age of people in the group
- the average (mean) number of relations among members of the group
- the maximum age of people in the group that have at least one relation
- [more advanced] the maximum age of people in the group that have at least one friend
-
Create a pull request (PR) from your branch to the original repository.
Add a meaningful title to that PR and a link to this issue:Answers UCL-RITS/rse-classwork-2020#10
Sample solution (with previously given sample data structure)
Improving performance using Numba and Cython
Approximating π using Numba/Cython
Introduction
This exercise builds on #185. It is part of a series that looks at execution time of different ways to calculate π using the same Monte Carlo approach. In this approach, π is approximated by sampling n random points inside a square with side 1, computing the proportion of those points that fall inside the unit circle, and multiplying that by 4/n.
This exercise uses Numba and Cython to accomplish this approximation of π. A Numba version of the code is already written, and you can find it in calc_pi_numba.py on the week10 branch of this repository. Your job is measure how much time it takes to complete in comparison to #185.
Preparation
The two frameworks we will look at allow you to write Python-looking code and compile it into more efficient code which should run faster. Numba is a compiler for Python array and numerical functions. Cython is a way to program C extensions for Python using a syntax similar to Python.
Both frameworks should come with your conda installation. If not, and you get errors when running the instructions below, use conda or pip to install them (see their websites linked above for instructions).
Using Numba
- Look at the implementation using numba:
calc_pi_numba.py - Discuss how different it looks to the original. Is it more/less readable? Can you understand what the differences mean?
- Run the code with
python calc_pi_numba.py. How does the time compare to the original?
Using Cython
Next, try to use Cython to approximate π. This part will be easier for users of Linux and OS X, as getting Cython to run on Windows is a little more involved.
- Open the Jupyter notebook in
calc_pi_cython.ipynb. - As before, discuss how different the code looks to the original.
- Use
%timeitto compare with the runtime of the Numba version and the original code. - From what you have read or know, can the Cython performance be further improved?
Plotting the earthquake dataset
Your goal is to analyse the same earthquake data as before (#12) and produce two plots, showing:
- the frequency (number) of earthquakes per year
- the average magnitude of earthquakes per year
- If you are not sure you have read the data correctly, you may want to look at the sample solution. You can start from that or from one of your own answers.
- Take a few minutes to discuss how you will structure your code. What steps do you need and how will they connect? Does it make sense to create separate functions for some of them?
- Write some code to produce one plot.
- When you are finished (or have done as much as you can), open a Pull Request to the
week04branch of this repository. Include the textAnswers UCL-RITS/rse-classwork-2020#48in the description to link it to this issue. Add one or both plots if you want! - If you have time, continue with the other plot and add it to the PR!
Some hints:
- Pay particular attention to how you can extract the year!
- First, find where the date and time of each earthquake is stored in the data.
- The US Geological Survey (from where the data comes) has some information on the structure of the response, including documentation about each field.
- You may also want to look at Python's
datetimemodule.
- You can do the computations required in "plain" Python, but think about using the
numpylibrary (theuniquefunction or others could be helpful, depending on how you have approached the problem) - For plotting:
- Make sure you have computed the values you need to plot!
- Choose an appropriate plot type (if you need inspiration, there are various galleries) and then see how to create that in
matplotlib. - See whether you need to put your data in a particular form to create the plot.
- After plotting, do you need to make any visual adjustments? (on, for example, the axes, labels, colours...)
- Save your plots to a file and check the result.
Refactoring - Part 3
This follows on from #167.
Stage 3: Object-oriented structure
We will now look at at how to represent and manipulate this data using our own user-defined objects.
Instead of a dictionary, we will define two classes, which will represent a single person and the whole group. We will restructure our code so that group functions apply directly to the group, instead of the person having all of the methods.
Again, you may also wish to refer to the course notes on object-oriented design.
Take a look at the file initial_two_classes.py to see one possible way in which the code could be structured.
Internally, the Group class still uses a dictionary to track connections, but someone using the class does not need to be aware of that. We have implemented some methods for these classes, but not everything that is required (the remaining methods have pass instead of actual code).
Your task:
- You should have the files from the previous parts of the exercise.
- Fill in the remaining method definitions.
- Update the section at the end of the file so that it creates the same group as in the previous example, but using the new classes you have defined.
- Run the file to make sure it gives the same results as before (that is, the assertions still pass).
- Commit your changes.
- Think of the benefits and drawbacks of the object-oriented structure compared to the original approach (collection of functions).
- If you have time, think of other changes you consider useful and try them.
Generating and Solving conflicts
- Read the content of the script below
- Run it one by one or as a script on your machine. It will create a merge conflict.
- Resolve the merge conflict so the text in README.md is "Hello World".
- Make sure your working tree is clean
- Create an issue in your fork with a code block showing how the file looks before and after the conflict. Add a link to this issue in the description of your issue as:
Answers UCL-RITS/rse-classwork-2020#3
cd Desktop/
mkdir MergeConflict
cd MergeConflict/
git init
touch README.md
echo "Hello" > README.md
git add README.md
git commit -m "first commit on main"
# if your default is not main; rename master with: git branch -m main
git checkout -b new-branch
echo "Hello World" > README.md
git commit -am "first commit on new-branch"
git checkout main
echo "Hola" > README.md
git commit -am "second commit on main: adds something in Spanish"
git merge new-branch
Readability
There are many ways we can write code that produces a particular result. Often these different ways will trade off one aspect over another; for example, people sometimes choose to sacrifice readability for speed, or brevity for clarity.
For this exercise, we will focus on what makes code easier to read and maintain. Even when you have written some code yourself, it can be hard to understand it immediately if you come back to it after a long time. This can be even more difficult for those seeing the code for the first time! Many factors can affect how easy your code is to read for someone who is new to it.
The branch week09 has two short files named version1.py and version2.py, which contain some code for a hypothetical analysis. The files don't work by themselves, as they require some (fictional) libraries. Both versions do the same thing, but are written differently.
Look at the two files, then think about which one is easier to read, and why. Put your answers in the Moodle questionnaire.
Using docstrings and doctests
This exercise will show why it is important to keep documentation accurate, and how to do this automatically using docstrings and doctests.
Setup
- Make sure you've had a look at the course notes on documentation so that you understand some of the background around docstrings and doctests
- Pull the latest changes from this repository into your fork (
git pull upstream) - Checkout the branch called
week06(git checkout week06) - Navigate to the
week06/average-squares-example/average_squaresfolder - Open the
squares.pyfile
Understanding
- Spend some time reading and understanding the code.
- Do you understand what it's meant to do? Do the docstrings help?
- Run the code with the default inputs. Does it produce the output you expect?
- Try running the code with other inputs. What happens?
Exercises
As you may have discovered, the code in squares.py does contain some mistakes. Thankfully the functions in the file include documentation that explains how they should behave.
Run the doctests
- Use the
doctestmodule to see whether the documentation of the code is accurate:python -m doctest squares.py - Try to understand the structure of the output - what errors are reported, are they what you expected from looking at the code in the previous steps?
Update the docstrings
- Look at the errors related to the
average_of_squaresfunction.- Figure out where the mismatch between the documentation (intended behaviour) and the actual behaviour of the function exists.
- Correct usage examples in the
average_of_squaresfunction that are incorrect
Correct the code and verify
- Re-run the code; again comparing the actual and expected behaviour. What is the error?
- Correct the error in the code and rerun
doctestto confirm that theaverage_of_squaresdocumentation is now correct
Repeat the process for convert_numbers
- Look at the
doctesterror from theconvert_numbersdocumentation. - Can you identify the bug? How would you fix this?
Submit a Pull Request
Once you have completed or made progress on the exercises
- Create a pull request (PR) from your branch to the UCL-RITS repository. Add a meaningful title to that PR and a link to this issue:
Answers UCL-RITS/rse-classwork-2020#100
Profiling code
We have seen how to measure the total time that a function takes to run (#185), but that doesn't help us with knowing which parts of the code are slow!
To look into that, we need to use a different too called a profiler. Python comes with its own profiler, but we will use a more convenient tool.
Setup
This exercise will work with IPython or Jupyter notebooks, and will use two "magic" commands available there. The %prun magic should be available with every installation of the IPython/Jupyter. However, you may need to install the second magic (%lprun).
If you use Anaconda, run conda install line_profiler from a terminal. Otherwise, use pip install line_profiler.
Using profiling tools in IPython/Jupyter notebook
prun's magic gives us information about every function called.
- Open a jupyter notebook or an IPython terminal
- Add an interesting function (from Jake VanderPlas's book)
def sum_of_lists(N):
    total = 0
    for i in range(5):
        L = [j ^ (j >> i) for j in range(N)]
        # j >> i == j // 2 ** i (shift j bits i places to the right)
        # j ^ i -> bitwise exclusive or; j's bit doesn't change if i's = 0, changes to complement if i's = 1
        total += sum(L)
    return total
- run
%prun:%prun sum_of_lists(10_000_000)
- Look at the table of results. What information does it give you? Can you find which operation takes the most time? (You may find it useful to look at the last column first)
Using a line profiler in IPython/Jupyter
While prun presents its results by function, the lprun magic gives us line-by-line details.
- Load the extension on your IPython shell or Jupyter notebook
%load_ext line_profiler
- Run
%lprun%lprun -f sum_of_lists sum_of_lists(10_000_000)
- Can you interpret the results? On which line is most of the time spent?
learning git
Reading and writing structured data files
The purpose of this exercise is to check that you are able to read and write files in commonly-used formats.
Make sure you have read the course notes on structured data files first!
For this exercise, you will work with the code you wrote to represent a group of friends during the last lesson (#8).
If you prefer, you can use the sample solution instead of yours. You can use either JSON or YAML for this exercise - the choice is up to you.
Write some code to save your group to a file in the format of your choice (JSON or YAML).
Make sure you can read the file by loading its contents. Is the result identical to the original structure?
If you have questions or run into problems, leave a message on the Q&A forum on Moodle.
Write a negative test
Negative tests - Test that something that is expected to fail actually does fail
time_range may still work when end_time is before start_time, but that may make overlap_time not working as expected.
- Write a test that tries to generate a time range for a date going backwards.
- Modify
time_rangeto produce an error (ValueError) with a meaningful message. - Use of
pytest.raisesto check for that error in the test. - Commit, push and link to this issue.
What other similar tests could we add?
A sample solution could be found here.
Argument Parsing - 2/3
Carrying on from the previous exercise, now We will add an optional parameter to accept weights in your latest squares.py file.
with weights
- Choose who in your team is sharing now! (pull the code from the previous exercise into your local repository)
Hint: You need to add a new remote from your team member and pull their branch - Create a new branch from the branch used in the previous exercise.
- Open the file
squares.py. Make sure you can run it from a terminal with some input values! - Look at the part of the file that is using
argparse - Add a new argument that's optional and that can accept the weights as done previously with the
numbers. The file should be runnable aspython squares.py <numbers>... --weights <weights>...(where<numbers>andweightsshould be replaced by the sequence of numbers and weights of your choice).- Look at the argparse documentation
- Add the weights as
argparserarguments. - Check the auto-generated help:
python squares.py --help. - Check that you can run the file with the new form, whether you put the weights or not.
- Share your solution as a pull request mentioning this issue (by including the text
Addresses #141in the pull request description), remember to mention your team members too! (with@github_username)
Creating a 🐍📦 with ℹ, 📚 and 👷
Make Charlene super happy by adding basic information, a documentation website and the config to run the tests automatically on Travis
-
Choose who in your team is sharing now! (make sure you've got a fork and a local copy from Charlene's repository)
-
Write three files that will make this library sharable, citable and descriptive.
-
Create a
.travis.ymlfile to run the test automatically each time something it's pushed to the repository. -
Optional: As we did last week, generate a documentation website using
sphinx. (Using thegithubpagessphinx extension and pushing the build directory into agh-pagesbranch will show you the documentation in the repository's website) -
Share your solution even if not complete as a pull request to Charlene's repository mentioning this issue (by including the text
Addresses UCL-RITS/rse-classwork-2020#145in the pull request description), remember to mention your team members too! (with@github_username)
Separate data into a fixture
Separating data from code
Your parametrised bit now probably got a bit too big and difficult to read.
Create a fixture.yaml file where you can store what you parametrised before
in a more human readable way.
Load the yaml file within the test and use it that structure to feed the parametrize test.
The fixture.yaml could look like:
- generic:
    time_range_1: ...
    time_range_2: ...
    expected:
        - ...
        - ...
- no_overlap:
    time_range_1: ...
    time_range_2: ...
    expected: []
A sample solution to this exercise can be seen here.
Finding bugs in history
Charlene Bultoc has just started a post-doc at an important neuro-science institute. She is doing research on a new methodology to analyse signals in our brains detected through a combination of CT and MRI. Using image processing techniques she can simplify the whole dataset into a grid of 20x20 arrays.

Her theory is that the average of such signals through the sagittal plane is constant over time, so she has written some software to calculate this. She decided to write that software in Python so she could share it (via GitHub, rsd-sagital_average) with people from other labs. She didn't know as much Python when she started as she does now, so you can see that evolution in her program.
Charlene is an advocate of reproducibility, and as such she has been keeping track of what versions she's run for each of her results. "That's better than keeping just the date!" you can hear her saying. So for each batch of images she processes she creates a file versions.txt with a content like:
scikit-image == 0.16.2
scikit-brain == 1.0
git://git.example.com:brain_analysis.git@dfc801d7db41bc8e4dea104786497f3eb09ae9e0
git://github.com:UCL-RITS/rsd-sagital_average.git@02fd8791c93b630fc2aecd198e4e4a3a9b441eda
numpy == 1.17
With that information she can go and run the same analysis again and again and be as
reproducible as she can.
However she's found that sagital_average has a problem... and she needs to re-analyse all
the data since that bug was introduced. Running the analysis for all the data she's produced
is not viable as each run takes three days to execute - assuming she has the resources available in the university cluster, and she has more than 300 results.
In all the versions of the program, it reads and writes csv files. Charlene has improved the program considerably over the time, but kept the same defaults (specifically, there are an input file, brain_sample.csv, and an output file, brain_average.csv). She has always "tested" her program with the brain_sample.csv input file provided in the repository. However (and that's part of the problem!), the effect of the bug is not noticeable with that file.
We can then help her either by letting her use our laptops or (better) by finding when the bug was introduced and then run only the ones that need to be re-analysed.
Finding when the bug was introduced seems the quickest way. Download the repository with her sagital_average.py script and use git bisect to find the commit at which the script started to give wrong results.
Do it manually first (as explained in this section of the notes).
Steps to help Charlene:
- Fork Charlene's repository and clone your fork.
- Run the latest version of the code with the existing input file
- Create a new input file to figure out what the bug is
Hint: You can generate an input file that does show the error using the code snippet below:You may need to create thedata_input = np.zeros((20, 20)) data_input[-1, :] = 1 np.savetxt("brain_sample.csv", data_input, fmt='%d', delimiter=',')
brain_sample.csvfile each time you move through the commits. - Use bisect manually until you find the introduction of the error. Take note of the hash and date of the commit that introduced the bug - you will need this information in class.
- How would you fix the bug?
Software project management - PI
Stage 1
Your collaborator would like your lab's help with analysing some data. The data is stored in CSV files, and the processing consists of computing the average value for each column.
For example, for an input file with the contents
2, 10, 200, 2
0, 20, -200, 5
the output of the analysis should be
1, 15, 0, 3.5
You must help write a library that lets someone read a file and save the results (average values) in a different file.
The different parties should work together to understand what exactly is needed, decide on a plan of action, then write some code to solve the problem. Work in steps:
- Agree on what the program will do (what the inputs and outputs are)
- Decide a general structure for your file (the main functions you need)
- Decide a detailed structure (the inputs and return values for each function)
- Write the code
Questions may come up which are not covered by this description. Make your own decisions according to your judgement!
For PIs/project managers: Make sure that each step is followed and that the two sides agree before moving on. Try to solve disagreements. Keep in mind the total time allocated for this.
Stage 2
Your collaborator has come back with more requests. This time, things are not as clear, and requirements will change as you work. Create the code over several iterations, gradually adding functionality or making changes. At each iteration, make sure you have something that works, even if it’s not the complete product. Your workflow may look something like this:
- Decide on a new feature to add or a change to make.
- Make the required changes to the code.
- Present the result to the collaborator and your PI.
As before, make your own decisions when something is unclear. Do not worry about completing all of the requirements that may come up.
For PIs: Help the developers when choosing what changes to make. Ensure that new requests from the collaborator don’t interfere with the current development cycle.
Mocking exercise
Mocking a web service
There's a web service that gives you the times of when the ISS is visible from your location
-
Using this web service, write a function named
iss_passesintimes.pythat generates a similar output thantime_range.- The API looks like:
http://api.open-notify.org/iss-pass.json?lat=29.55&lon=95.1&n=5(Documentation) - To convert unix time stamps you can use
datetime.datetime.fromtimestampfunction.
- The API looks like:
-
Write a test for the
iss_passesfunction that mocks the request call and the response to avoid querying the website all the time we run the tests. -
Commit, push and link to this issue.
A sample solution can be found here.
Fork this repository and enable issues
1. Fork this repository
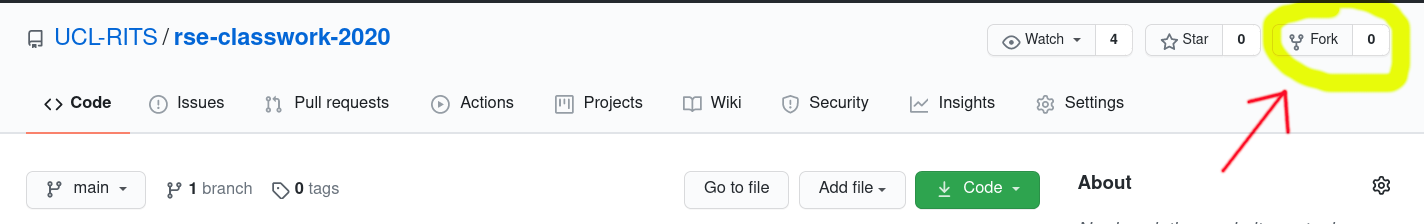
2. Go to the settings in your fork

3. Enable issues

4. React to this issue with 👍
(:point_up: right corner)

Merge Conflict
Solved the conflict and merged:

Refactoring - Part 2
This follows on from #166.
Stage 2: Using a Person Class
We will now look at at how to represent and manipulate the person data with our own Person class.
Instead of each person being a dictionary, we will represent them with the class that has methods for dealing with the connections. We will restructure our code so that the functions become methods of the class. You may also wish to refer to the course notes on object-oriented design.
One example of the starting point for the structure is the file initial_person_class.py.
We have implemented some methods for these classes, but not everything that is required (the remaining methods have pass instead of actual code).
Your task:
- You should already have the files from the previous part.
- Fill in the remaining code in
initial_person_class.pyso that the file works as before. - Run the file to make sure the assertions are still satisfied.
- Commit your changes.
💄🐍 code - linting
-
Analyse Charlene's package and run one of the linting tools
You may need to install them. Which messages did you get? Was your IDE (e.g., VS Code) warning you of it already? -
Fix them either manually or automatically using a code formatter (e.g., yapf or black)
-
Can you think of a way of checking the style is checked before merging new contributions? Add your suggestions below.
Write tests for edge cases
Now that you know how to create a test, create three further tests for times.py:
Setup
Either start from your homework solution, or
- Create a new branch on your fork of rse-classwork-2020 repository
- Create files
times.pyandtest_times.pyfollowing the sample solution of the homework and commit the files
Create three further tests
- create a test each for:
- two time ranges that do not overlap
- two time ranges that both contain several intervals each
- two time ranges that end exactly at the same time when the other starts
- run
pytestand see whether all tests are picked up bypytestand whether they pass. - fix any bugs in
times.pythe test may have helped you find. - Add the new and modified files to the repository, commit them (with a meaningful commit message that also includes
Answers UCL-RITS/rsd-classwork-2020#86) and push it to your fork.
A sample solution can be found here
Learning all about Pull Requests
In small groups:
- Fork my Travel guide repository
- Clone your fork locally
- Create a new branch named with a combination of your team
e.g.,dpshelio-ageorgou - Create a new file in the right place named after a place both of you would like to visit. Create any intermediate directory needed.
e.g.,./europe/spain/canary_islands.md - Add to that file:
- a title (e.g.,
# Canary Islands) - a small paragraph why you would like to go there
- End the file with a link to wikivoyage and/or wikipedia of that place.
e.g.,More info at [wikivoyage](https://en.wikivoyage.org/wiki/Canary_Islands) and [wikipedia](https://en.wikipedia.org/wiki/Canary_islands)
- a title (e.g.,
- Commit that to your branch! (with a meaningful message)
- Add the internal links needed to get from the main page to that one
e.g., link from Europe'sREADME.mdto Spain'sREADME.md, link from Spain'sREADME.mdto Canary Islands filecanary_island.md - Commit these changes! (with a meaningful message)
- Create a pull request from your branch to my repository.
Add a meaningful title to that PR and don't forget to mention your partner in the description (as@usernameand a link to this issue
Answers UCL-RITS/rse-classwork-2020#4
Working with the US Geological Survey earthquake data set
This exercise will look at how to read data from an online source (web service), explore and and process it.
You will write some code, then review each other's work on GitHub and discuss on Moodle.
Step 0: Setup
Make sure you have read the note chapters on working with files, Internet data and structured data files.
Set up your copy of this repository following the guide on Moodle. Then pull the latest changes (git pull upstream) and checkout the branch week04 (git checkout week04).
Step 1: Exploration
Read the exercise description in the lecture notes.
Your task will be to find the location and magnitude of the strongest earthquake in the UK in the last century. You don't need to create any maps or other plots!
Before you start, take some time to understand the structure of the data. To see the data, you can try different things; for example:
- Get the response as shown in the exercise description:
quakes = requests.get(...) - Save the response body (
quakes.text) in a text file (give the file an appropriate extension to help applications display it nicely!) - Open the file in an editor like VS Code (you may want to automatically format it to make it look nicer). Some browsers may also display it so that the structure is clear.
The following questions may help you explore and understand how the data is laid out:
- What format is the returned data (
response.text) in? Can you read it into a data structure programatically? - How many broad "sections" does this response comprise?
- How many earthquakes are returned? (hint: is there any metadata included that could tell you this? How would you interpret it?)
- One section (
"features") is by far larger than the others. How many entries does it hold? - Pick one feature in this big list:
- Can you see its location? Is that as a place name or coordinates?
- Can you see its magnitude?
- How do you think the time of the earthquake is represented?
Step 2: Coding and discussion
When you think you understand enough, start writing your answer in the week04/quakes.py file in your fork.
When you are happy with your solution (or want some feedback!):
- Push your new code to your own fork.
- On GitHub, open a pull request from your fork to the
week04branch of the original repository. - In the description, include the text
Answers UCL-RITS/rse-classwork-2020#12. If you have finished the exercise, also give the answers you found (e.g. "The maximum magnitude is 3 and it occurred at coordinates (4.0, -3.8)." - On Moodle, in the discussion forum for this exercise, open a new thread and give the URL of your pull request.
- Choose one of the other pull requests listed on that forum, and leave a review. Comment on things you find interesting or don't understand, any problems you think you spot, good solutions or potential improvements.
- You can also start a discussion on that forum if you want! It will only be visible to the six people in your group.
Refactoring - Part 1
For this exercise, we will look at how to rewrite (refactor) existing code in different ways, and what benefits each new structure offers.
We will work with some code that describes a group of acquaintances, as we saw in a previous exercise (#8).
Stage 1: Remove global variables
Look at the initial version of the file, which defines a specific group using a dictionary and offers some functions for modifying and processing it.
You may notice that the dictionary is a global variable: all the functions refer to it but do not take it as a parameter.
This situation can lead to difficulties (why?), so we will restructure the code to avoid it.
Rewrite the functions so that they take in the dictionary that they work on as an argument.
For example, the function that computes the average age should now look like:
def average_age(group):
    all_ages = [person["age"] for person in group.values()]
    return sum(all_ages) / len(group)
Your task:
- Checkout the
week09branch and go to theweek09/refactoringdirectory. - Change
average_groupas above, and the other functions ofgroup.pyin a similar way. - Update the section at the end of the file (after
if __name__ == "__main__") to create the sample dictionary
there, and running of the functions that alter it. - Run your file to make sure the asserts still pass.
- Commit your changes!
- Think of the benefits and drawbacks of this approach compared to the original version.
- If you have time, think of other changes you consider useful and try them.
Answers UCL-RITS/rse-classwork-2020#3
Before:
<<<<<<< HEAD
Hola
Hello World
new-branch
After:
Hello World
Software project management - External collaborator
Stage 1
You would like some help with analysing some data. The data is stored in CSV files, and the processing consists of computing the average value for each column.
For example, for an input file with the contents
2, 10, 200, 2
0, 20, -200, 5
the output of the analysis should be
1, 15, 0, 3.5
You require a library that lets someone read a file and save the results (average values) in a different file.
The different parties should work together to understand what exactly is needed, decide on a plan of action, then write some code to solve the problem. Work in steps:
- Agree on what the program will do (what the inputs and outputs are)
- Decide a general structure for your file (the main functions you need)
- Decide a detailed structure (the inputs and return values for each function)
- Write the code
Questions may come up which are not covered by this description. Make your own decisions according to your judgement!
For collaborators/clients: Be clear about what you want and expect from the finished code, and check that your requirements are met at each stage (to the extent that it makes sense).
Update: The CSV file may optionally contain a header row, and the final code should handle that.
For example:
    Temperature, Mass, Pressure, Volume
    2, 10, 200, 2
    0, 20, -200, 5
Stage 2
You have come back with more requests. This time, things are not as clear, and requirements will change as you work. Create the code over several iterations, gradually adding functionality or making changes. At each iteration, make sure you have something that works, even if it’s not the complete product. Your workflow may look something like this:
- Decide on a new feature to add or a change to make.
- Make the required changes to the code.
- Present the result to the collaborator and your PI.
As before, make your own decisions when something is unclear. Do not worry about completing all of the requirements that may come up.
For collaborators: Keep checking your requirements to see what new changes should be made in future iterations. At the end of each iteration, see whether the changes address what they were supposed to, and that the code is functional.
Goals:
- The CSV files now have a header row. For example:
Temperature, Mass, Pressure, Volume
2, 10, 200, 2
0, 20, -200, 5
- The library should also support input from JSON files. For example:
{
    "record1": [
        2,
        10,
        200,
        2
    ],
    "record2": [
        0,
        20,
        -200,
        5
    ]
}
or
{
    "record1": {
        "temperature": 2,
        "mass": 10,
        "pressure": 200,
        "volume": 2
    },
    "record2": {
        "temperature": 0,
        "mass": 20,
        "pressure": -200,
        "volume": 5
    }
}
Update: More requirements have arisen
- The output file should include the date and time of the analysis
- The library should include an executable Python file that invokes the analysis
Use Travis-ci to run the tests for you
Use CI to run the tests for you.
It's always possible that we forget to run the tests before pushing to GitHub. Luckily, continuous integration platforms can help us catch failing tests even when we do forget to run them.
In this exercise, you will use Travis-CI to do exactly this.
Set up Travis-ci to run our tests for every commit we push to our repository.
- Follow the guide provided by Travis for the general setup and the python instructions for testing this repository.
- Add
.travis.ymlto the repository, commit it and push it to github. Link to this issue on that commit.
If you're done with this issue, try to add test coverage (first locally, then on Travis) by working on this related issue: #91
Sample solution to this issue and to #91: the .travis.yml file might look something like this.
Measuring performance and using numpy
Approximating π using pure Python and numpy
There are many ways in which one can write a program that does the same thing, and there are advantages and disadvantages to each. In some cases, it is an advantage for a program to execute quickly.
This exercise is the first of a series of four exercises that look at execution time of four different ways to calculate π using the same Monte Carlo approach. In this approach, π is approximated by sampling n random points inside a square with side length 1, computing the proportion of those points that fall inside the unit circle, and multiplying that by 4/n.
This exercise initially uses pure Python to accomplish this approximation of π. The code is already written, and you can find it in calc_pi.py on the week10 branch of this repository. Your job is to understand the code, measure how much time it takes to complete, and then adapt it to use numpy instead of pure Python.
Measuring how long code takes using timeit
The code uses the timeit module from the standard library. There are different ways you can use timeit: either as a module or from its own command-line interface. Check out timeit's documentation to see the different possibilities. Our calc_pi.py wraps the module implementation of timeit, and provides a similar interface than the command line interface provided by timeit.
Your task:
- As it is now you can run the file with or without arguments. Run it!
- Run it now with some arguments (use
--helpor look at the source code to know which arguments you can use) - In case you would like to time a function (like
calculate_piin this case) without writing all that boilerplate, you can runTry it!python -m timeit -n 100 -r 5 -s "from calc_pi import calculate_pi_timeit" "calculate_pi_timeit(10_000)()"
- Try to understand the source code more in-depth:
- What does
calculate_pi_timeitfunction do? - How does
timeit.repeatwork? - Why do we repeat the calculation multiple times?
- Do you think some changes that could make the code faster?
- What does
Using numpy
The course notes describe how using the numpy library can lead to faster and more concise code.
Your task:
- Create a new file
calc_pi_np.pythat does the same ascalc_pi.py, but uses numpy arrays instead of lists. Update the functions accordingly
Hint: Instead of creating nxandyvalues independently, generate a(n, 2)array. - Which version of the code, the one that uses
numpyor the one that uses pure Python, is faster?
Automating `git bisect`
In your homework, you've seen that even for just 24 commits (and there can be many more), you need to type quite a few, repetitive git bisect commands to find the commit you're looking for.
It's therefore something that is useful to automate. This section in the notes may be useful. Given the same situation as in this week's homework:
-
Write some code to solve Charlene's problem using
git bisectautomatically.Hint: To do this, you can use
subprocessto run a command. For example:subprocess.run(["ls", "-lh"])
will execute the
lscommand with the-lharguments.
If you're on Windows, ideally use Git Bash (If you're on the Windows Command Promptcmd, you need to passcmd-compatible commands to subprocess, e.g.dirinstead ofls). On Windows, you might also need to passshell=Trueas an additional argument.subprocess.run(["ls", "-lh"], shell=True)
Use
assertor a similar function (e.g.,np.testing.assert_array_equal) to make the program fail, and so distinguish between "good" and "bad" commits. -
Do you get the same result (commit hash and date) as you did in your homework?
Recommend Projects
-
 React
React
A declarative, efficient, and flexible JavaScript library for building user interfaces.
-
Vue.js
🖖 Vue.js is a progressive, incrementally-adoptable JavaScript framework for building UI on the web.
-
 Typescript
TypeScript is a superset of JavaScript that compiles to clean JavaScript output.
-
TensorFlow
An Open Source Machine Learning Framework for Everyone
-
Django
The Web framework for perfectionists with deadlines.
-
 Laravel
A PHP framework for web artisans
-
D3
Bring data to life with SVG, Canvas and HTML. 📊📈🎉
-
Recommend Topics
-
javascript
JavaScript (JS) is a lightweight interpreted programming language with first-class functions.
-
web
Some thing interesting about web. New door for the world.
-
server
A server is a program made to process requests and deliver data to clients.
-
Machine learning
Machine learning is a way of modeling and interpreting data that allows a piece of software to respond intelligently.
-
Visualization
Some thing interesting about visualization, use data art
-
Game
Some thing interesting about game, make everyone happy.
Recommend Org
-
Facebook
We are working to build community through open source technology. NB: members must have two-factor auth.
-
Microsoft
Open source projects and samples from Microsoft.
-
Google
Google ❤️ Open Source for everyone.
-
Alibaba
Alibaba Open Source for everyone
-
D3
Data-Driven Documents codes.
-
Tencent
China tencent open source team.