


Widgets for CMV, the Configurable Map Viewer created by Tim McGee of MoosePoint Technology
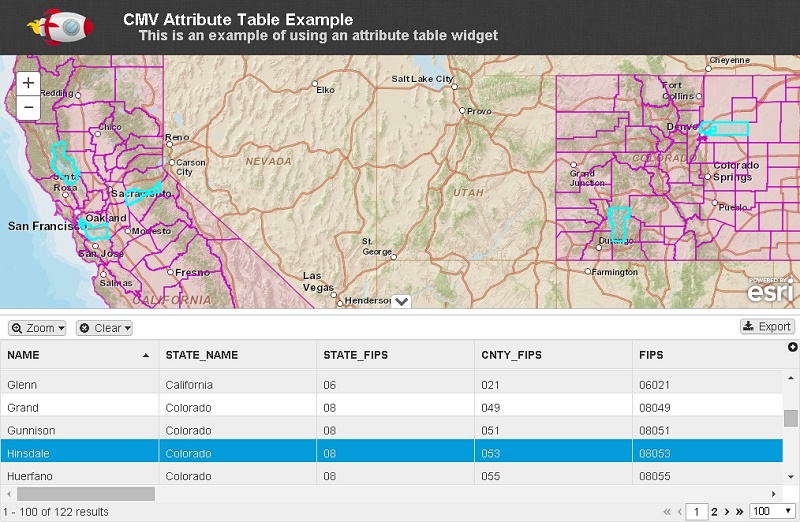
- Attributes Tables
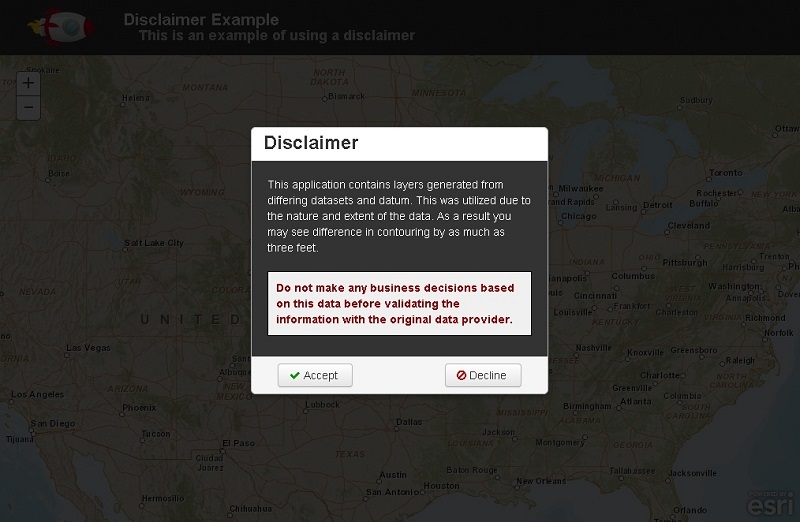
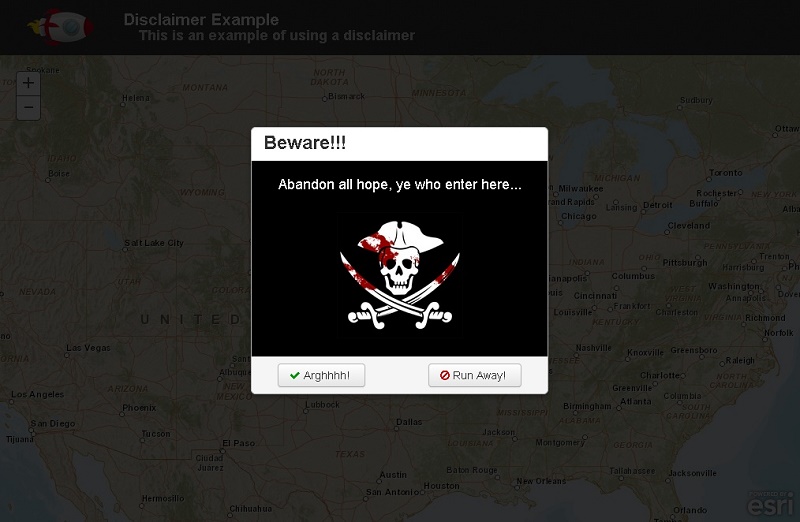
- Disclaimer
- Elevation Profile
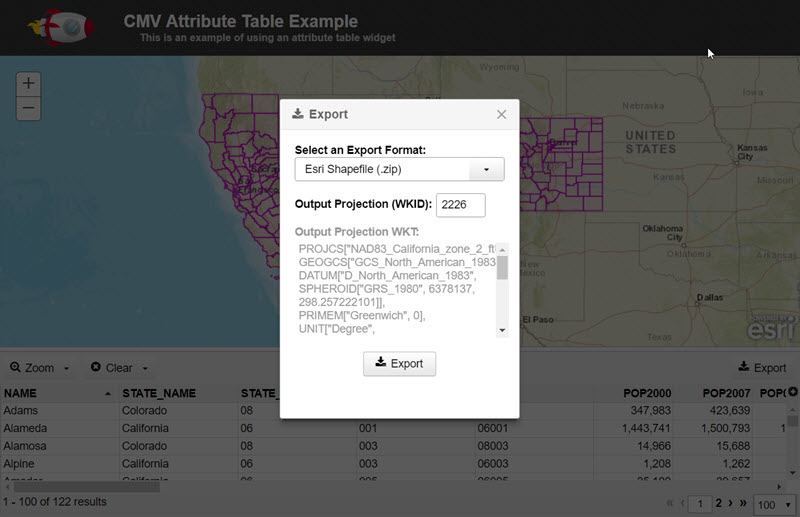
- Export
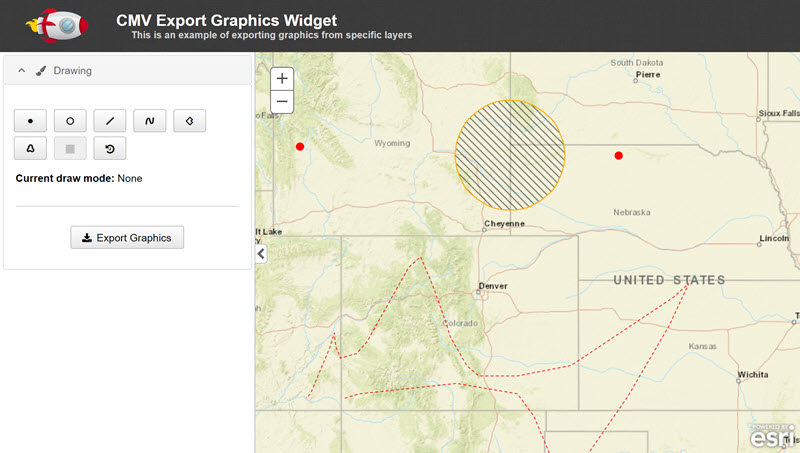
- Export Graphics
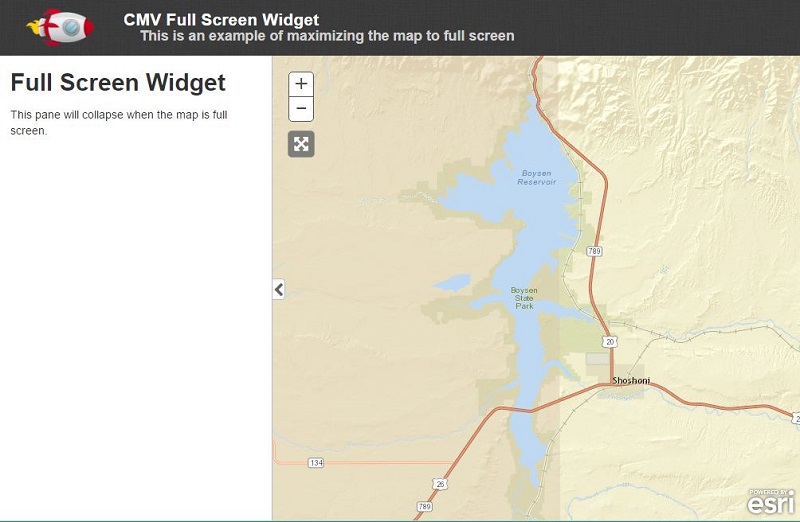
- Full Screen
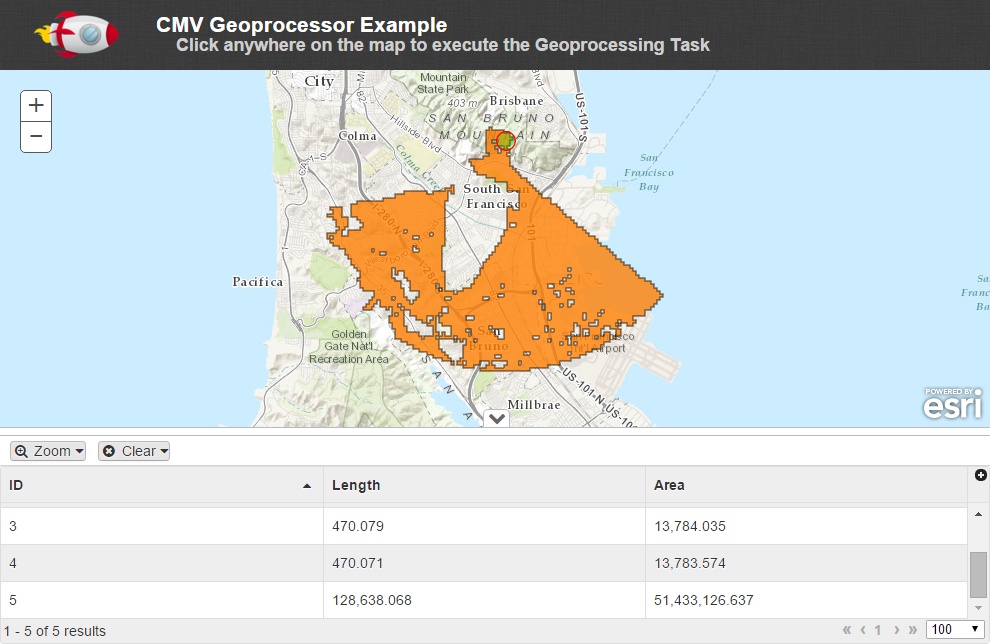
- Geoprocessor
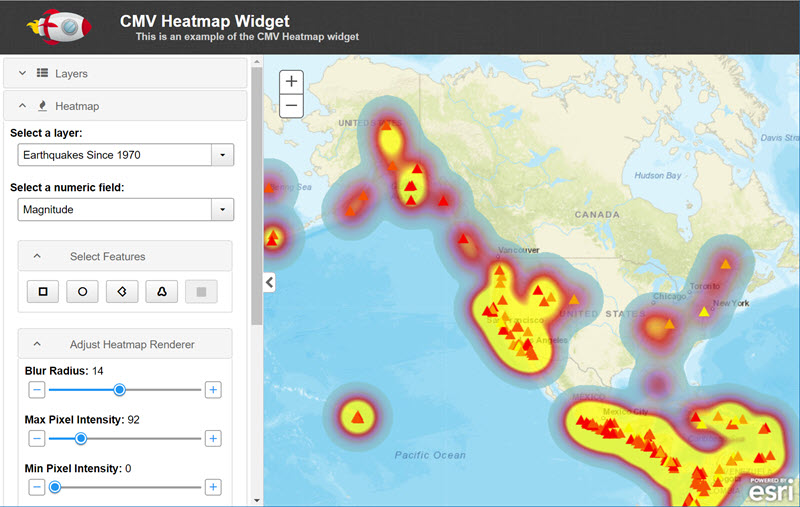
- Heatmap
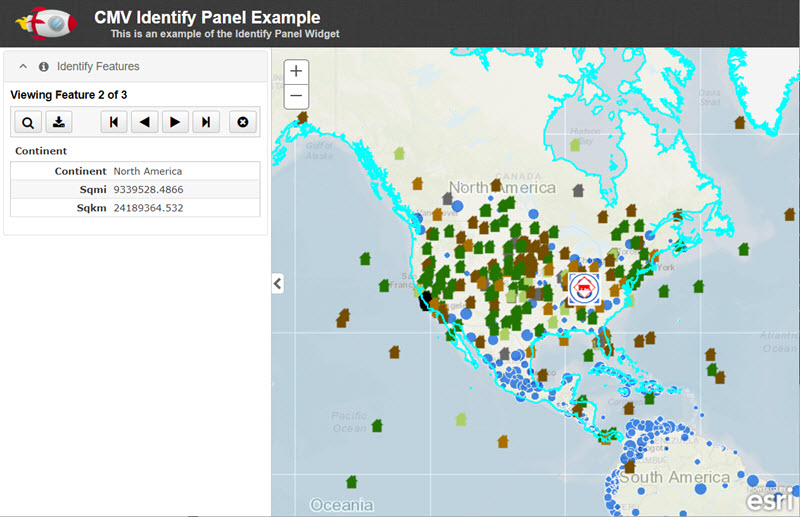
- IdentifyPanel
- Introduction
- Layer Labels
- Layer Toggle
- Locator Control
- Map Loading
- Mapillary
- Maptiks
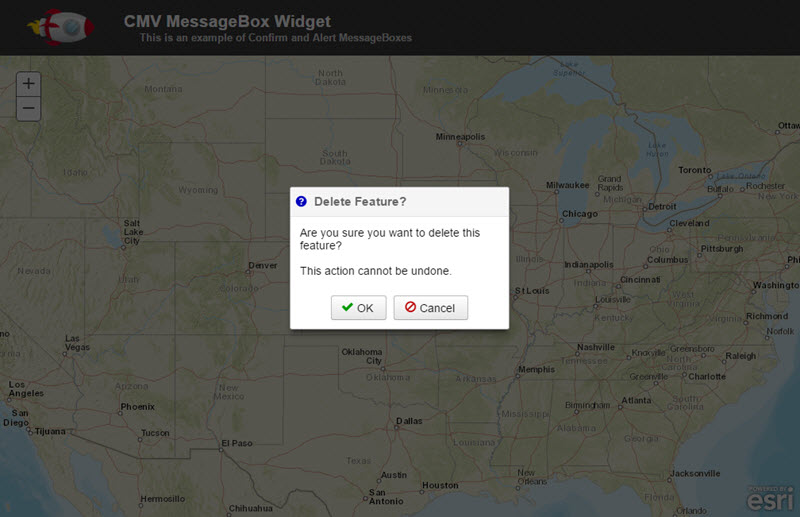
- MessageBox
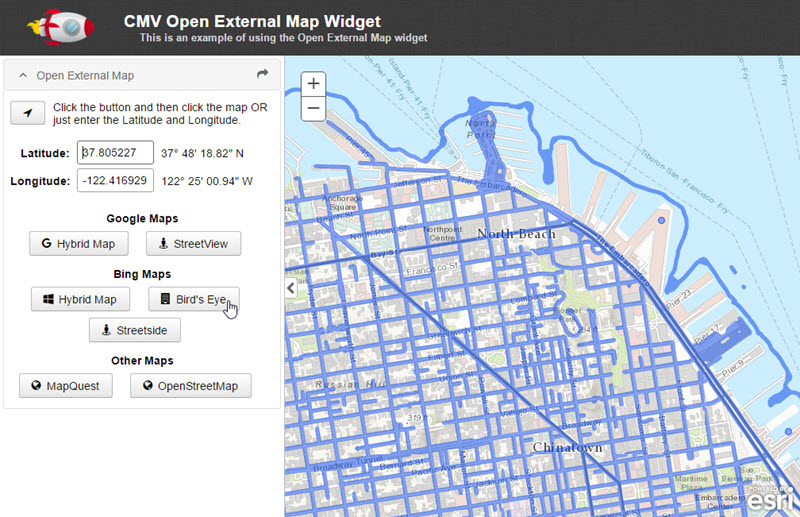
- Open External Map
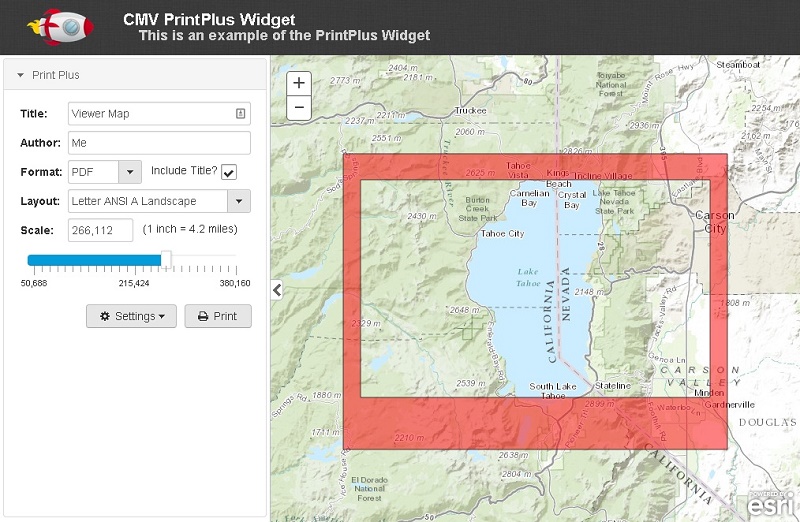
- Print Plus
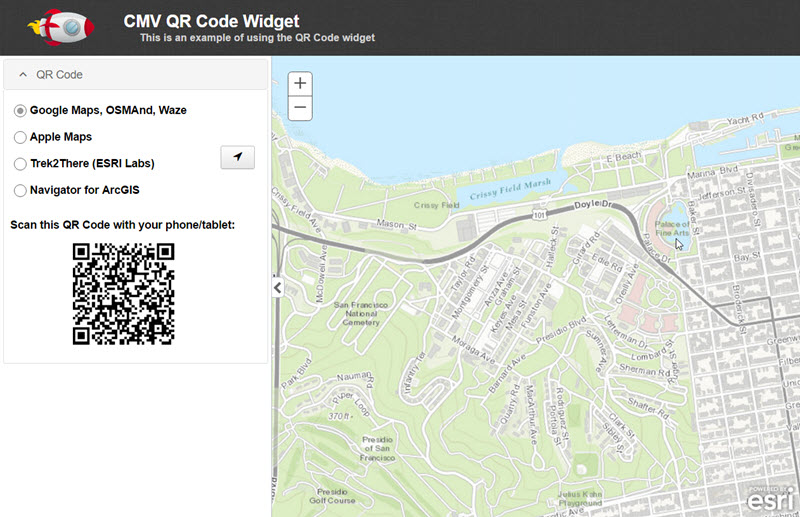
- QR Code
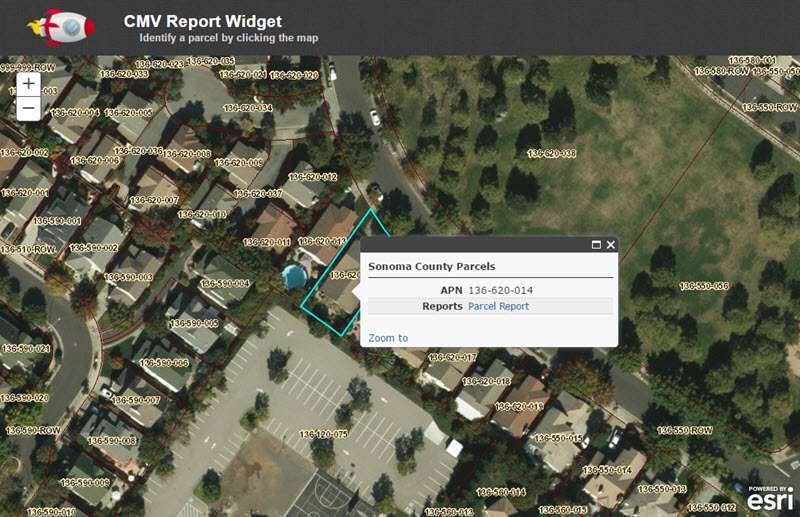
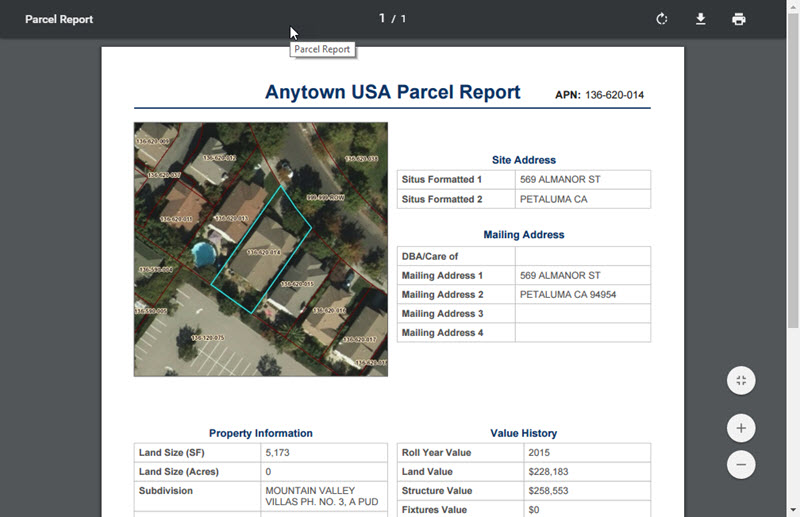
- Report
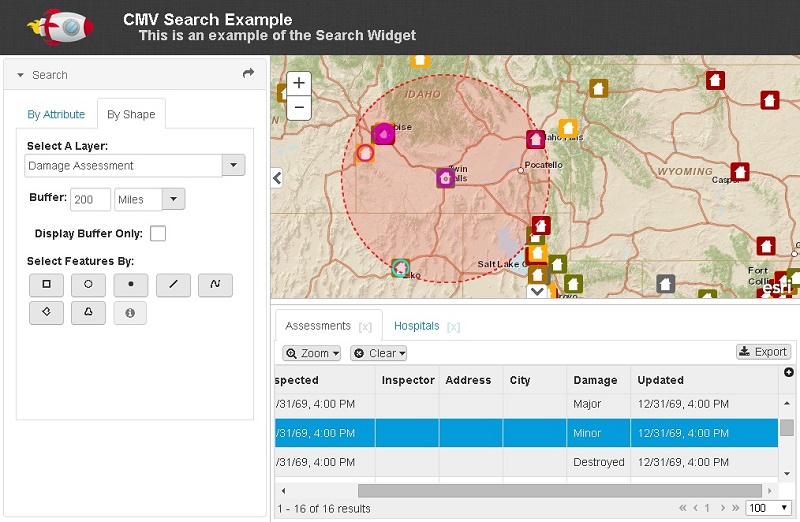
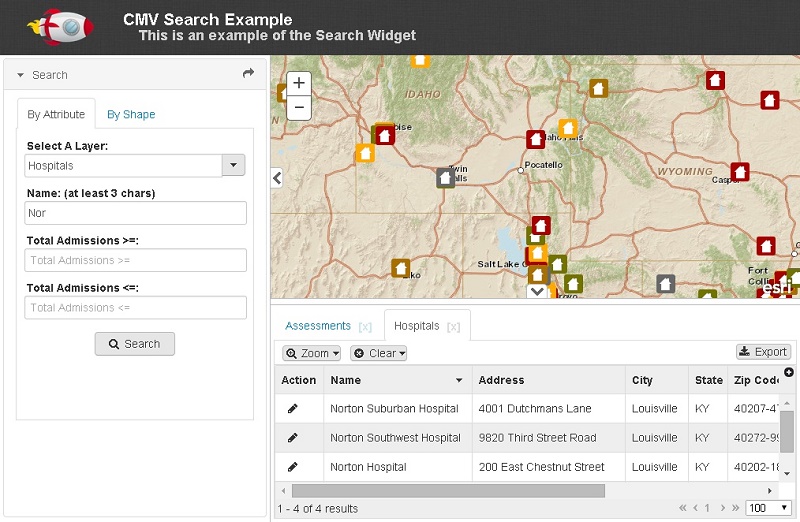
- Search
- Share
- Toggle StreeView Tiles
- What3Words
- Zoom to Feature
Each widget in this repo has at least one configuration example in the config folder. This folder also contains additional examples for including ESRI widgets, other widgets and functionality.
A highly configurable widget to display the results of one or more Query, Find or Geoprocessor Tasks.
A simple yet configurable disclaimer widget.
An updated Elevation Profile widget based on previously contributed widgets by goriliukasbuxton and ERS-Long.
Export features from the Attributes Tables widget or other widgets that have a dgrid. Features can be exported in tabular and spatial formats.
The Export Graphics widget works with the Export widget to allow the user to export graphic features from one or more Graphic or Feature layers.
A simple widget containing a button to toggle the CMV map to a maximized full screen view and restore it to the original dimensions.
An example widget demonstrating the display of results from a Geoprocessing Task in the Attributes Tables widget.
The Heatmap widget uses a HeatmapRenderer to render feature layer data into a raster visualization that emphasizes areas of higher density or weighted values. The blur radius, maximum value and minimum value for the renderer can be adjusted. All features from the layer can be included or use draw tools to select a subset of features.
A widget to replace the map's infoWindow including integration with the Export widget. You can include your own buttons as well. This widget is an updated and enhanced version of one originally created by Doug Chamberlain.
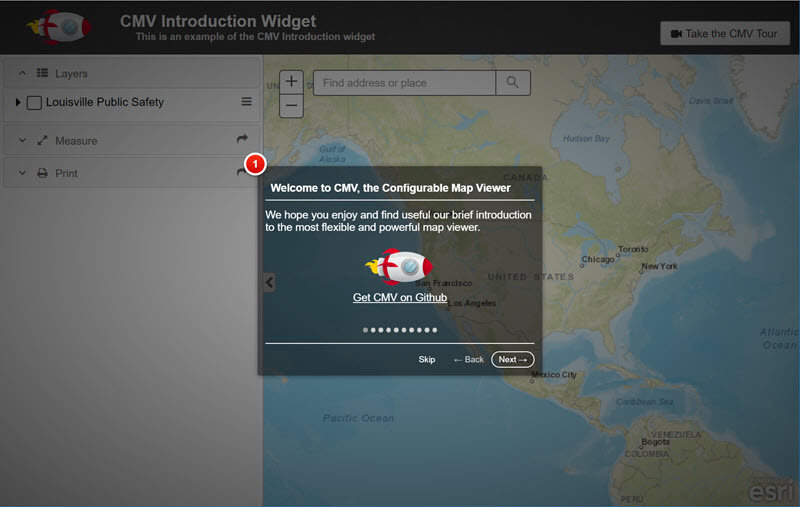
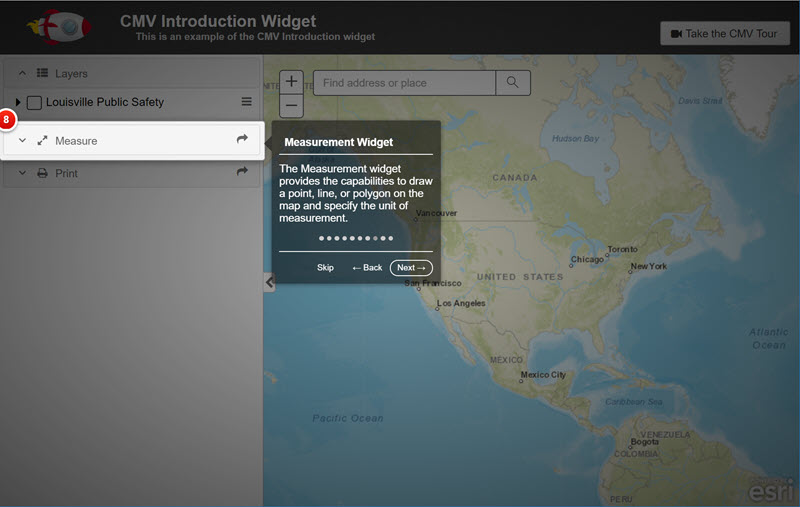
The Introduction Widget provides a product tour or tutorial for your application using IntroJS.
A simple widget to add labels for one or more Feature Layers.
A simple widget to toggle the visibility of a set of layers. Only a single layer in the set can be visible at any time. All others are turned off when the target layer's visibility is set.
A widget to allow the user to change the properties of the CMV Locate Button widget in real-time.
A widget to add a Loading indicator in the center of the map.
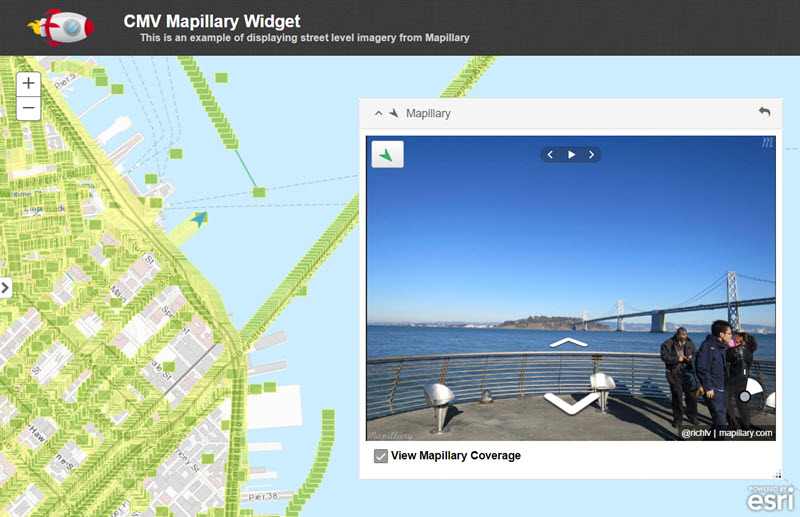
A replacement for the CMV Google StreetView widget that display street level imagery from Mapillary using MapillaryJS.
A widget to add detailed map analytics to any CMV application using Maptiks. Maptiks provides in-depth user insights by tracking how visitors click, pan and zoom on your maps.
Show an Alert or Confirmation modal dialog box. Intended to be called from other widgets.
Coming Soon
Open maps in an external window for Google Hybrid, Google StreetView, Bing Hybrid, Bing Bird's Eye, Bing Streetside, MapQuest and OpenStreetMap. The map is centered on the coordinates based on a map click or Latitude and Longitude values provided by the user. Can be combined with the Toggle StreetView Tiles widget to show the availability of Google StreetView while clicking on the map.
An updated version of the PrintPlus widget originally created by @LarryStout in early 2014. Larry's original source code can be found in here with a few of his other widgets.
Shows a QR code for the current map to open mobile applications on your phone/tablet.
Highly configurable widget used to create a multi-page PDF report from a single feature or multiple features.
Used in conjunction with the Attributes Tables to provide a user interface for querying feature layers, dynamic layers, tables and related records using QueryTask and FindTask.
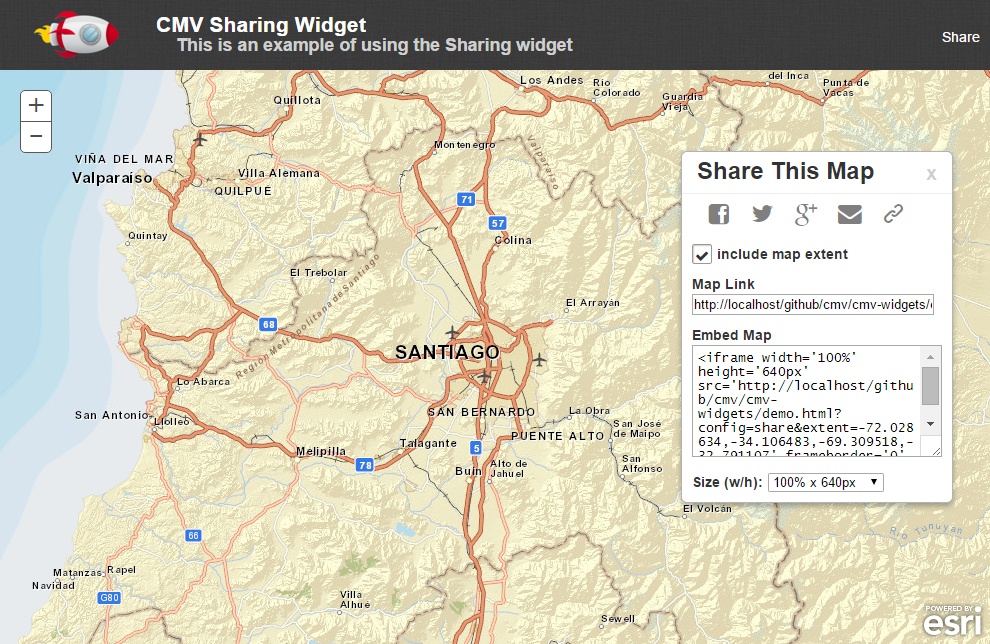
Share your map by using Facebook, Twitter, Google+, E-Mail, Link, or embedded iFrame code.
Used in conjunction with the CMV StreetView widget or the Open External Map widget. Shows a StreetView tiles layer when waiting for a map click to get coordinates for the respective widgets.
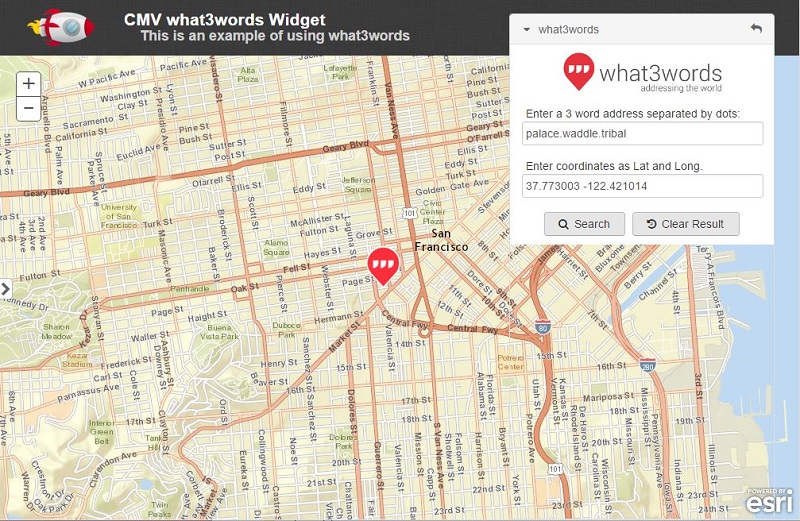
A simple widget to send a 3 word address or lat/lng to what3words and zoom the map to the resulting location. The lat/lng and 3 word address for the location are displayed from the search result.
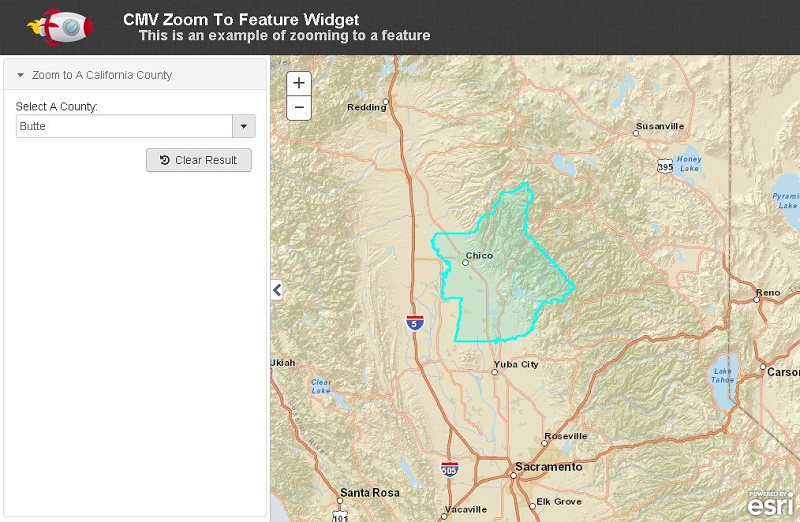
A simple widget to provide a drop-down list of features to zoom to on the map. Similar to bookmarks but driven by actual data in a Map Service.


![greenkeeper[bot] avatar](https://avatars.githubusercontent.com/in/505?v=4 "greenkeeper[bot]")


